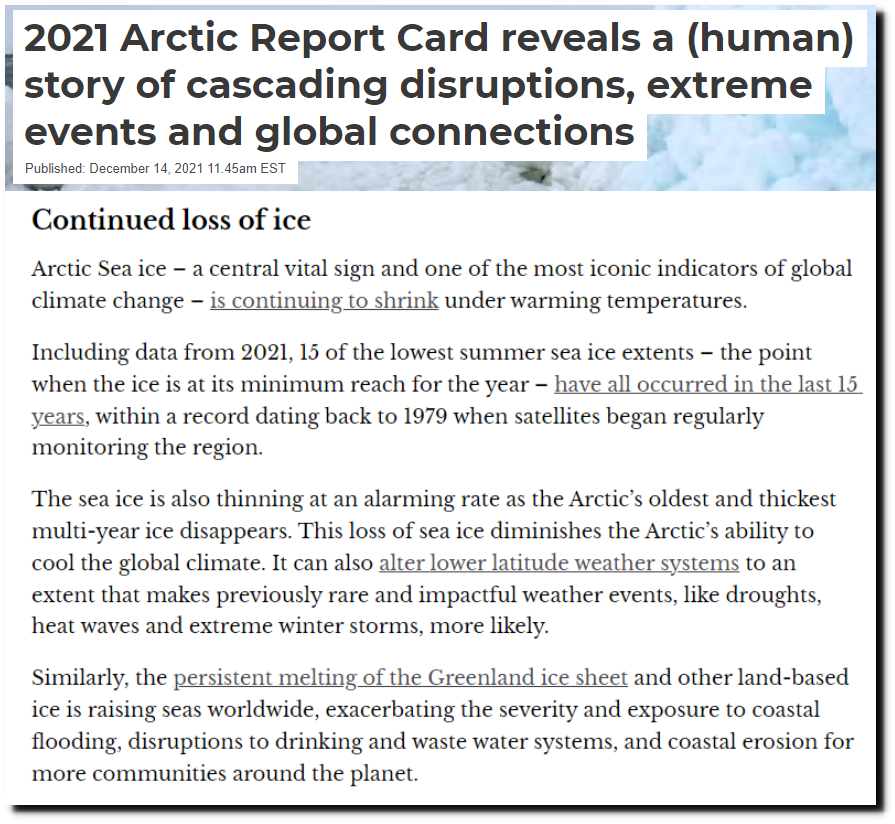
NOAA claims that sea ice is disappearing, the Greenland ice sheet is melting and this is causing sea level rise and extreme weather.
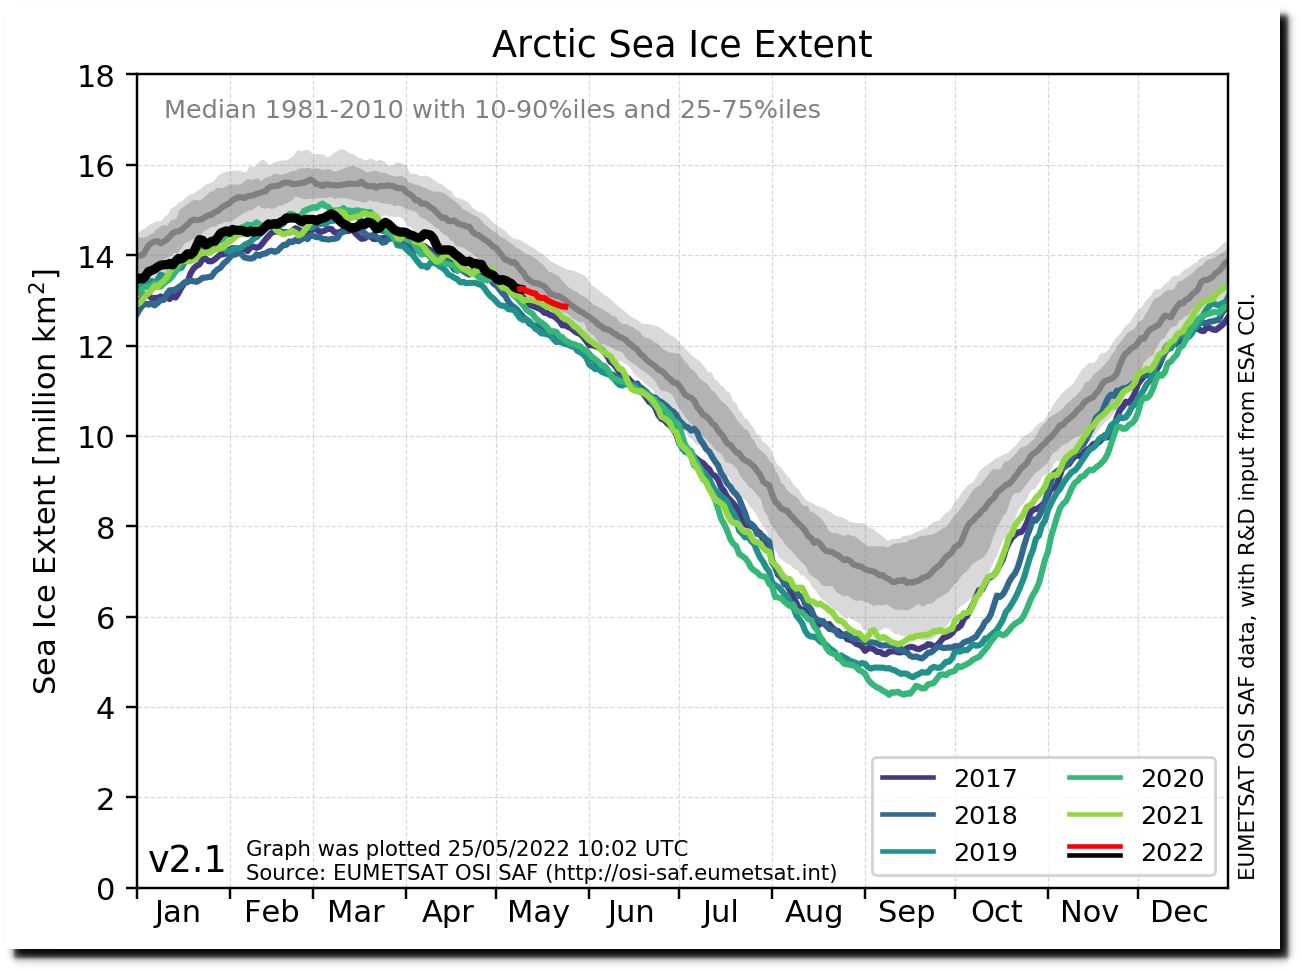
Arctic sea ice extent is right at the 1981-2010 median.
Ocean and Ice Services | Danmarks Meteorologiske Institut
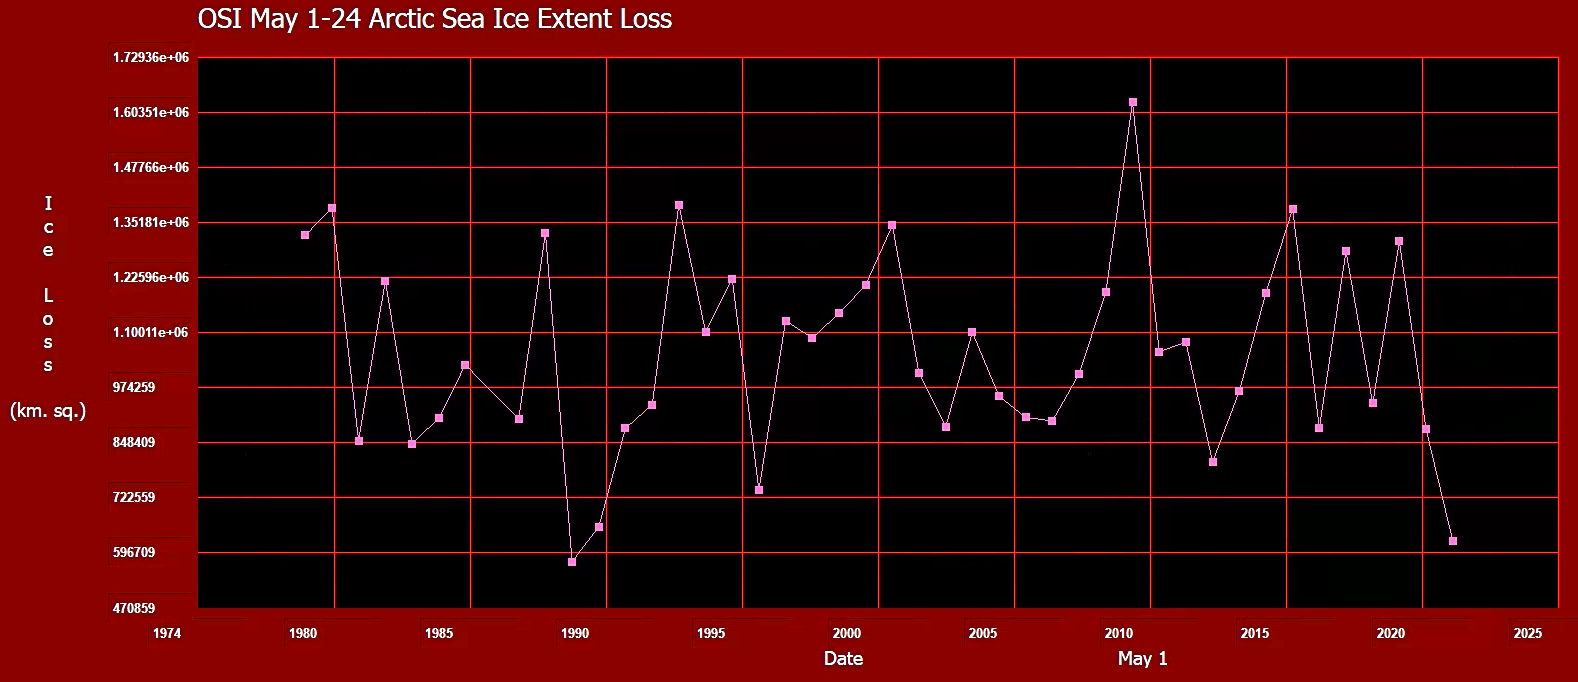
Melt during May has been second slowest on record.
ftp://osisaf.met.no/prod_test/ice/index/v2p1/nh/osisaf_nh_sie_daily.txt
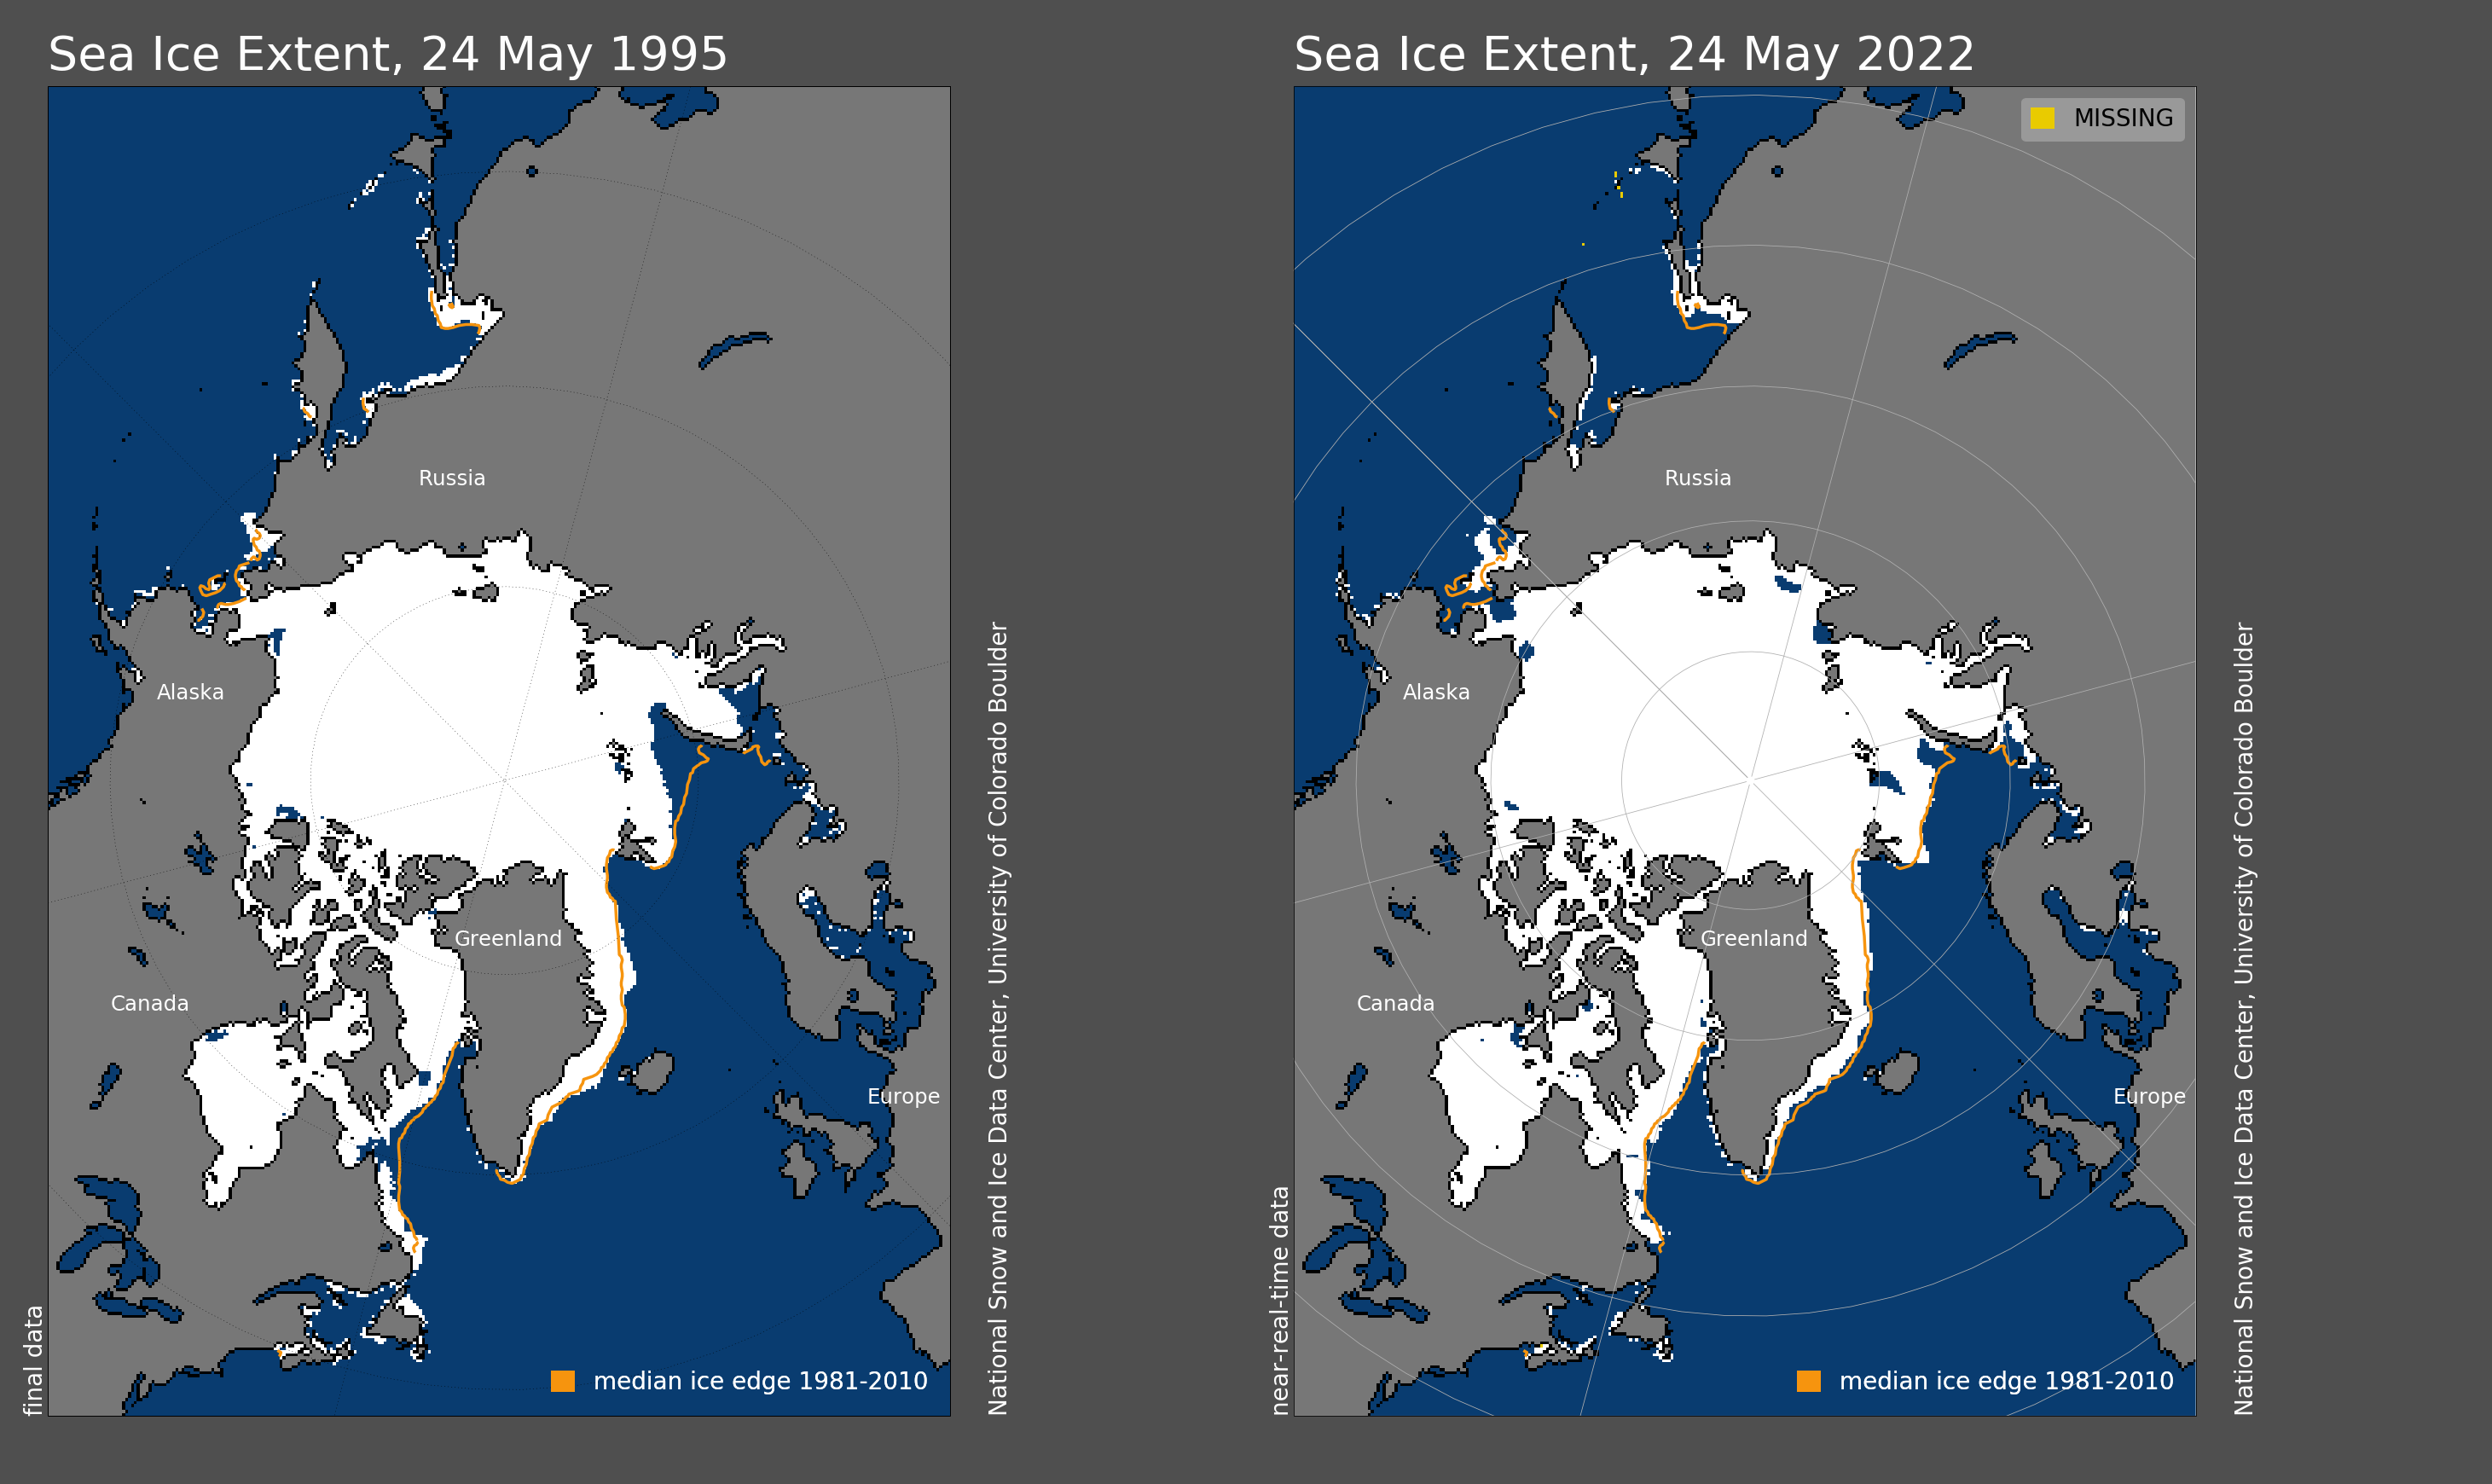
Extent is higher now than 1995.
There has been no trend in Arctic sea ice extent over the past 15 years, since Nobel Laureate Al Gore predicted an ice free Arctic by 2014.
ftp://osisaf.met.no/prod_test/ice/index/v2p1/nh/osisaf_nh_sie_daily.txt
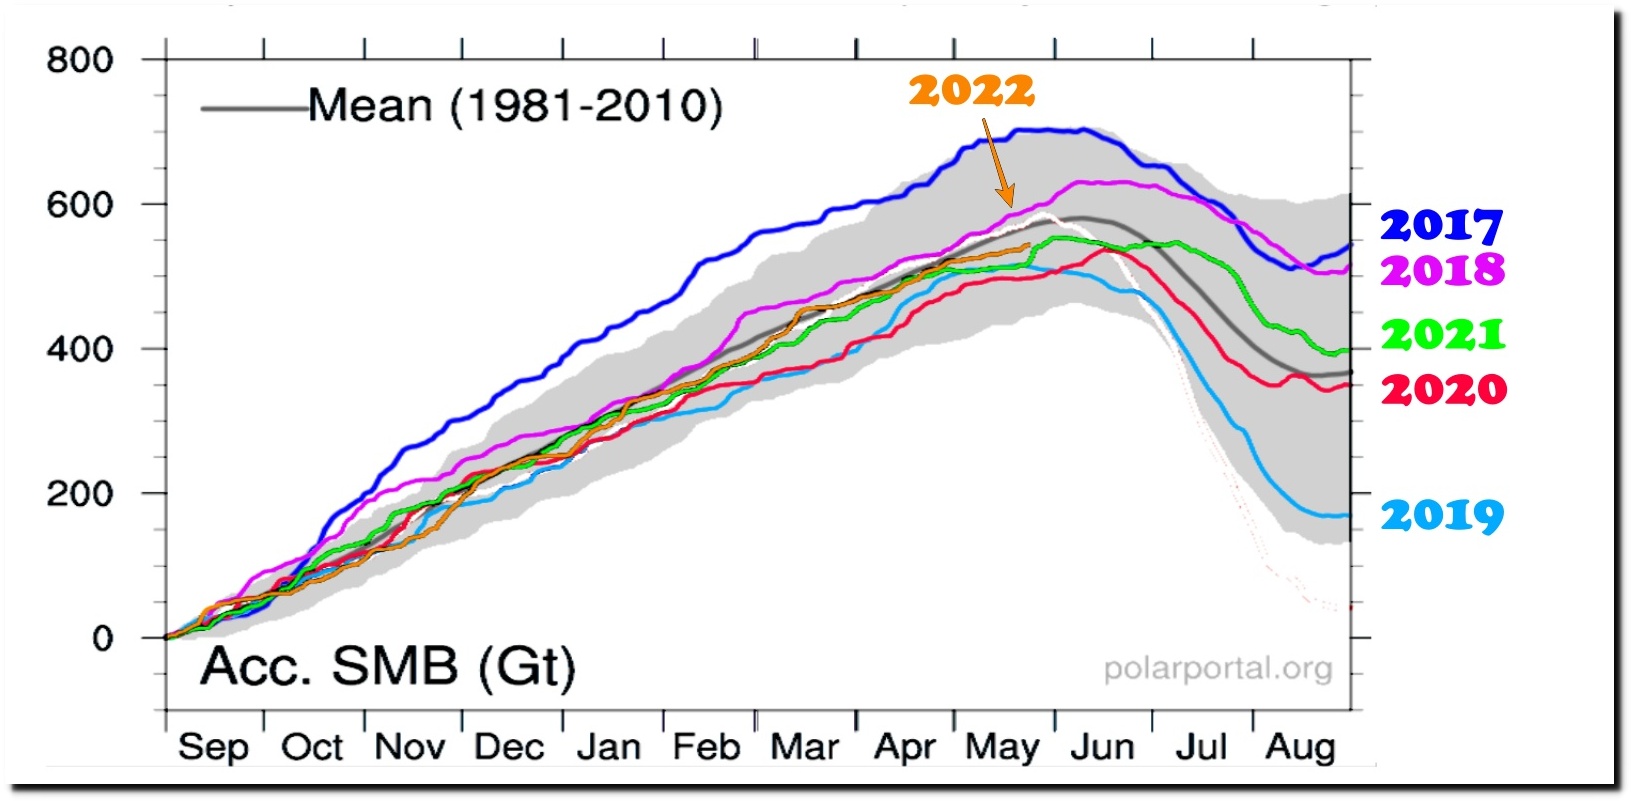
The surface mass balance of Greenland has been above average over the past six years.
Surface Conditions: Polar Portal
After 170 years of retreat, Greenland’s largest glacier is expanding.

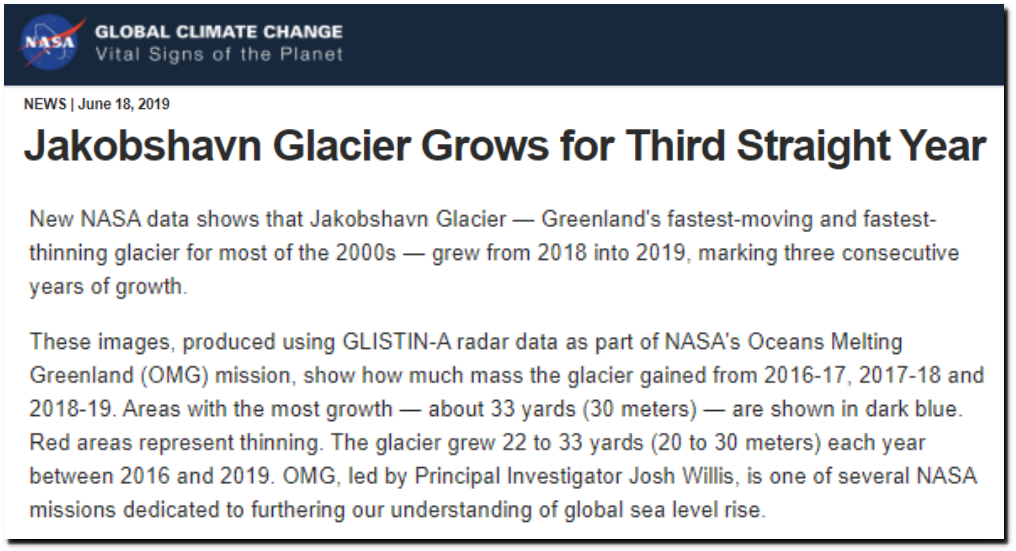
Jakobshavn Glacier Grows for Third Straight Year – Climate Change: Vital Signs of the Planet
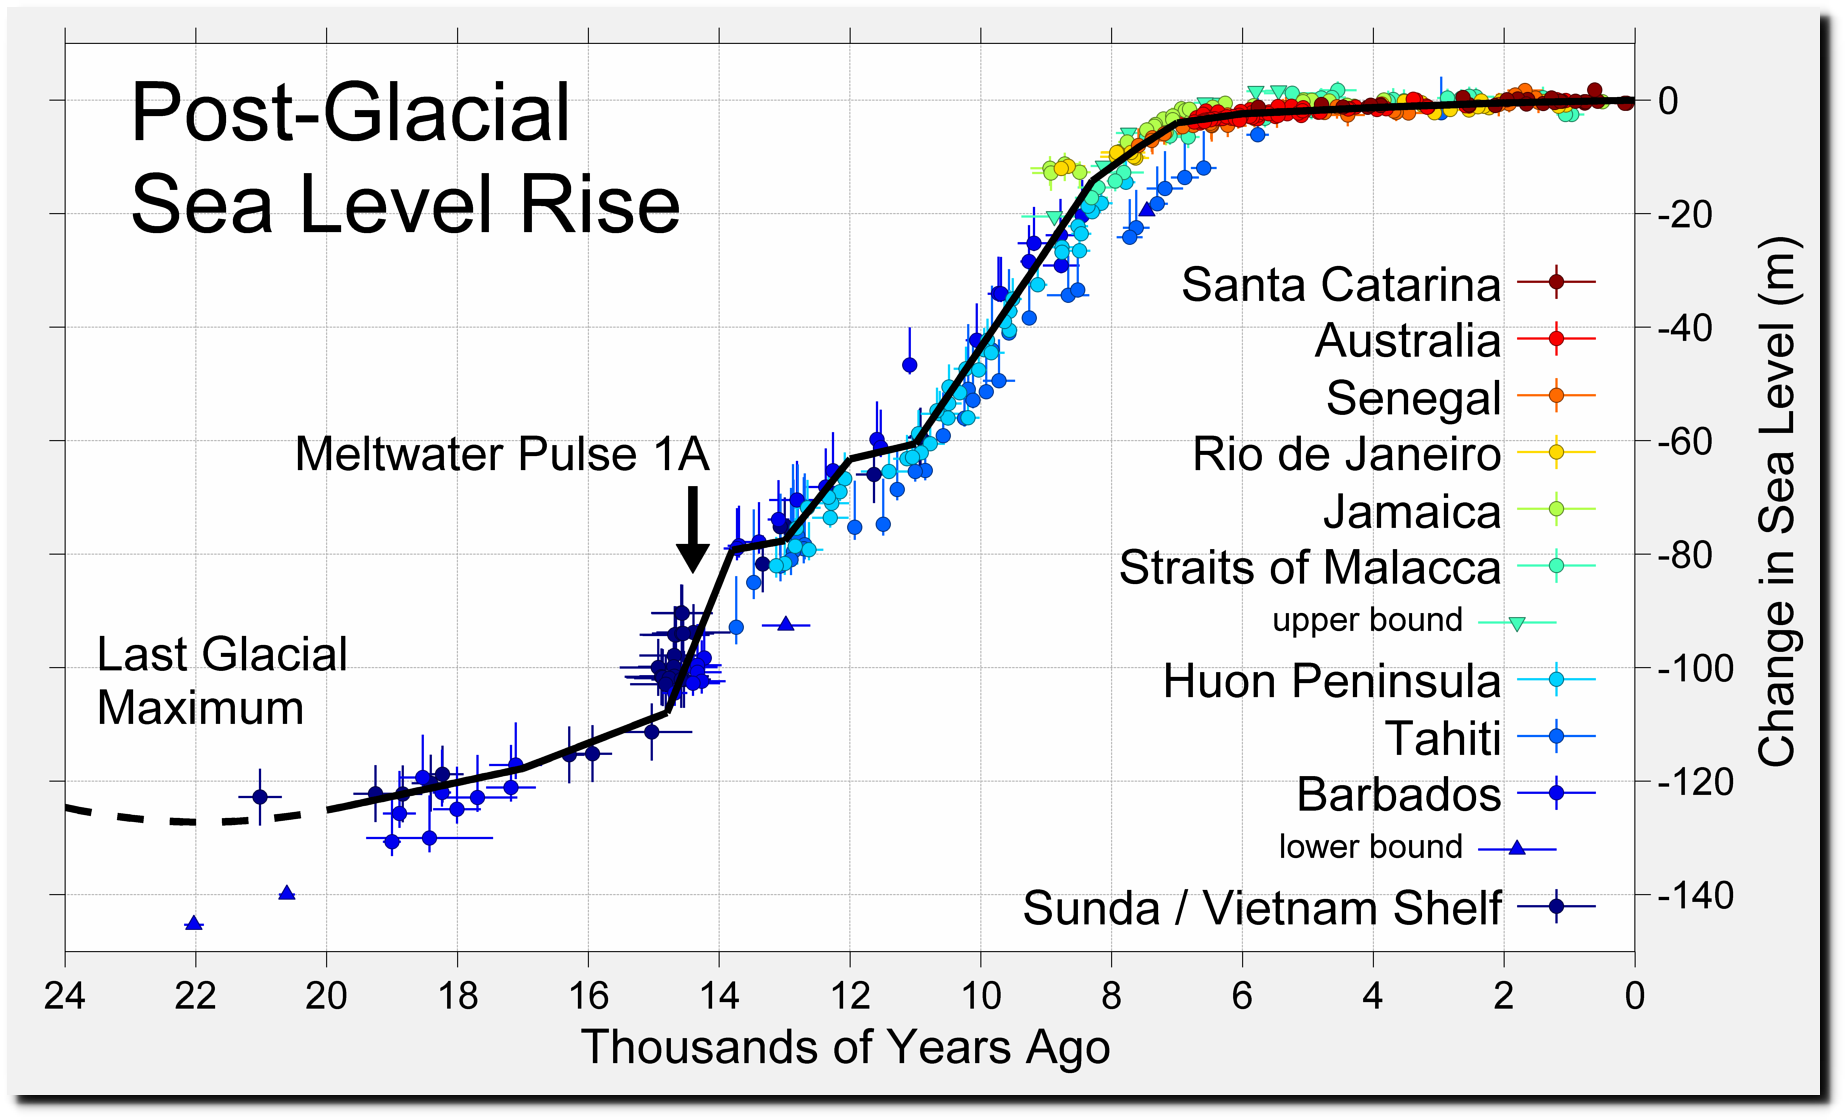
Post-Glacial_Sea_Level.png (1813×1088)
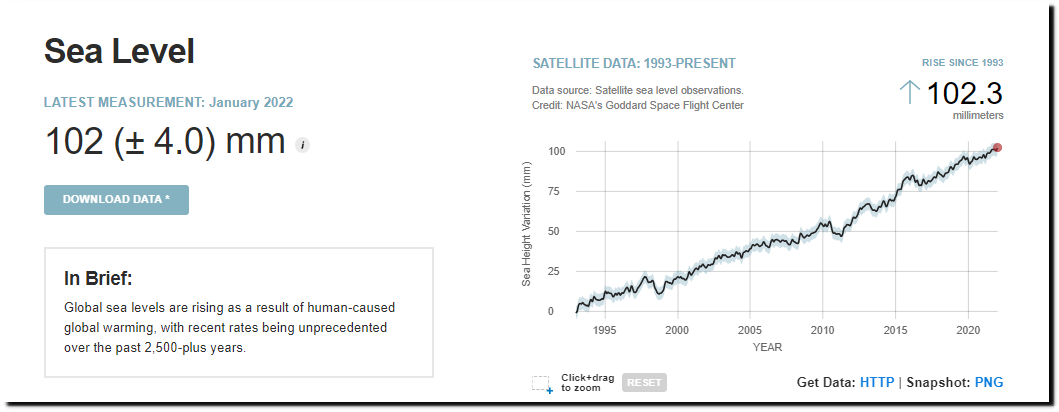
NASA claims that sea level is rising at “unprecedented rates” of 3.5 mm/year.
Sea Level | Vital Signs – Climate Change: Vital Signs of the Planet
They have inflated that number since eight years ago when they said 3.17 mm/year.
Climate Change: Vital Signs of the Planet: Sea Level
The NASA number is about double what NOAA has measured using tide gauges.
” the absolute global sea level rise is believed to be 1.7-1.8 millimeters/year”
Sea Level Trends – NOAA Tides & Currents
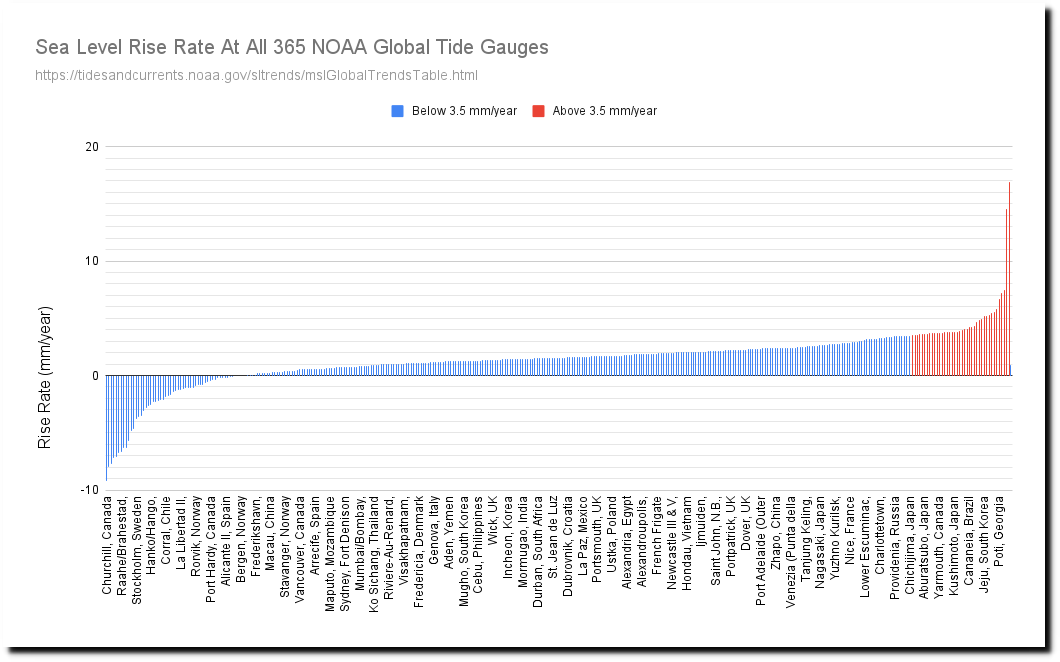
NOAA shows that 89% of global tide gauges are below NASA’s claimed average.
Sea Level Trends – NOAA Tides & Currents
Sea level rise rates have not changed over the past century and are lower than all of NOAA’s scenarios.
Sea Level Trends – NOAA Tides & Currents
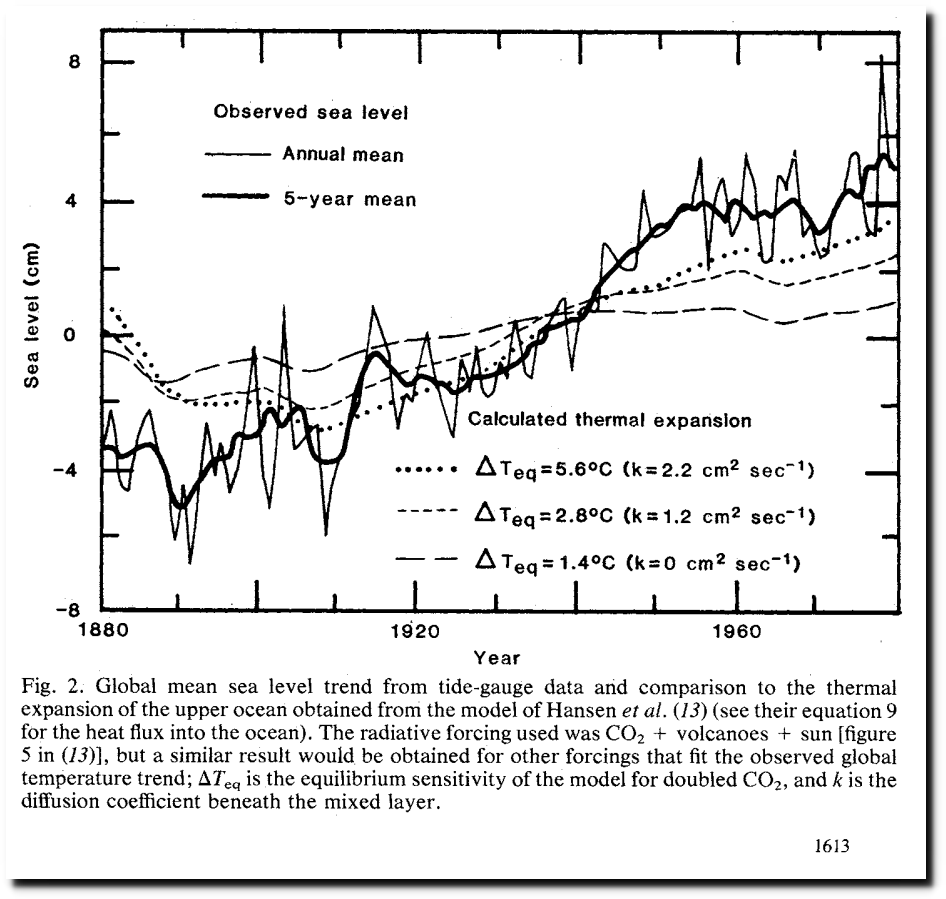
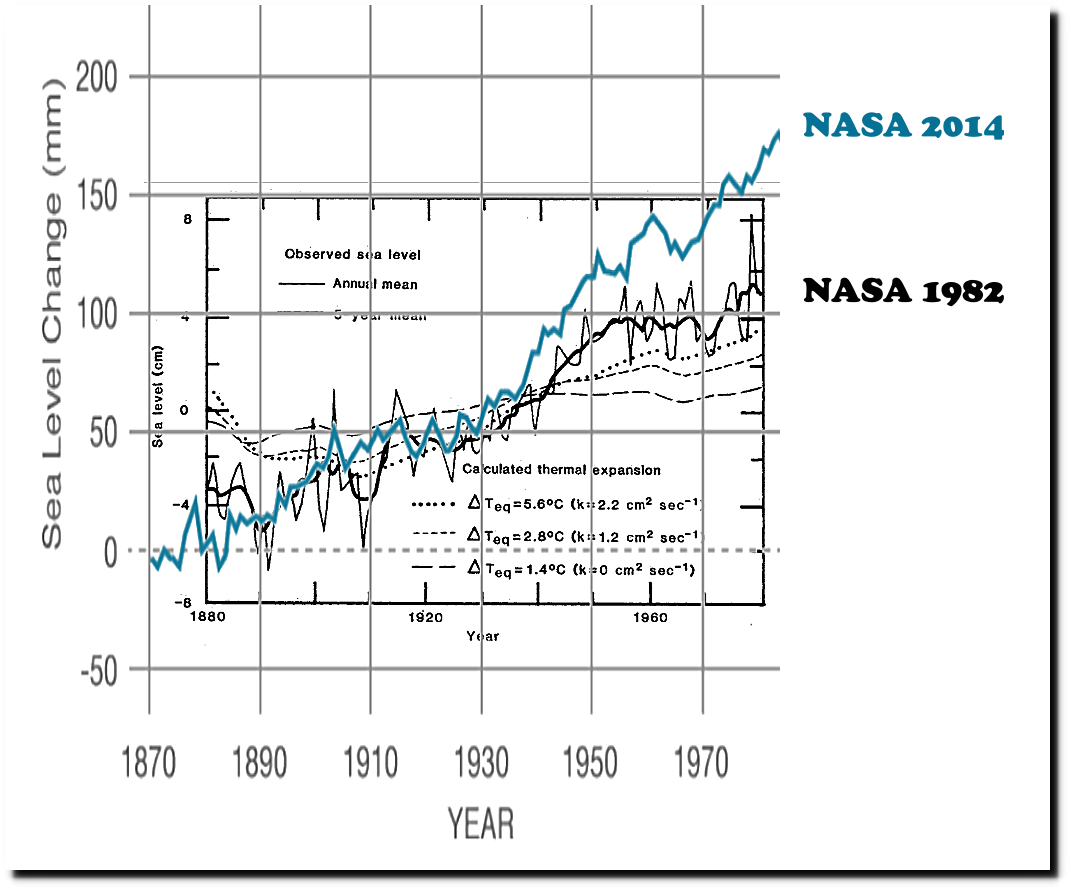
NASA has massively altered their sea level data over the past forty years.
High tide sea level at La Jolla, California has not changed perceptibly over the past 150 years.
As is always the case with government agencies and the press, their climate claims have no basis in history, facts or science.

