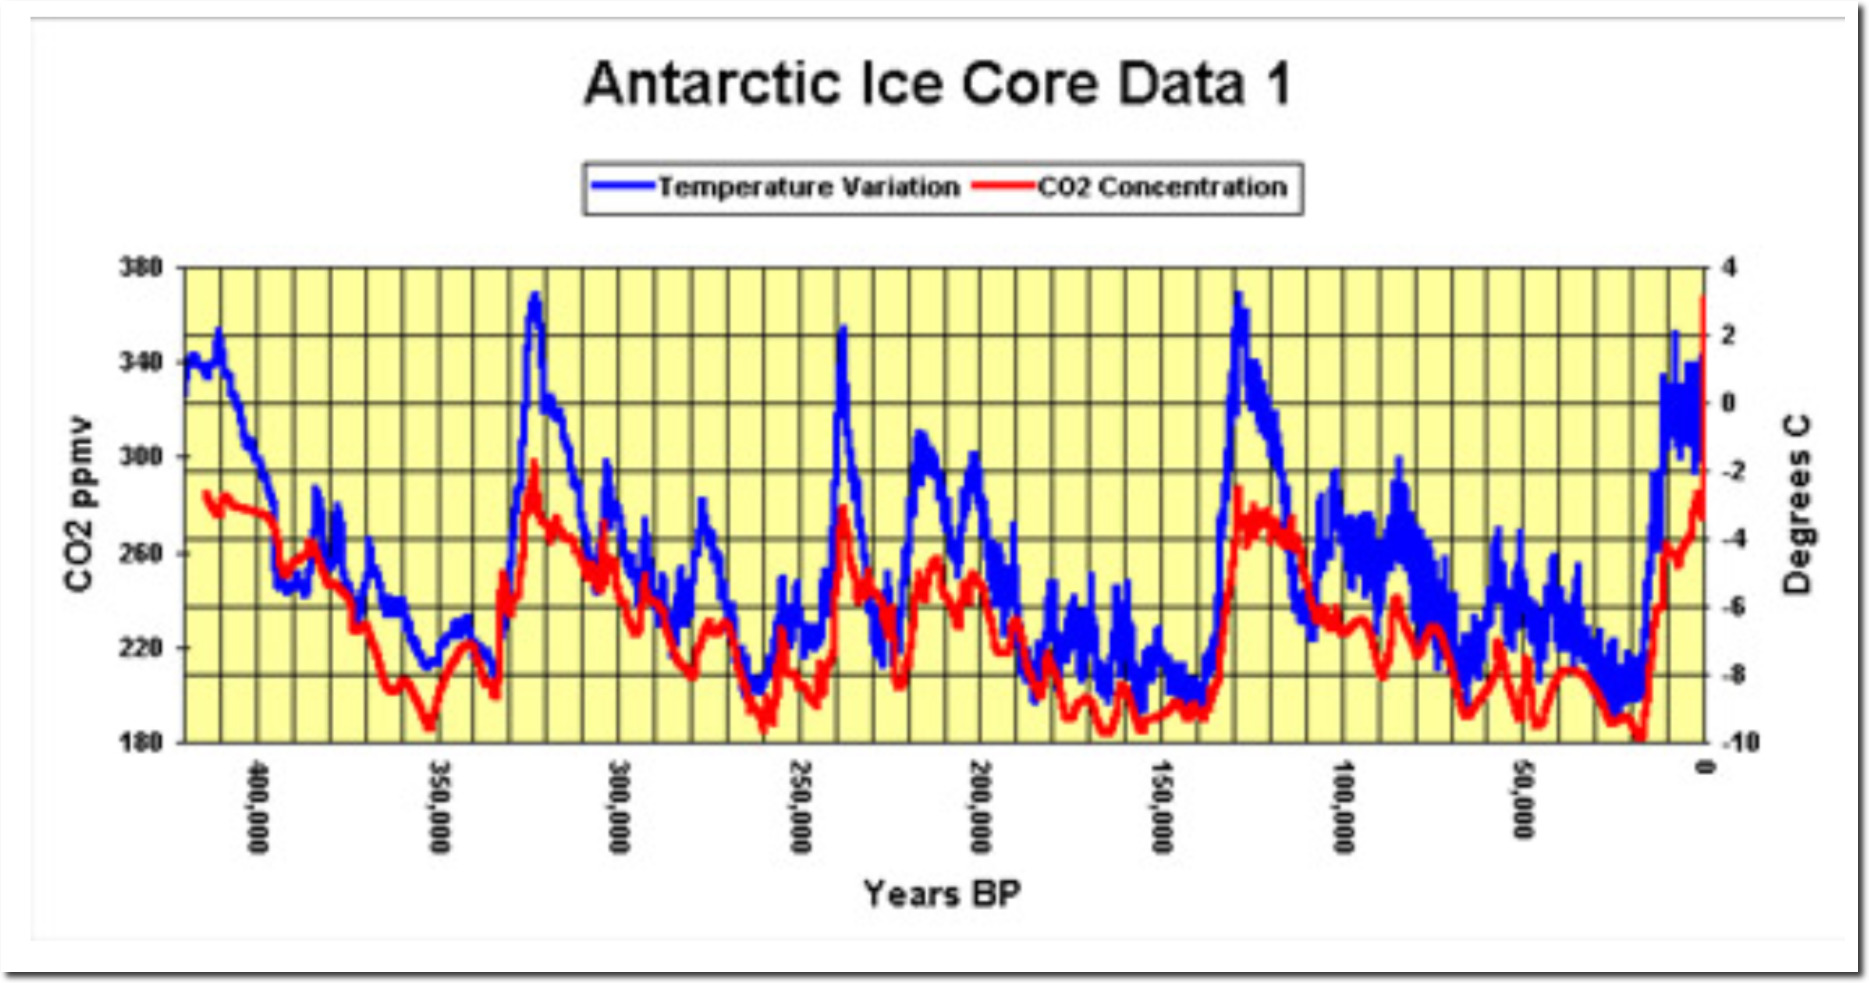
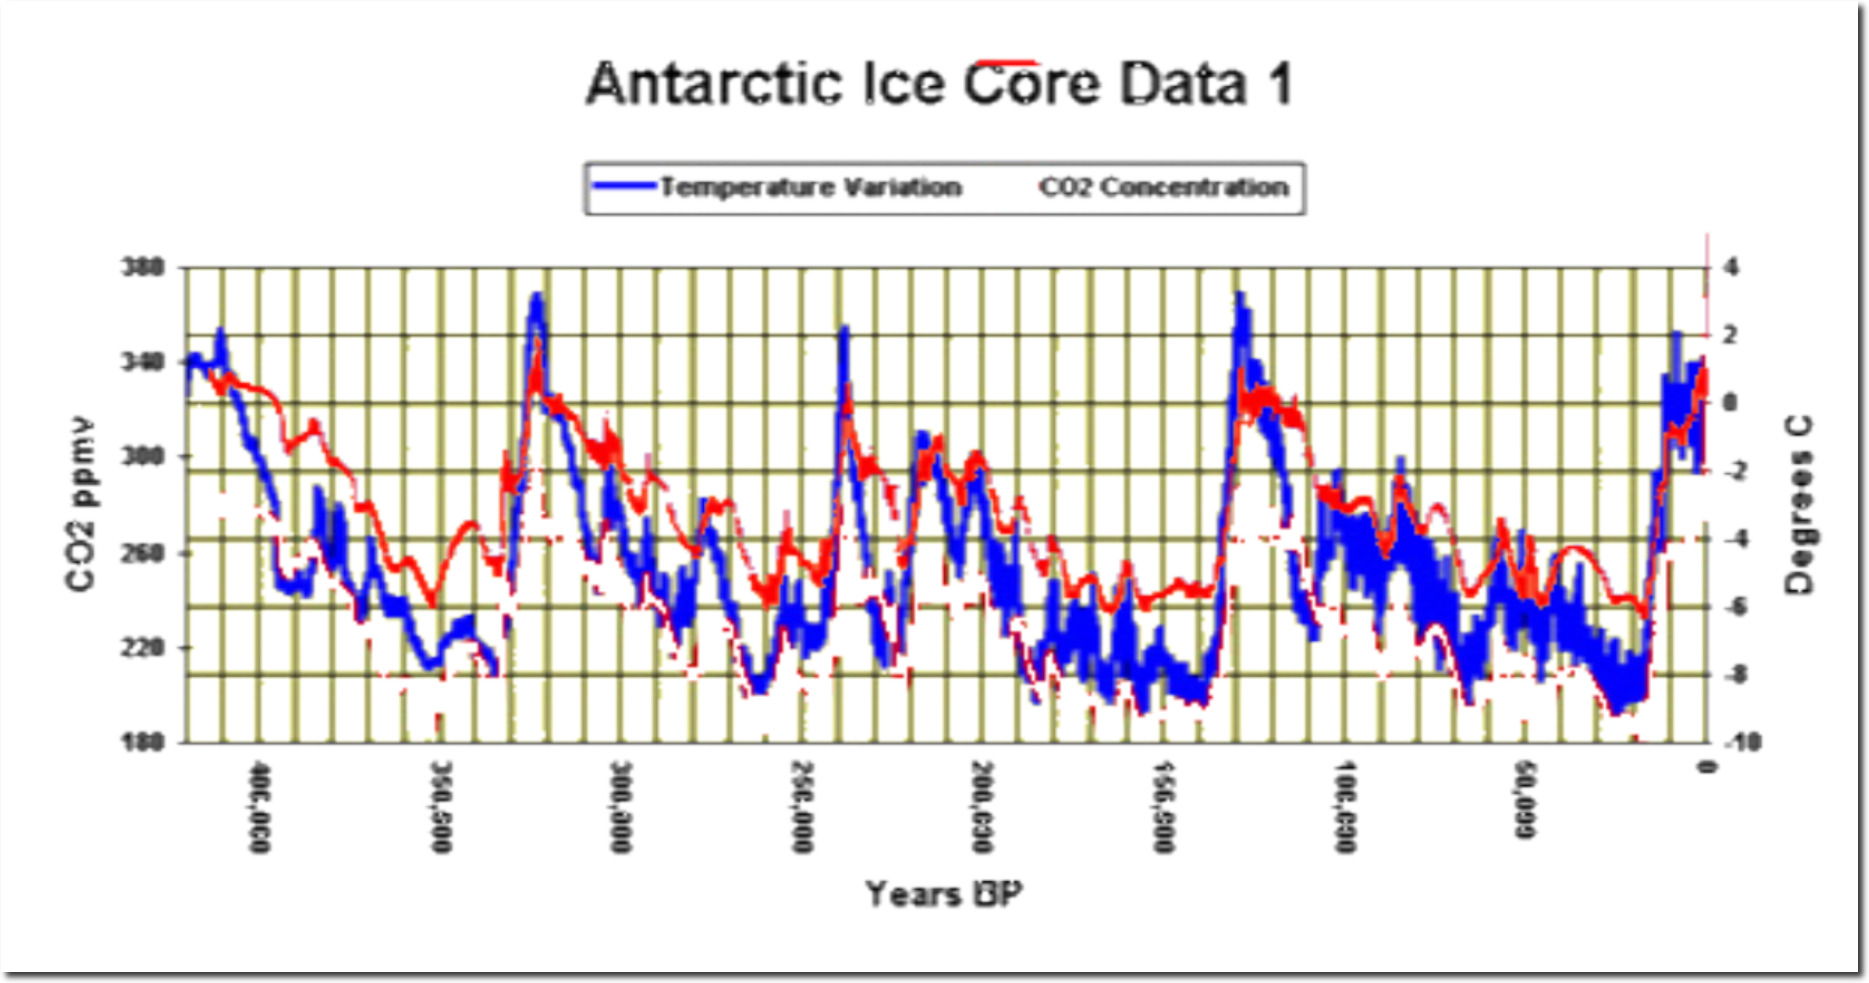
People love to debate whether CO2 leads or lags temperature, based on ice core graphs. The whole discussion is a farce. You can make CO2 appear to lead or lag by how you position the two graphs on the Y-axis.
CO2 appears to lag.
CO2 lags temperature rises in ice core data
Same graph with the Y-axis shifted. Now CO2 appears to lead.
CO2 changes as a response to ocean temperature. Warmer water (and beer) can hold less CO2, so it outgases CO2 to the atmosphere. Cold water holds more CO2, and removes it from the atmosphere. This is one of the first things geology students learn.


CO2 is lagging in both graphs. If the x axis is time, it makes no difference how you set the y axis.