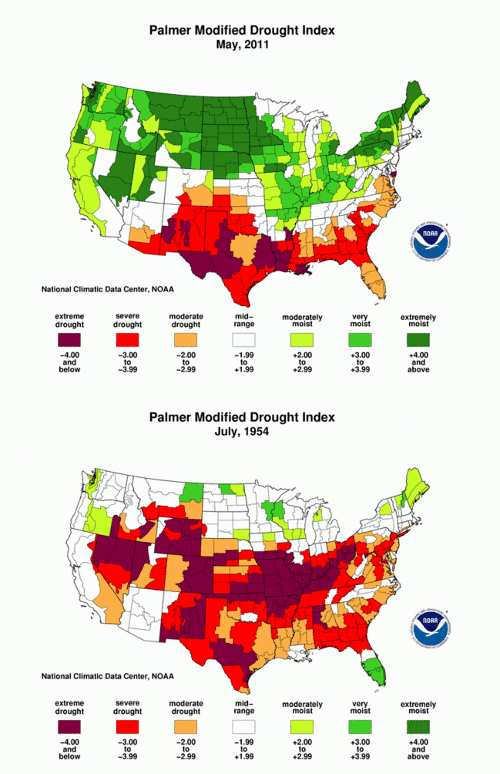
Romm says that the 2011 drought is the worst ever.
Disrupting the Borg is expensive and time consuming!
Google Search
-
Recent Posts
- Gaslighting 1924
- “Why Do You Resist?”
- Climate Attribution Model
- Fact Checking NASA
- Fact Checking Grok
- Fact Checking The New York Times
- New Visitech Features
- Ice-Free Arctic By 2014
- Debt-Free US Treasury Forecast
- Analyzing Big City Crime (Part 2)
- Analyzing Big City Crime
- UK Migration Caused By Global Warming
- Climate Attribution In Greece
- “Brown: ’50 days to save world'”
- The Catastrophic Influence of Bovine Methane Emissions on Extraterrestrial Climate Patterns
- Posting On X
- Seventeen Years Of Fun
- The Importance Of Good Tools
- Temperature Shifts At Blue Hill, MA
- CO2²
- Time Of Observation Bias
- Climate Scamming For Profit
- Climate Scamming For Profit
- Back To The Future
- “records going back to 1961”
Recent Comments
- Bob G on Gaslighting 1924
- Bob G on Gaslighting 1924
- conrad ziefle on Gaslighting 1924
- Bob G on Gaslighting 1924
- Bob G on Gaslighting 1924
- arn on Gaslighting 1924
- conrad ziefle on Gaslighting 1924
- Gordon Vigurs on Gaslighting 1924
- conrad ziefle on Gaslighting 1924
- Robertvd on Gaslighting 1924


History repeats itself, but never exactly the same way.
1954 might have had the worst US heat wave outside the 1930’s. St. Louis reached 115 and places in Illinois got as high as 117. The Dust Bowl made a definite comeback in the 1950’s
The CAGW believers would be beside themselves if something like that happened today.
-Scott
Sacramento total rainfall year (ending on July 1 2011)….. 24.65″
versus average 17.87″ equals 6.78″ above average.
Palmer’s scale is obviously screwing the pooch in regard to California.
You can tell by looking at Nevada. The high desert is dry because it sits in the rain shadow of the Sierra Nevada range. On the Palmer map it shows California as dryer than Nevada, which is not possible.
I read up on how the PDI was obtained and was not at all impressed. But then I am not impressed with quite a lot coming out of NOAA.