Disrupting the Borg is expensive and time consuming!
Google Search
-
Recent Posts
- Gaslighting 1924
- “Why Do You Resist?”
- Climate Attribution Model
- Fact Checking NASA
- Fact Checking Grok
- Fact Checking The New York Times
- New Visitech Features
- Ice-Free Arctic By 2014
- Debt-Free US Treasury Forecast
- Analyzing Big City Crime (Part 2)
- Analyzing Big City Crime
- UK Migration Caused By Global Warming
- Climate Attribution In Greece
- “Brown: ’50 days to save world'”
- The Catastrophic Influence of Bovine Methane Emissions on Extraterrestrial Climate Patterns
- Posting On X
- Seventeen Years Of Fun
- The Importance Of Good Tools
- Temperature Shifts At Blue Hill, MA
- CO2²
- Time Of Observation Bias
- Climate Scamming For Profit
- Climate Scamming For Profit
- Back To The Future
- “records going back to 1961”
Recent Comments
- Bob G on Gaslighting 1924
- Bob G on Gaslighting 1924
- conrad ziefle on Gaslighting 1924
- Bob G on Gaslighting 1924
- Bob G on Gaslighting 1924
- arn on Gaslighting 1924
- conrad ziefle on Gaslighting 1924
- Gordon Vigurs on Gaslighting 1924
- conrad ziefle on Gaslighting 1924
- Robertvd on Gaslighting 1924
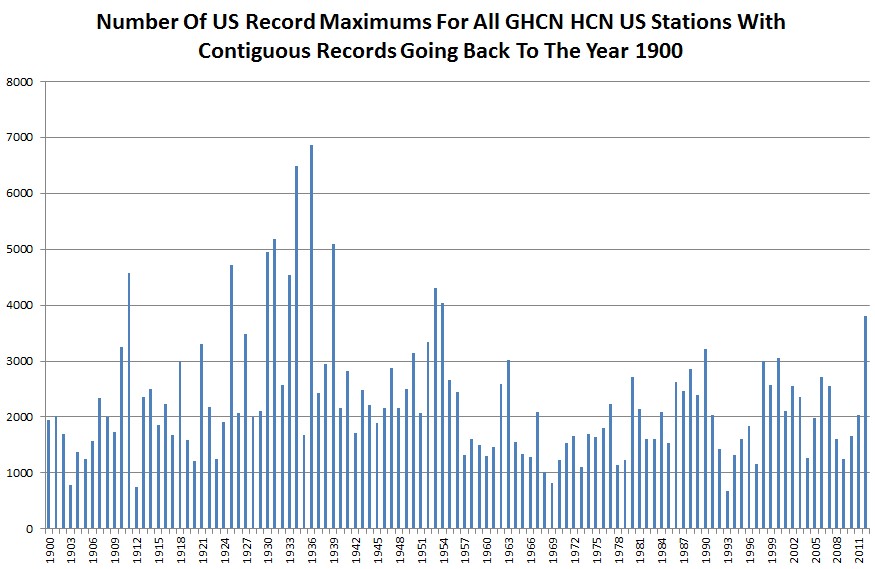
The Four Most Extreme Years Occurred During The 1930s
This entry was posted in Uncategorized. Bookmark the permalink.


More people see the light.
GHCN’s Dodgy Adjustments In Iceland
The second, yellow plot, however, is the adjusted GHCN record, which is the one actually used for global temperature calculation by both GHCN and also GISS. The bottom graph shows the value of the adjustment, with blue indicating adjusting down up to 1964 and red being upwards adjustment since. The scale is a bit unclear, but the overall effect of the adjustment is to add a warming adjustment of 0.74C.
You might ask “where did the Sea Ice Years go?”, and you would be right. GHCN have pretty much adjusted these out of existence. The GHCN algorithm has obviously mistaken the sharp fall in temperatures in 1965 as some sort of aberration caused by a change of location or equipment, and therefore wiped it from the record. However it has not made the same assumption about subsequent and equally sharp rises. The result is that temperatures since 1990 appear to be consistently higher than the 1930’s and 40’s, which, according to the IMO, simply is not the case.
http://wattsupwiththat.com/2012/10/15/ghcns-dodgy-adjustments-in-iceland/
I was going to say the same thing, Iceland did too and that didnt stop them from taking out the chainsaw and slicing the data beyond recognition.