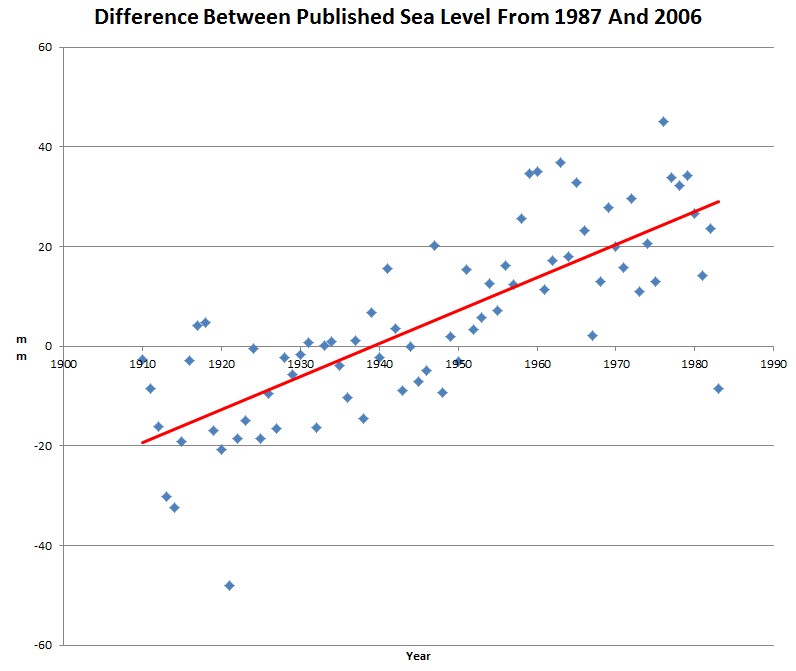
The Met Office conveniently provides data sets showing how sea level data has been tampered with over time. The graph below plots the difference between sea level plots generated in 1987 and 2006.
Like with everything else the hockey team gets their hands on, they lower the past and raise the present.


I will pose this question once again. With all of the evidence now available to show demonstrably that these folks are fraudulently altering data, can we not begin the necessary court proceedings? I am really growing weary of the wait. I want to see the proper justice in these cases! The is fraud, no matter how you slice it, and there are several folks the need to be sitting in a prison cell.
These are only “Estimates” derived by modeling the information available from whatever they are using to measure sea level and the BEST Scientific ASSuptions of “What-if”!
It does not even qualify as WAG!
It does qualify as FRAUD!
If they had reported it as WAG or even “Best Guess” it would have been acceptable. However, them wanting to scare people into believing the SHIT they are spouting a valid is Fraud in its greatest form!
If the seas have indeed risen as they claim, then where is the physical evidence on land ? The water must go somewhere, no?
It is hiding in the pipeline!
It’s hiding in the deep ocean just waiting to rise up and spread over the landscape!
Jail time is correct.
Jail time only makes them Martyrs!
That’s fine with me. They can be martyrs for 25 to life for all I care.
I don’t think this represents “adjustments” to the same dataset, like we’ve see with U.S. surface temperature data. Rather, the two datasets represent different sets of tide gauges, processed in different ways.
The rates of sea-level rise (SLR) at different locations vary considerably. At the best GLOSS-LTT tide gauges, the rate of SLR varies by about 15 mm/year. In fact, at about 1/4 of the best long-term GLOSS-LTT tide gauges, sea-level is falling (because the land is rising, mostly due to glacial isostatic rebound). So if you use sea-level measurements from different locations, you’ll generally calculate different rates of sea-level change.
As you devastatingly pointed out, Steve, the IPCC used this in AR4 to create the illusion of an acceleration in rate of SLR, by conflating tide-gauge-measured coastal sea-level numbers before 1993 with satellite-measured mid-ocean sea-level numbers after 1993.
Since these two datasets are based on different sets of tide gauges, it’s unsurprising that they show different rates of seal-level rise. So if you take the differences you’ll see a trend equal to the difference between the two rates, which is what you graphed.
Additionally, Church & White adjusted their data using Peltier’s GIA estimates (which increase the rate of SLR), and they reported that:
Gornitz and Lebedeff presumably didn’t do those things, either.
For an in-depth examination of Church & White 2006, see Tom Moriarty’s article.
Dave
http://www.sealevel.info
“I am really growing weary of the wait. I want to see the proper justice in these cases!”
We have seen how the judges have ruled on this “science” before, they suddenly become incapable of basic logic, and seem to think science is beyond their realm, and punt.
Maybe we need Judge Judy. 😉
BTW, here’s the abstract for Gornitz & Lebedeff.