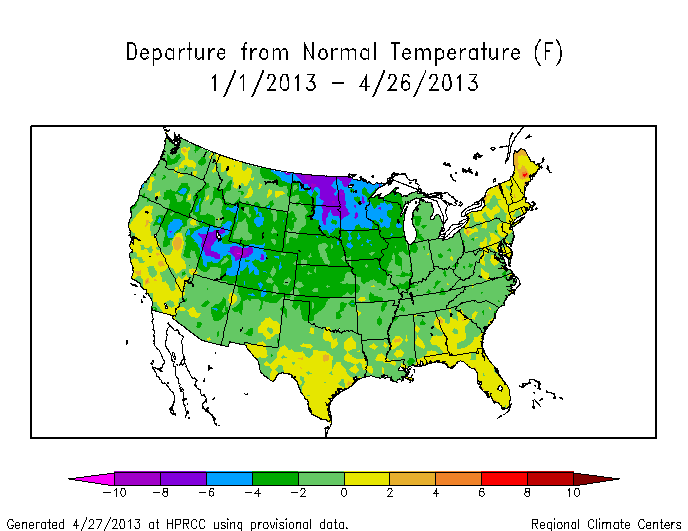
Thirty three percent of the US is more than two degrees below normal. Nine percent is more than four degrees below normal. Three percent is more than six degrees below normal.
Disrupting the Borg is expensive and time consuming!
Google Search
-
Recent Posts
- Gaslighting 1924
- “Why Do You Resist?”
- Climate Attribution Model
- Fact Checking NASA
- Fact Checking Grok
- Fact Checking The New York Times
- New Visitech Features
- Ice-Free Arctic By 2014
- Debt-Free US Treasury Forecast
- Analyzing Big City Crime (Part 2)
- Analyzing Big City Crime
- UK Migration Caused By Global Warming
- Climate Attribution In Greece
- “Brown: ’50 days to save world'”
- The Catastrophic Influence of Bovine Methane Emissions on Extraterrestrial Climate Patterns
- Posting On X
- Seventeen Years Of Fun
- The Importance Of Good Tools
- Temperature Shifts At Blue Hill, MA
- CO2²
- Time Of Observation Bias
- Climate Scamming For Profit
- Climate Scamming For Profit
- Back To The Future
- “records going back to 1961”
Recent Comments
- Bob G on Gaslighting 1924
- Bob G on Gaslighting 1924
- conrad ziefle on Gaslighting 1924
- Bob G on Gaslighting 1924
- Bob G on Gaslighting 1924
- arn on Gaslighting 1924
- conrad ziefle on Gaslighting 1924
- Gordon Vigurs on Gaslighting 1924
- conrad ziefle on Gaslighting 1924
- Robertvd on Gaslighting 1924


And the US Extremes Index says Jan-March is one of the “most unextreme” on record!
http://www.ncdc.noaa.gov/extremes/cei/graph/1c/ytd
Well, yeah. I guess they’re still stuck in the global warming orientation. If things have cooled, they haven’t warmed. And if they haven’t warmed higher than average for that time span, the temperature change isn’t extreme. “most unextreme” is a way of saying “way, WAY lower than what we expected or what is useful for our polemics.”
By summer all this will be adjusted to the hottest on record by the ministry of truth.
Yeah. Or they will just ignore the 79% and claim the other 21% of temps were unprecedented. 🙂
As Orwell put it:
• “Day by day and almost minute by minute the past was brought up to date. In this way every prediction made by the Party could be shown by documentary evidence to have been correct; nor was any item of news, or any expression of opinion, which conflicted with the needs of the moment, ever allowed to remain on record. All history was a palimpsest, scraped clean and reinscribed exactly as often as was necessary.” George Orwell
And we’re also nearing the height of the Solar Max. I guess the glaciers will start moving this winter!
Tweet, tweet.
It looks like the ‘climate’ is changing after all. 😉
Steve, As you repeatedly point out, the “adjustments” in the historical data end up corrupting it rather than correcting it. The current graphs, stories, of extremes, records, current deviations from averages, etc. all become moot because of the “adjustments”. That is a true travesty!
Revising history leads to other “issues” like documented historical events like the Dust Bowl. You’ve done posts on it, but I don’t recall you using the ‘Climate at a Glance’ graphs found here:http://www.ncdc.noaa.gov/cag/
Check out the “annual” temperature & precipitation for Oklahoma. You’d never know there was a Dust Bowl from that “adjusted” data. It would be interesting to see the same charts with raw, unadjusted data. Perhaps you’ve done it & I missed it when I searched.
In 2084 … The Dust Bowl? Nah, never happened, just like the global cooling of the 1940-1970s never happened. All those pictures of the Dust Bowl? Nah, photoshopped.
Re: Dustbowl. Nothing to see here, people. Let’s keep moving….
It’s clearly worse than we thought.