
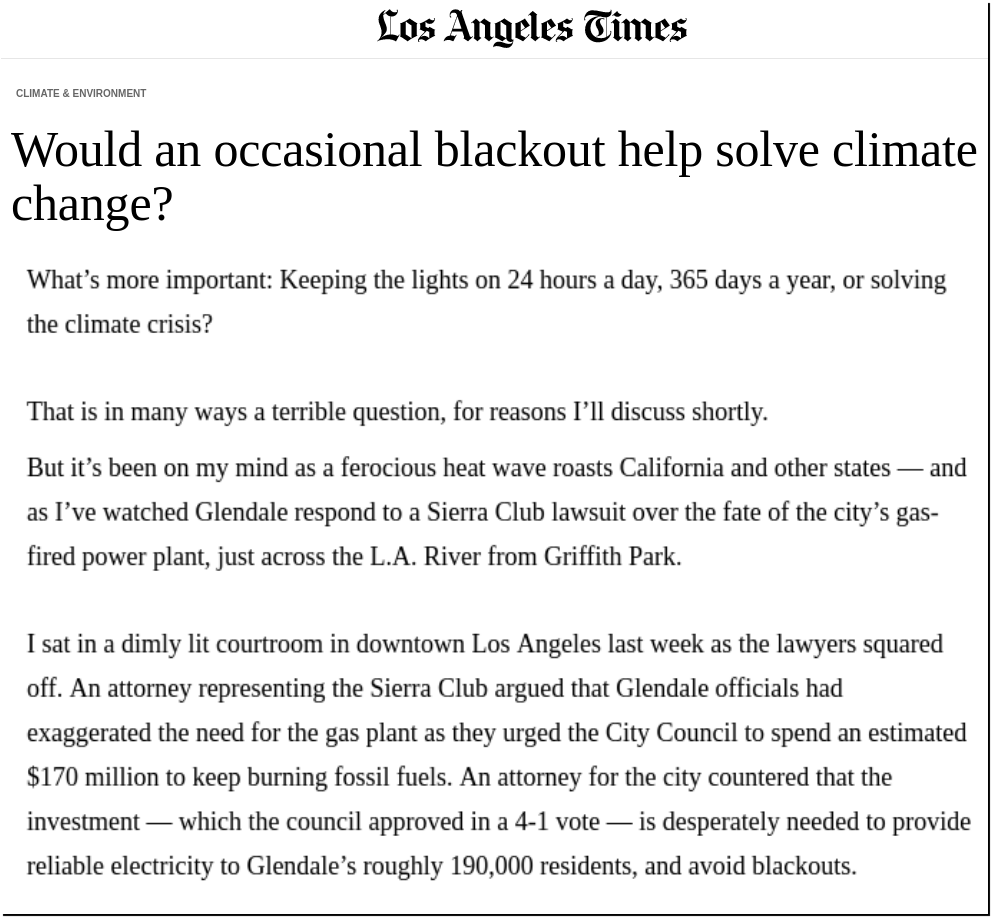
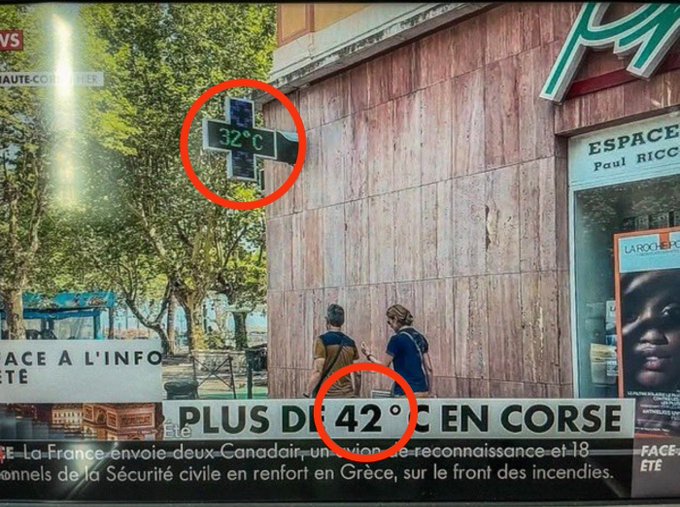
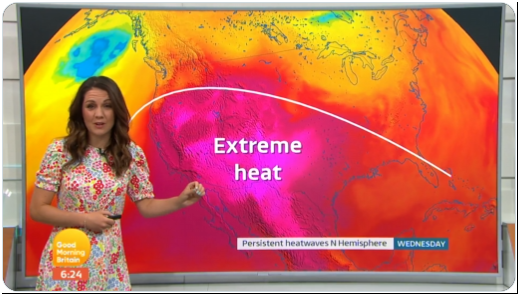
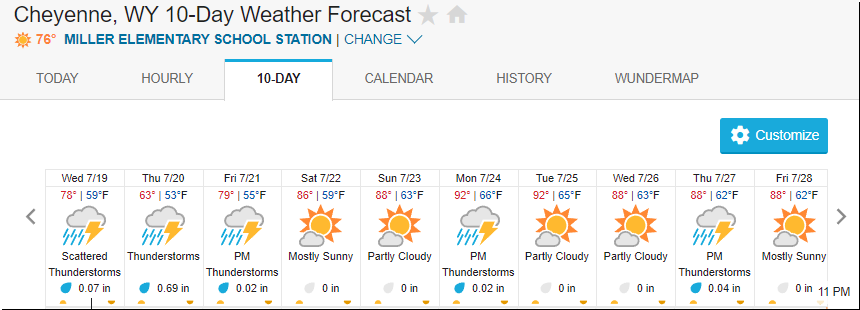
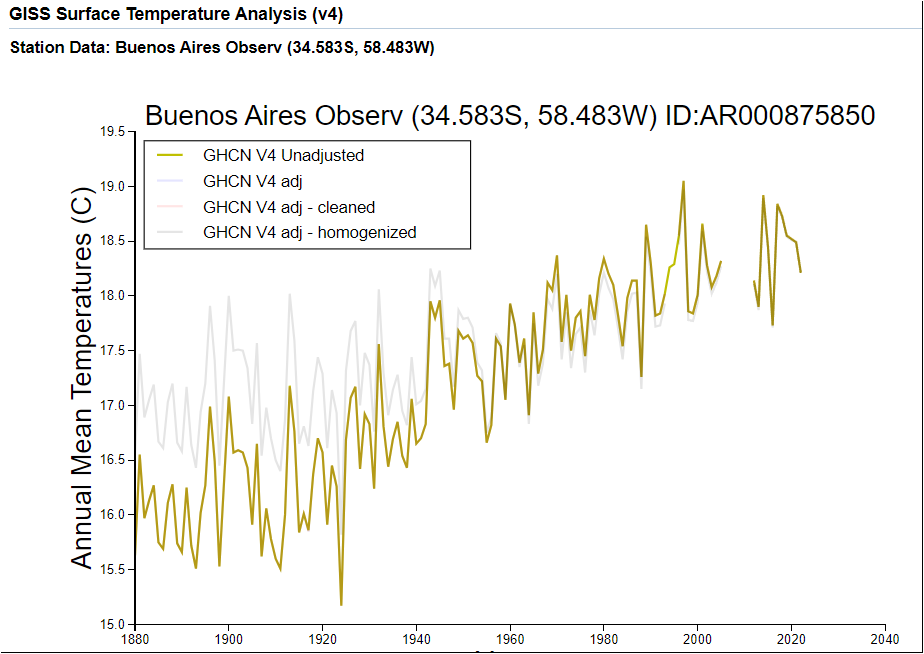
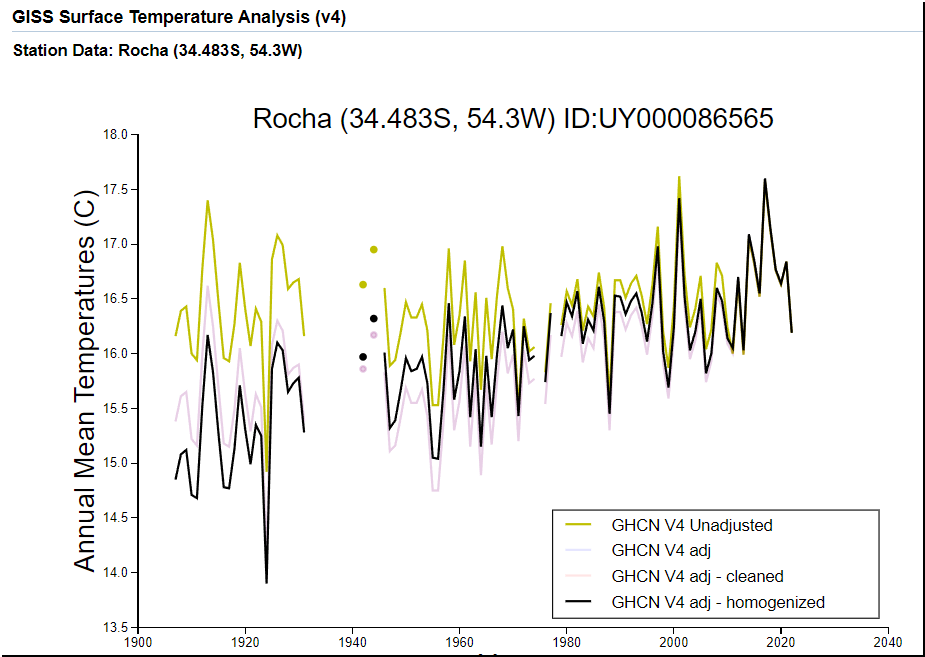
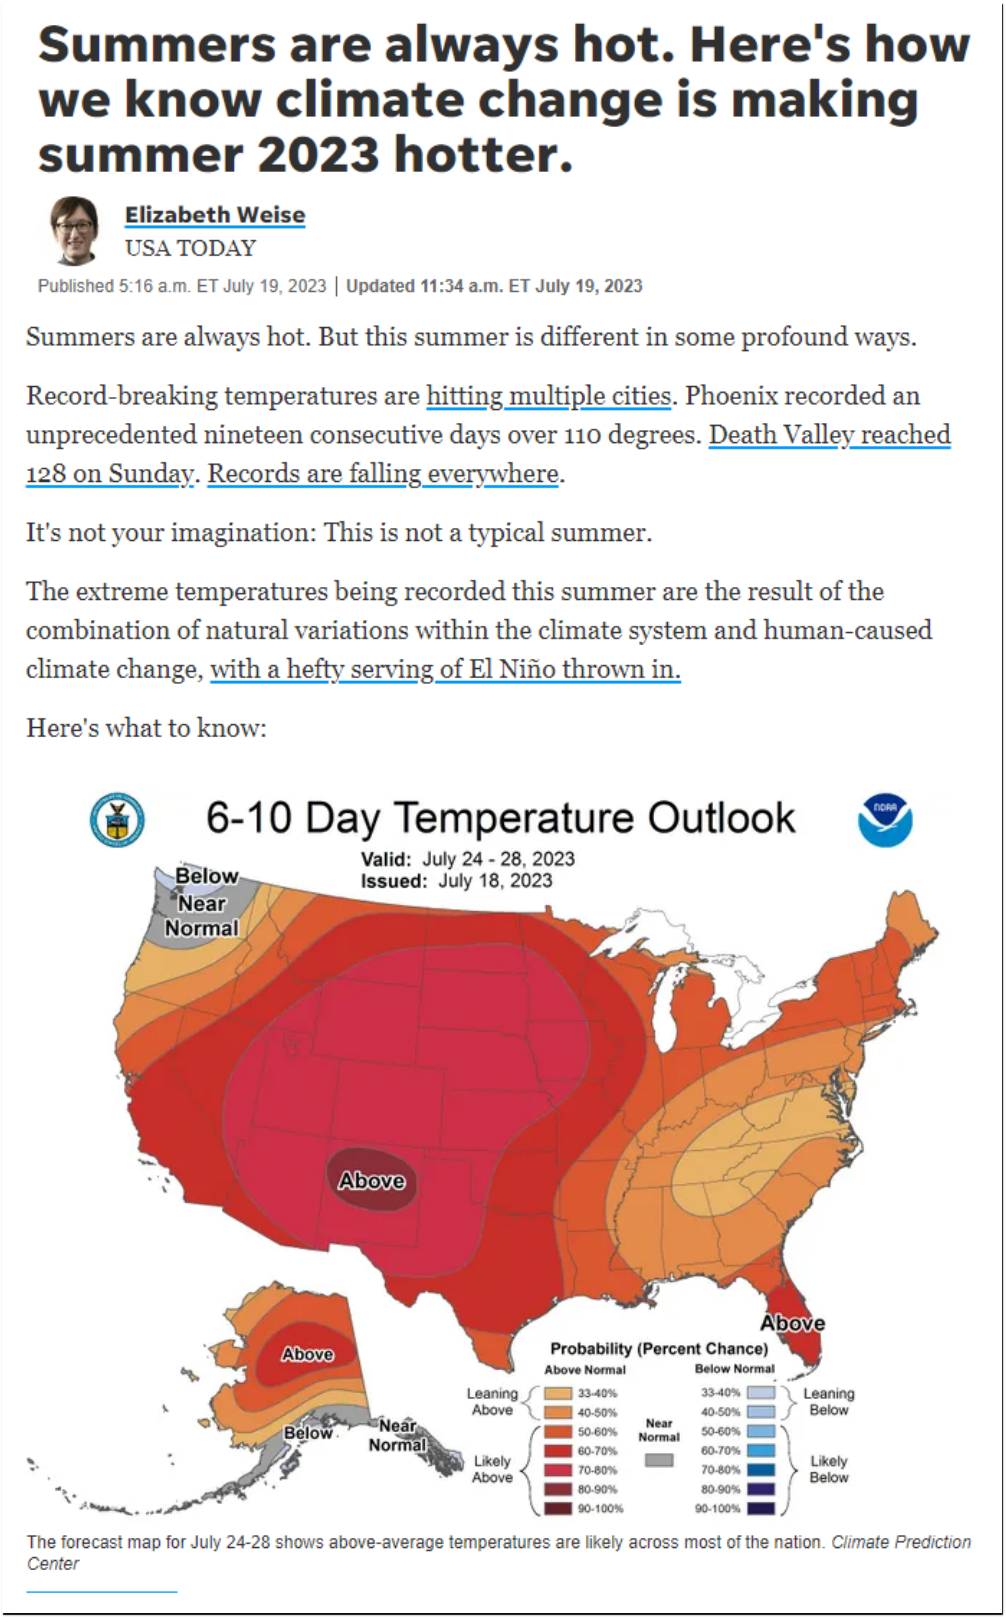
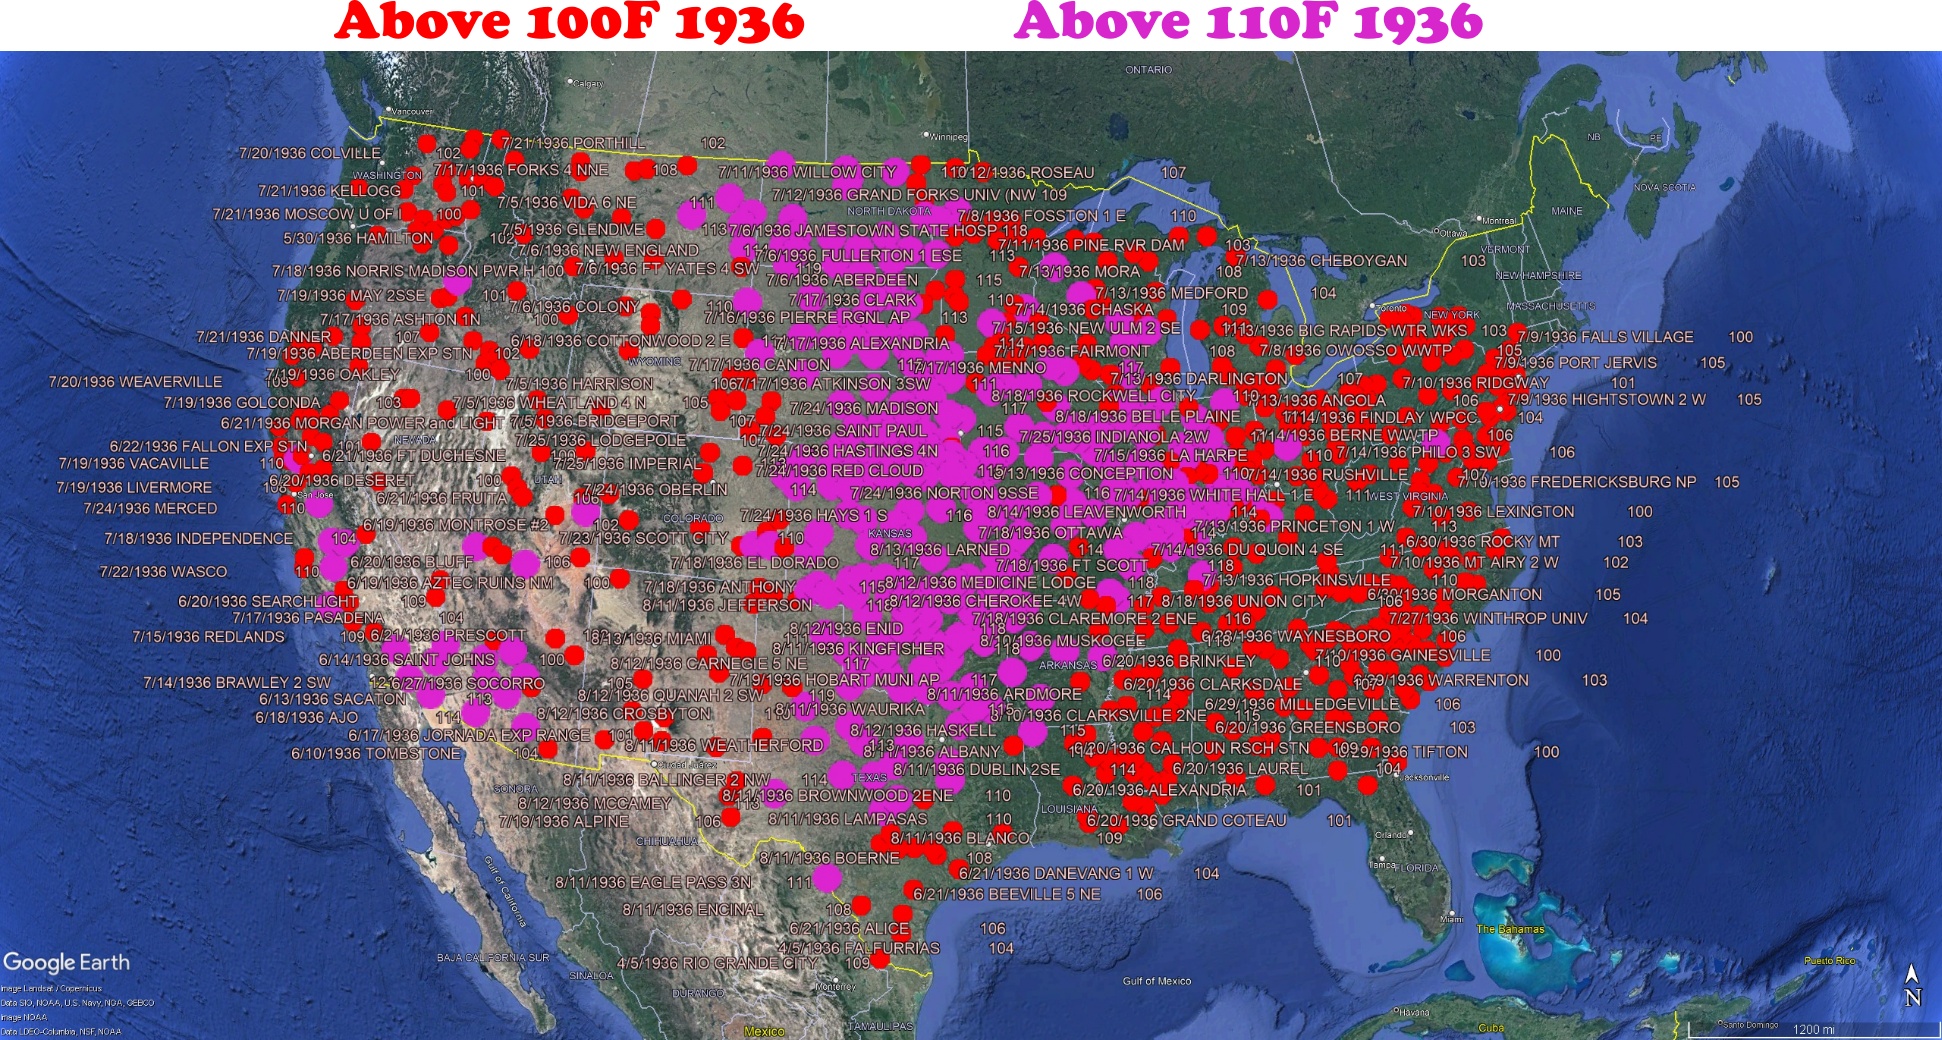
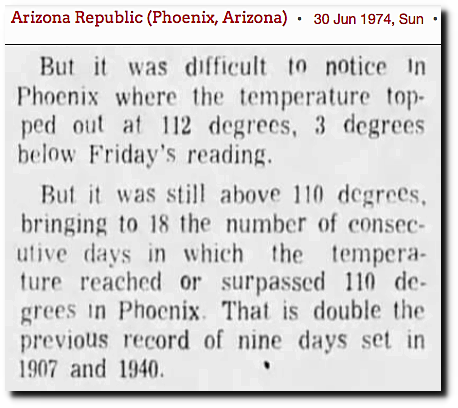
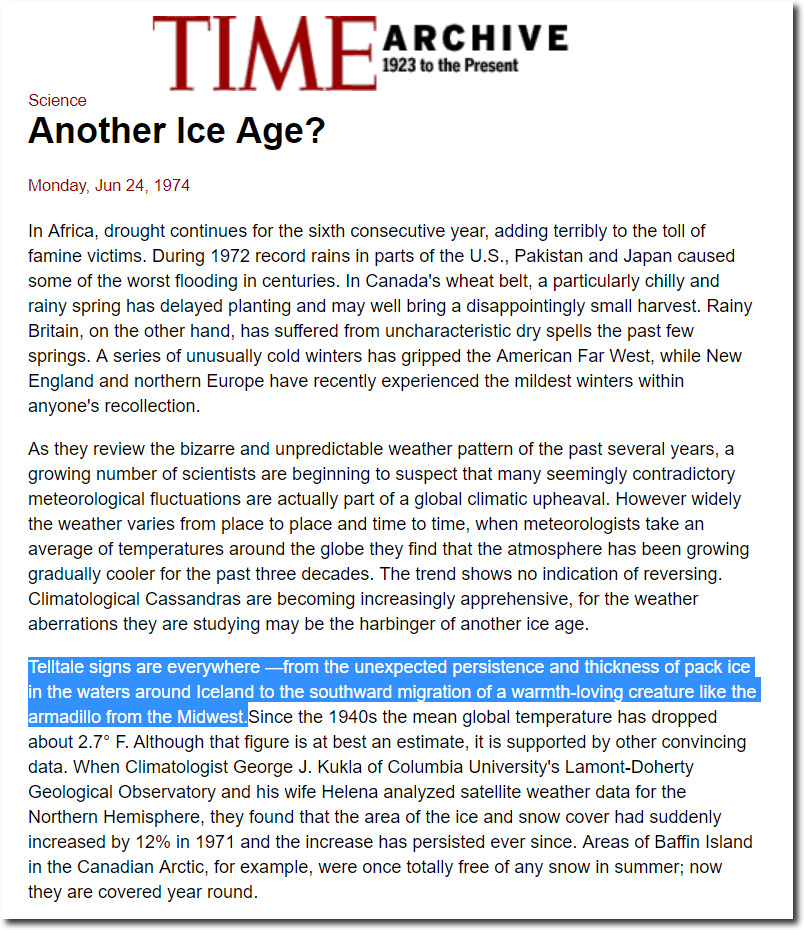
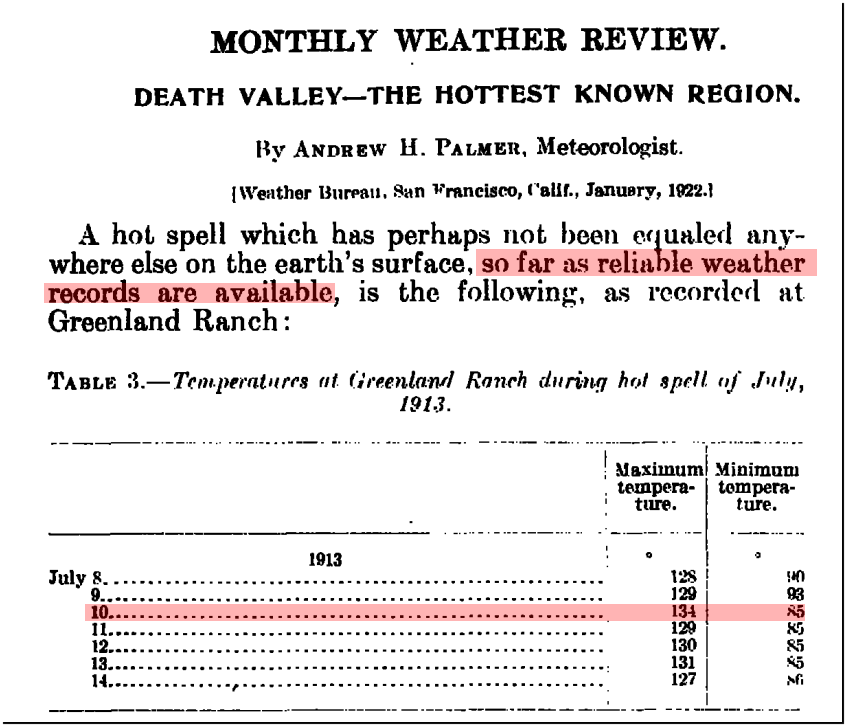
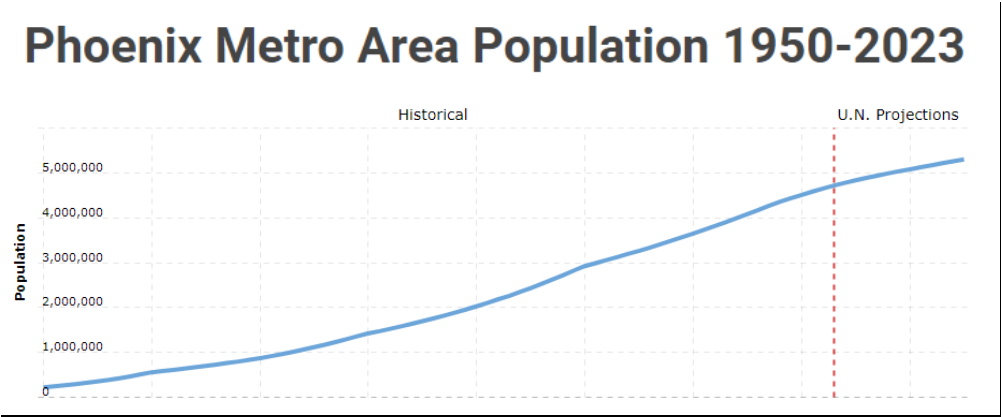
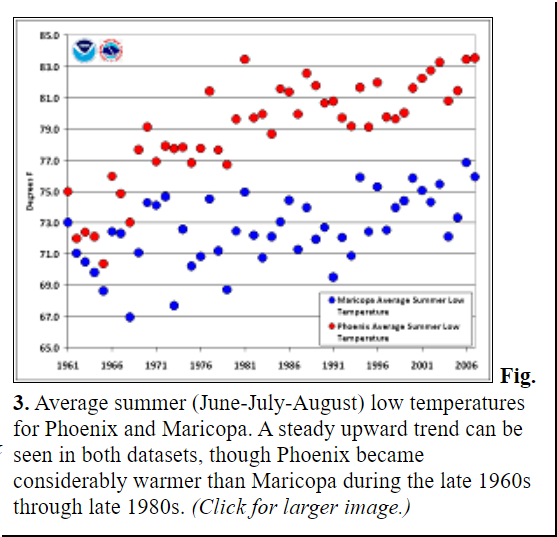
Summer brings hot weather to many locations. In this video I discuss how the press uses meaningless statistics and bright red maps to try to scare the audience into giving up their reliable supply of energy.


Disrupting the Borg is expensive and time consuming!

Google Search
-
Recent Posts
- El Nino To The Rescue?
- Worst March Drought On Record
- ChartGL Process Control Demo
- The Biggest Money Laundering Scam
- Drought In The Headwaters Of Lake Powell
- Unrealistic Expectations Of Water Availability
- Did Bill Gates Do This?
- Worst March Drought On Record In The US
- The Real Hockey Stick Graph
- Analyzing The Western Water Crisis
- Gaslighting 1924
- “Why Do You Resist?”
- Climate Attribution Model
- Fact Checking NASA
- Fact Checking Grok
- Fact Checking The New York Times
- New Visitech Features
- Ice-Free Arctic By 2014
- Debt-Free US Treasury Forecast
- Analyzing Big City Crime (Part 2)
- Analyzing Big City Crime
- UK Migration Caused By Global Warming
- Climate Attribution In Greece
- “Brown: ’50 days to save world'”
- The Catastrophic Influence of Bovine Methane Emissions on Extraterrestrial Climate Patterns
Recent Comments
- Bob G on Worst March Drought On Record
- Francis Barnett on Worst March Drought On Record
- Bob G on Worst March Drought On Record
- Bob G on Worst March Drought On Record
- dearieme on Worst March Drought On Record
- Bob G on Worst March Drought On Record
- Hank Phillips on Unrealistic Expectations Of Water Availability
- Hank Phillips on The Biggest Money Laundering Scam
- Hank Phillips on The Biggest Money Laundering Scam
- Hank Phillips on The Biggest Money Laundering Scam