Australia Is Not Warming

Contrary to the BS from BOM, Australia is not warming, and their hottest recent year was 1998

I picked ten random locations around Australia, and averaged the RSS TLT monthly anomalies for those locations. There has been no net warming for 35 years, and the last two years were not their hottest.

ScreenHunter_5812 Jan. 05 18.33

Click on the map below to see the latitude/longitude of the ten locations.

ScreenHunter_5810 Jan. 05 18.26

Posted in Uncategorized | 22 Comments

Diet Plan Update

ScreenHunter_5807 Jan. 05 13.08 ScreenHunter_5806 Jan. 05 13.05

Posted in Uncategorized | 34 Comments

NCDC Breaks Their Own Record For Data Tampering In 2014

The National Climatic Data Center has broken last year’s record for misleading the public about US temperatures. The thermometer data they use shows no warming over the past 90 years, and that 2013/2014 were two of the coldest years on record in the US. But after data tampering, they report a sharp US warming trend. The animation below flashes between the average measured and final temperature at all stations.

USHCNTampering2014

The total amount of tampering reached record levels in 2014, at almost 1.8 degrees F. They create the appearance of warming by cooling all years prior to 2003, and warming all years since that date.

ScreenHunter_5802 Jan. 05 11.57 

Another spectacular milestone is that the now fabricate 30% of their monthly data. Almost one third of their reported monthly station data has no actual thermometer data from that station. This allows them to contaminate missing rural data, with UHI affected thermometers tens or hundreds of miles away.

ScreenHunter_5803 Jan. 05 12.00

The physical basis of their tampering appears to be the amount of CO2 in the atmosphere. The correlation between tampering and atmospheric CO2 is almost perfect.

ScreenHunter_5808 Jan. 05 13.14

It appears that they have a tampering algorithm designed to force reported temperatures to match hopelessly broken global warming theory. NCDC says that the algorithm is “working as designed.”

Posted in Uncategorized | 31 Comments

Least Hot Two Year Period On Record In The US

The average US daily maximum temperature during 2013/2014, was the lowest of any two year period on record. The peak occurred 80 years ago.

ScreenHunter_5796 Jan. 05 11.31

Posted in Uncategorized | 3 Comments

Obama 2012 : Drilling Won’t Lower Gas Prices

February 23, 2012

Anybody who tells you we can drill our way out of this problem doesn’t know what they’re talking about, or just isn’t telling you the truth,” he said to whoops from the crowd of nearly 1,500.

Mr. Obama’s remarks, tinged with humor and sarcasm, were bluntly political, on a trip that included fund-raising events in Miami and Orlando. But his message was sober: neither he nor anyone else can do much about oil prices, which he said were likely to keep rising.

In Nod to Rising Gas Prices, Obama Discusses Energy Policy – NYTimes.com

ScreenHunter_5793 Jan. 05 11.23

Posted in Uncategorized | 21 Comments

Midwest Winter Temperatures Were 15F Colder In 2014 Than In 1932

ScreenHunter_5784 Jan. 04 20.28

Last winter in the Midwest was second coldest on record, just a hair behind 1979. Temperatures averaged a mind boggling 15F colder last winter than they did in 1932 – which was the only midwest winter that averaged above freezing.

Government climate scientists will of course lie about this and alter their own data for as a long as they can get away with it. Their jobs depend on a continuous flow of misinformation.

Posted in Uncategorized | 22 Comments

2014 Was The Least Hot Year On Record In The US

Last year recorded the smallest percent of stations to reach 90 degrees in US history. Only 84% of US HCN stations reached 90 degrees.  This was the first year when more than 15% of stations failed to reach 90 degrees any time during the year.

Compare to 1931, when less than 2% of US stations failed to reached 90 degrees. This metric is compiled from the same data set NCDC uses, and is not affected by time of observation issues.

ScreenHunter_5773 Jan. 04 17.33

The percent of daily readings above 90 degrees was also near a record low.


ScreenHunter_5772 Jan. 04 17.26

And it wasn’t just summer that was cool. Before NCDC data tampering, last winter was the 10th coldest on record, and coldest in 35 years.

ScreenHunter_5774 Jan. 04 17.37

NCDC says that 2014 was the hottest year ever.

Posted in Uncategorized | 26 Comments

Green Energy Is Dead

The combination of rising electricity prices and plummeting oil prices has finished off the fake green energy market. I saw gasoline for $1.79/gallon in Albuquerque yesterday.

It is cheaper to drive a gasoline powered vehicle than a useless electric vehicle.

[youtube=https://www.youtube.com/watch?v=HlTxGHn4sH4]

The complete list of faltering or bankrupt green-energy companies:

Evergreen Solar ($25 million)*
SpectraWatt ($500,000)*
Solyndra ($535 million)*
Beacon Power ($43 million)*
Nevada Geothermal ($98.5 million)
SunPower ($1.2 billion)
First Solar ($1.46 billion)
Babcock and Brown ($178 million)
EnerDel’s subsidiary Ener1 ($118.5 million)*
Amonix ($5.9 million)
Fisker Automotive ($529 million)
Abound Solar ($400 million)*
A123 Systems ($279 million)*
Willard and Kelsey Solar Group ($700,981)*
Johnson Controls ($299 million)
Schneider Electric ($86 million)
Brightsource ($1.6 billion)
ECOtality ($126.2 million)
Raser Technologies ($33 million)*
Energy Conversion Devices ($13.3 million)*
Mountain Plaza, Inc. ($2 million)*
Olsen’s Crop Service and Olsen’s Mills Acquisition Company ($10 million)*
Range Fuels ($80 million)*
Thompson River Power ($6.5 million)*
Stirling Energy Systems ($7 million)*
Azure Dynamics ($5.4 million)*
GreenVolts ($500,000)
Vestas ($50 million)
LG Chem’s subsidiary Compact Power ($151 million)
Nordic Windpower ($16 million)*
Navistar ($39 million)
Satcon ($3 million)*
Konarka Technologies Inc. ($20 million)*
Mascoma Corp. ($100 million)

List: 36 Of Obama’s Taxpayer-Funded Green Energy Failures – Fox Nation

Posted in Uncategorized | 399 Comments

NASA Rewriting The Past To Suit The Needs Of Their Climate Agenda

In 1981, NASA showed the 1930’s as the warmest decade globally.


ScreenHunter_5766 Jan. 04 10.43

http://pubs.giss.nasa.gov/docs/1981/1981_Hansen_etal_1.pdf

That didn’t suit the global warming narrative, so by 1999 they had almost erased the warm 1930’s

ScreenHunter_5764 Jan. 04 09.55 http://www.giss.nasa.gov/research/briefs/hansen_07/

However, the small bit of warming from 1940 to 2000 didn’t suit the needs of the Hockey Stick, so NASA has since completely erased the warm 1930’s

Fig.A (1)

http://data.giss.nasa.gov/gistemp/graphs_v3/Fig.A.gif

The animation below shows the changes NASA made to the global surface temperature record between 1981 and 1999, and then from 1981 to 2014.

NASASurfaceTemp1981-1999-2014

From: Tom Wigley <[email protected]>
To: Phil Jones <[email protected]>
Subject: 1940s
Date: Sun, 27 Sep 2009 23:25:38 -0600
Cc: Ben Santer <[email protected]>

It would be good to remove at least part of the 1940s blip, but we are still left with “why the blip”.

di2.nu/foia/1254108338.txt

Posted in Uncategorized | 4 Comments

Yet Another Clueless Climate Scientist

Where do they find these people at?

On Dec. 26, Rolf Westgard made a demonstrably false statement in the St. Cloud Times/SCTimes.com about climate change. He stated, “The earth is overall warm in 2014, perhaps equaling 1998 and the mid-1930s as among the warmest years of the 21st century.”

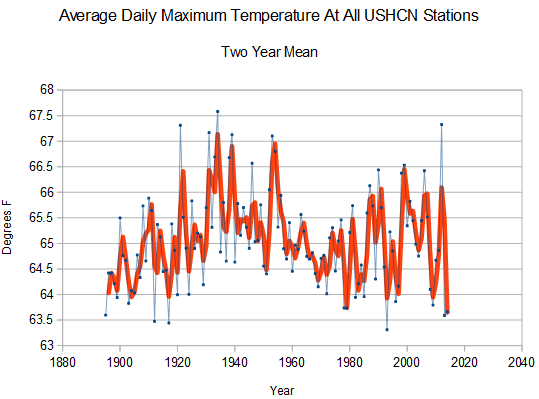
Aside from the fact that 1998 and the 1930s were in the 20th century, his comments about the 1930s are false. The 1930s were warm in the United States, but they were cool globally.

I am a climate scientist. I was in China at the time of the U.S.-China announcement. I work on global temperature studies. When people make these types of false statements in the press, it is my professional obligation to submit a correction.

Let’s debate solutions on climate change but let’s at least start with facts, not fantasy.

Dr. John Abraham is a climate scientist at the University of St. Thomas.

Letter: Start global warming debate with facts, truths

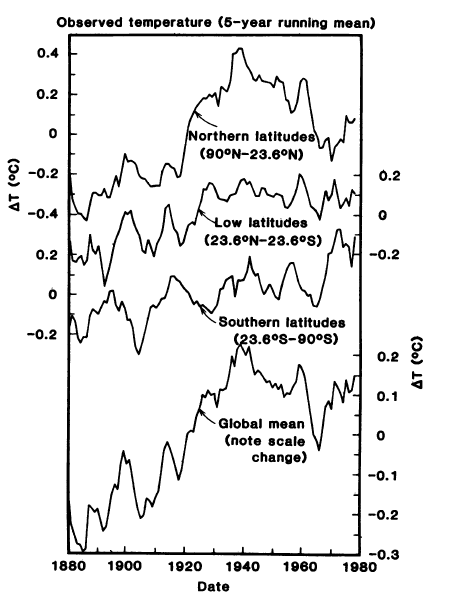
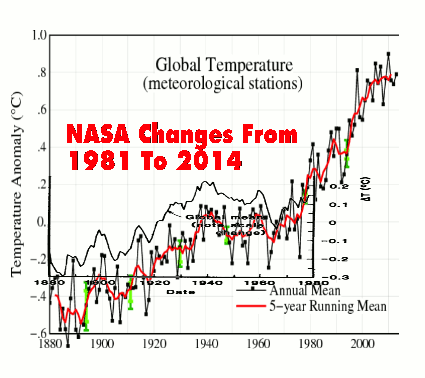
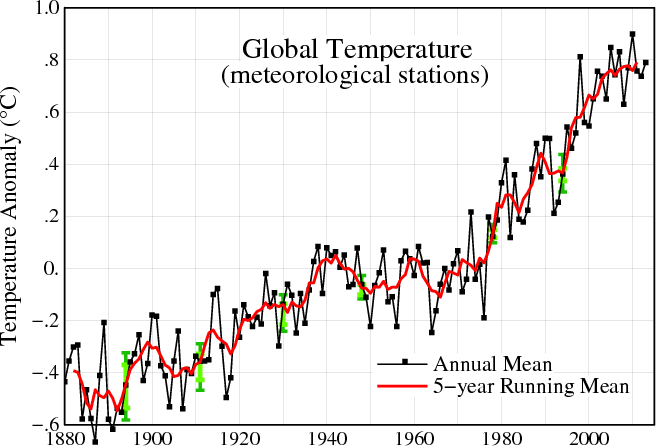
Yes, let’s start with some facts. Dr. John Abraham has no idea what he is talking about. In 1975, the National Academy of Sciences reported a large 1930’s warming spike across the Northern Hemisphere.

ScreenHunter_5753 Jan. 03 09.19

The National Center for Atmospheric Research reported the same thing

ScreenHunter_5761 Jan. 04 04.33

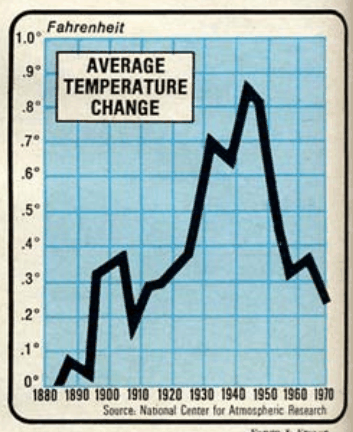
In 1981, NASA’s James Hansen reported the same thing

ScreenHunter_5763 Jan. 04 04.36

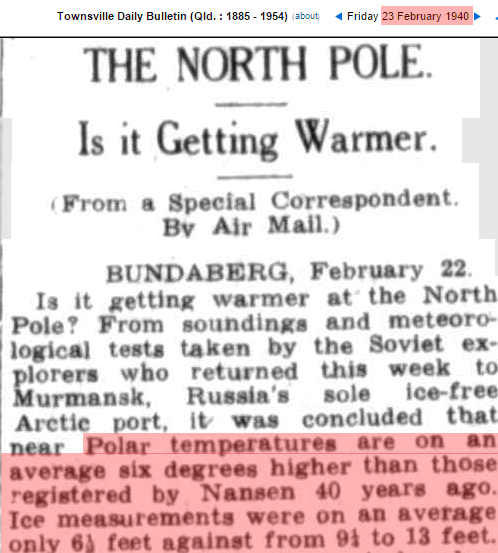
In 1940, six degrees of Arctic warming was reported.

screenhunter_5293-dec-18-06-30 (1)

By 1947, ten degrees of warming were reported in the Arctic, and both poles were melting.

ScreenHunter_5580 Dec. 26 11.54

By 1952, the glaciers of Norway and Alaska had lost half their mass.

ScreenHunter_5768 Jan. 04 11.34

Now let’s review the statements of “climate scientist” Dr. John Abraham

The 1930s were warm in the United States, but they were cool globally.

I am a climate scientist. I work on global temperature studies.

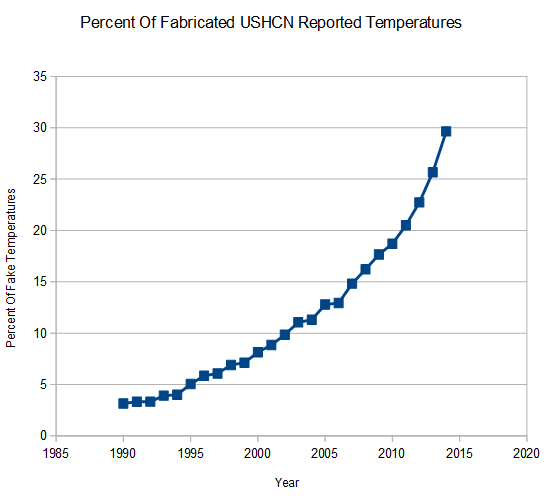
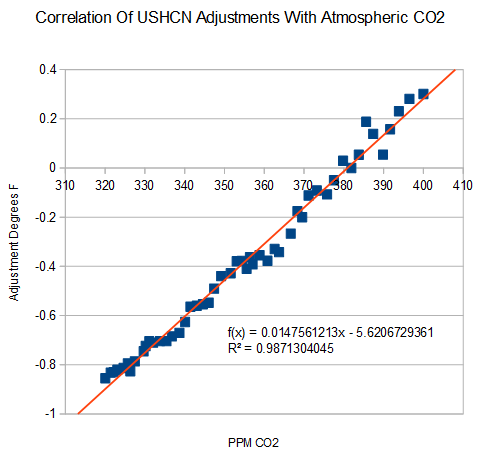
How is it that a PhD climate scientist who studies global temperature, doesn’t seem to know the most fundamental facts of global temperature? Does Abraham do any actual research? Even the climategate crooks knew about the warmth in the 1930’s and 1940’s.

From: Tom Wigley <[email protected]>
To: Phil Jones <[email protected]>
Subject: 1940s
Date: Sun, 27 Sep 2009 23:25:38 -0600
Cc: Ben Santer <[email protected]>

It would be good to remove at least part of the 1940s blip, but we are still left with “why the blip”.

di2.nu/foia/1254108338.txt

Posted in Uncategorized | 73 Comments