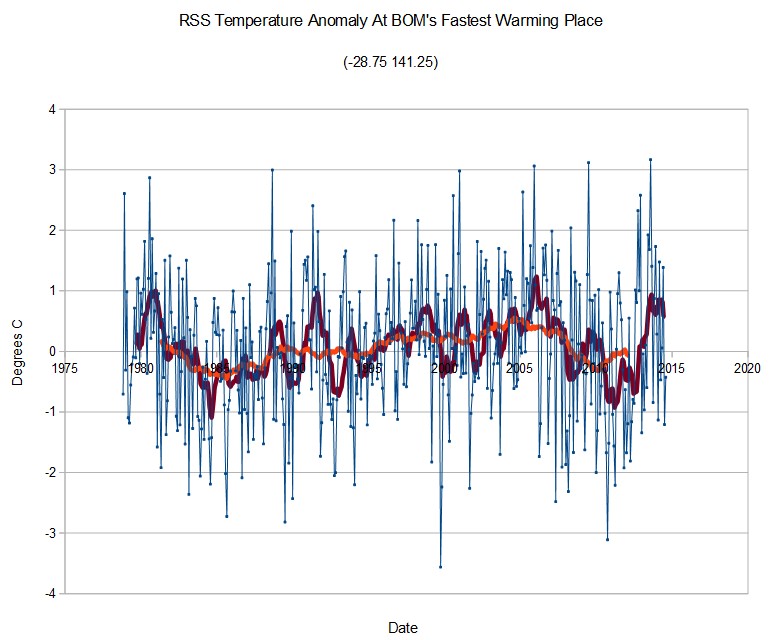
BOM shows the corner of NSW, Queensland and SA as the fastest warming place in Australia

RSS shows no net warming there, and that 1980 and 2006 were warmer there than 2013
BOM shows the corner of NSW, Queensland and SA as the fastest warming place in Australia
RSS shows no net warming there, and that 1980 and 2006 were warmer there than 2013
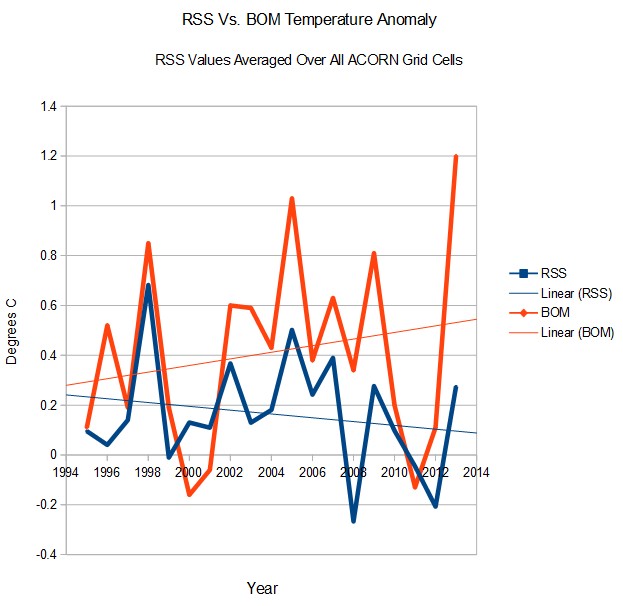
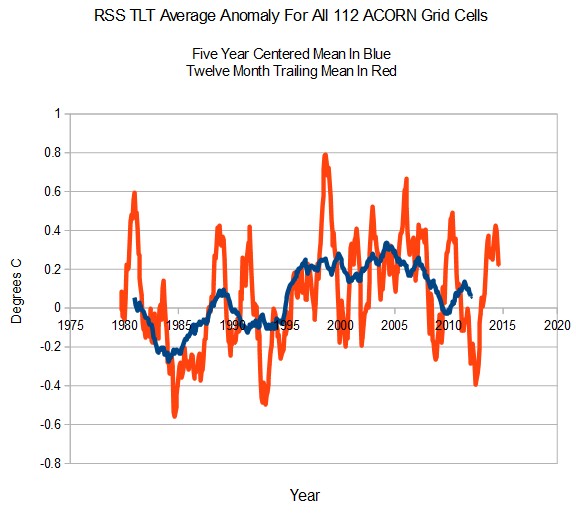
I tried an experiment today, and calculated the average RSS TLT anomaly for all 112 ACORN grid cells.
Last year was not even close to being the hottest year, and is diverging from BOM surface temperatures at a rate of 2.2°C per century over the last two decades.
Temperatures in Australia are about the same as they were at the start of the satellite record. Many years were warmer than 2013.
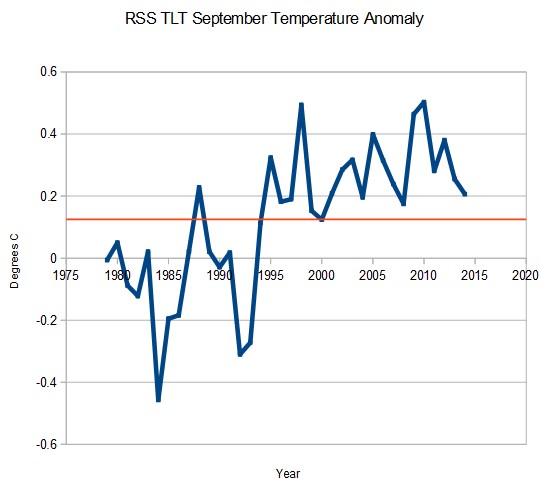
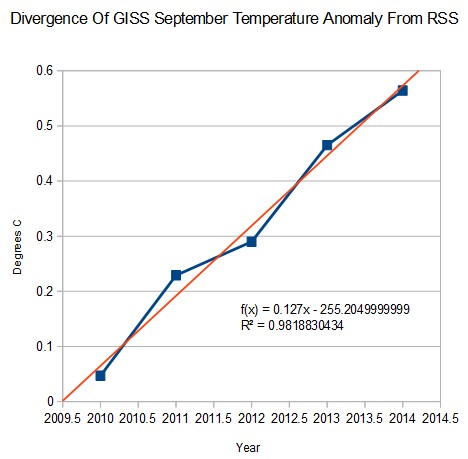
Gavin Schmidt says that September was the hottest on record.
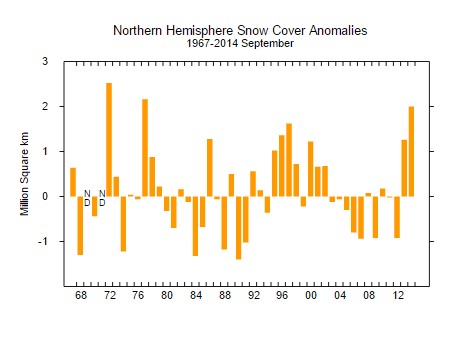
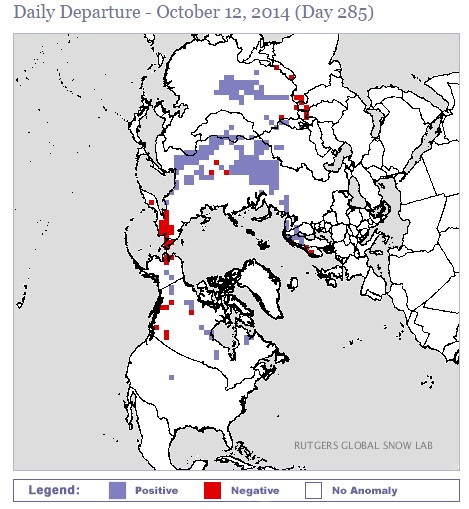
September had the third highest northern hemisphere snow cover on record.
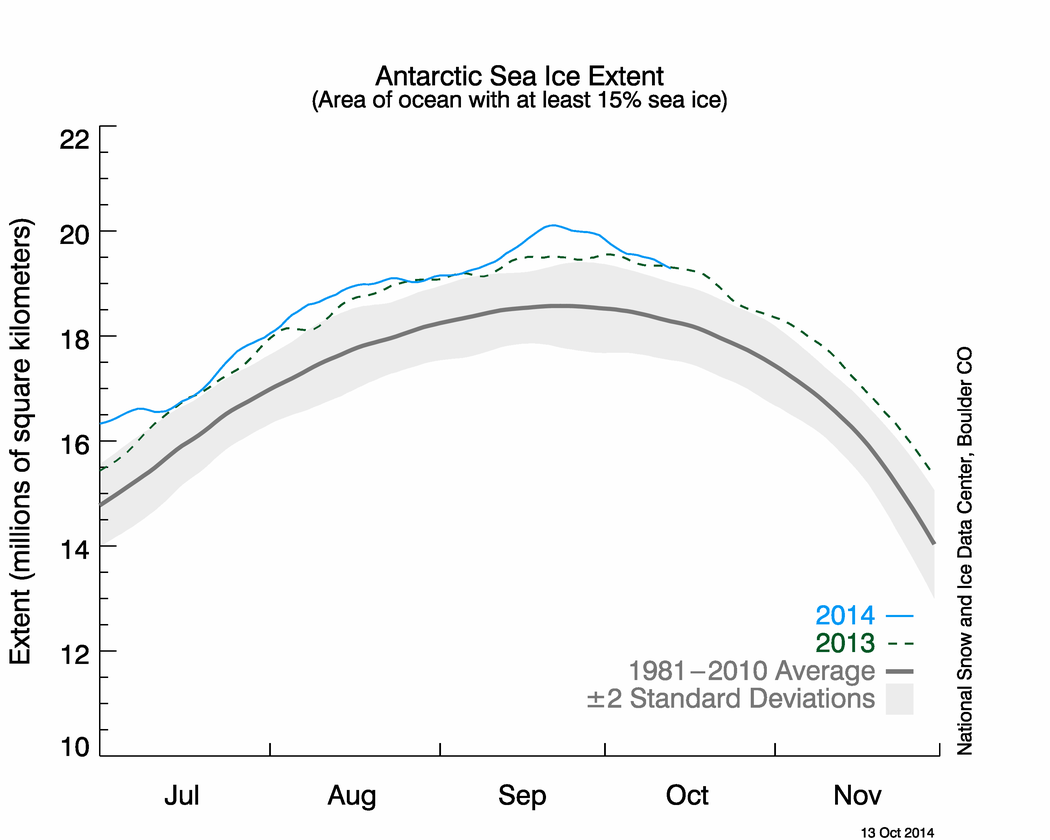
September had the highest southern hemisphere ice cover on record
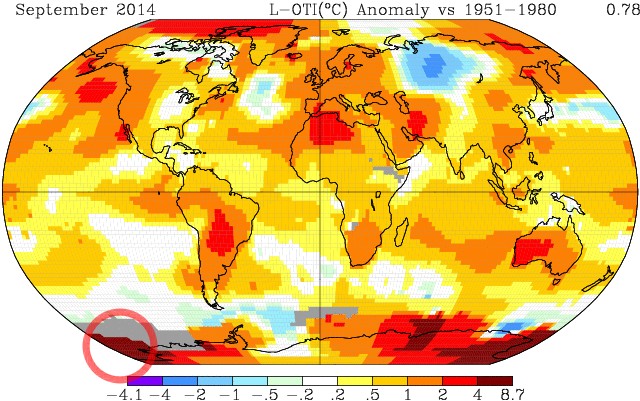
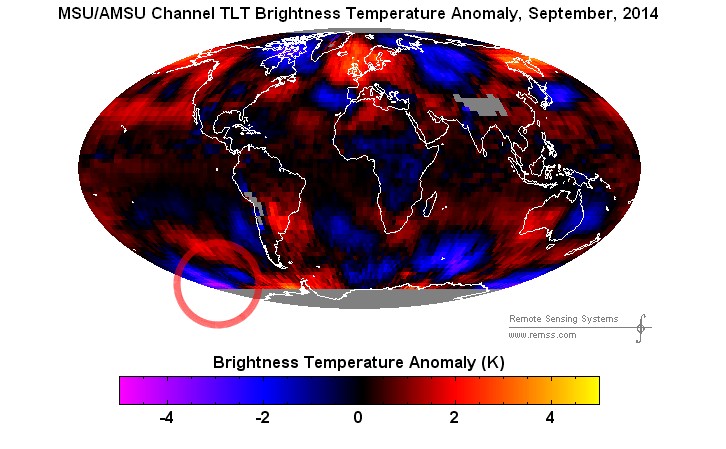
Gavin showed the area around Antarctica hot, while satellites showed it cold.
Gavin showed offshore West Antarctica 4C above normal, while satellites showed it 4C below normal
Only problem with Gavin’s analysis is – he didn’t actually have any temperature data around West Antarctica. He made it all up.
Satellites showed September 15th warmest since 1979 – i.e. just about average. GISS is diverging from satellites at almost 13°C/century
We live in a world where government scientists are encouraged to fabricate data and defy the laws of science.
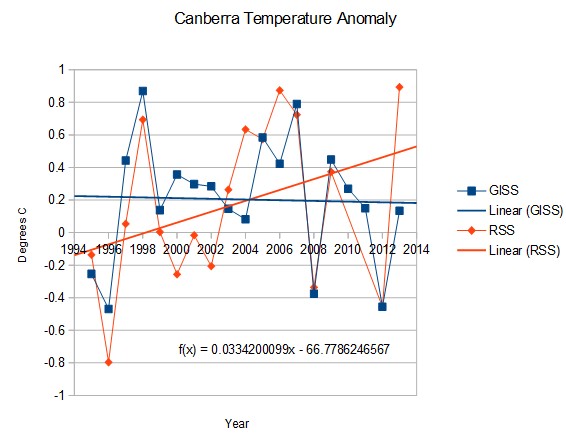
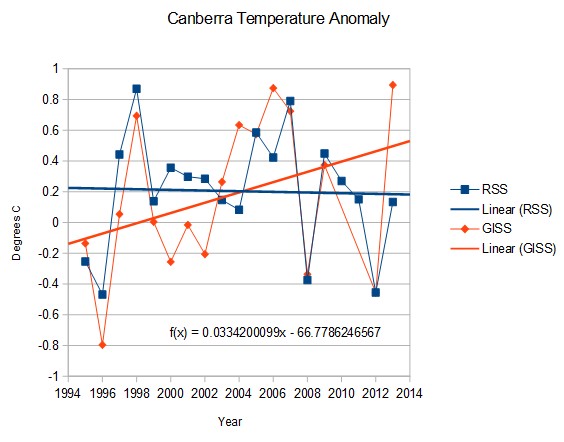
The BOM thermometer at Canberra Airport is cleverly located adjacent to a huge parking lot, and showed 2013 as the hottest year ever. That thermometer shows Canberra warming at 3.3°C/century since 1996
Lower troposphere temperatures measured by satellites above Canberra tell a completely different story. Last year was cooler than average, and is cooling since 1996.
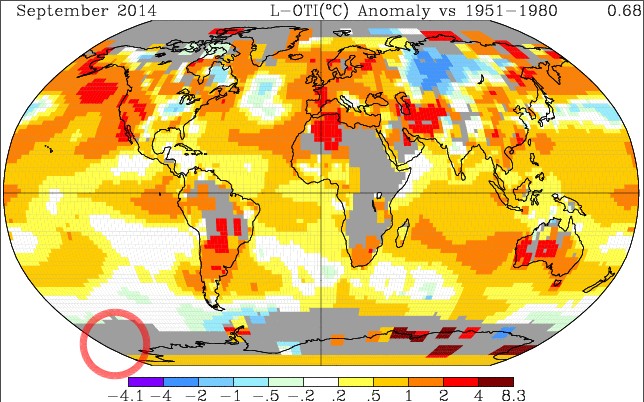
Gavin had almost no data in Antarctica last month, as shown below
So he simply made it up, and made created a completely fake hottest September ever.
But there was a little problem. Antarctica had record sea ice last month, which our corrupt friends at NASA show covered with record heat. The animation below overlays the record sea ice on the GISS fake and measured data. Note that the areas of excess ice around East Antarctica are reported as above normal temperature. That defies the laws of science.
It is completely corrupt, but it is worse than it seems. Most of the stations which Gavin shows as having high anomalies relative to the 1951-1980 baseline, don’t actually have any data from that period.
The whole GISS temperature record has become scientific malfeasance – from top to bottom.
From the “testing progressives to see how just far their stupidity extends” department.
Antarctica set an all-time record for sea ice last month, and Gavin says it was record hot there.
As I predicted, Gavin has reached a tipping point. He claims that September was hottest on record. More accurate satellite data shows that it was only 15th warmest since 1979, and just above average.
Over the past five years, GISS September temperature is diverging from RSS at 12.7°C per century, with a nearly perfect R-squared correlation greater than 0.98.
I picked five random grid cells from the RSS database – one on each coast and one in the interior. They show no net warming since 1979. I’ve run this experiment a few times using different grid cells, and they all produce about the same result.

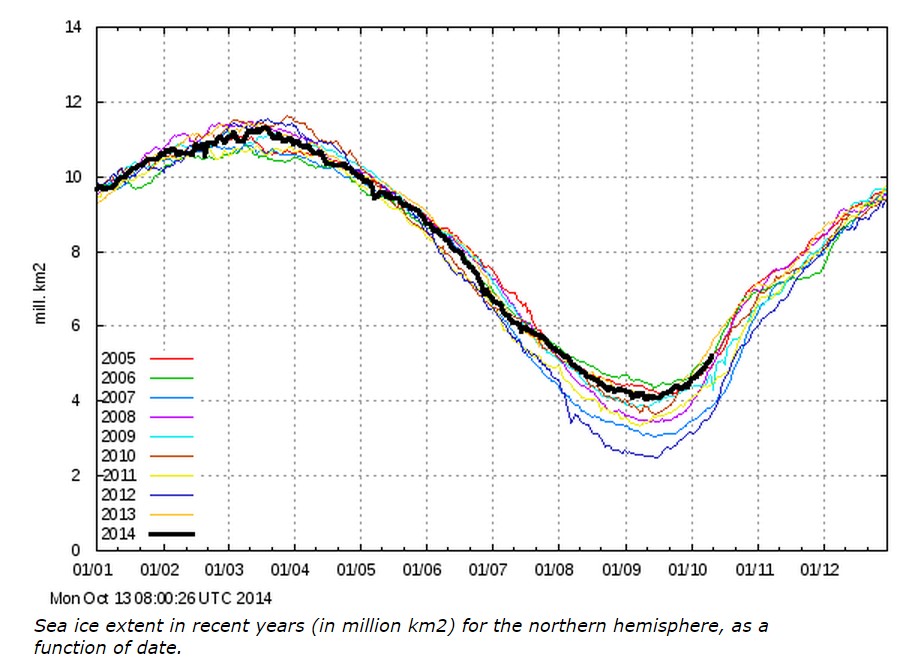
The two highest mid-October Arctic sea ice extents of the past decade occurred in the last two years.
October is looking to do a repeat of last month’s record snow cover
And Antarctic sea ice extent is near a record high.
Climate experts call this a meltdown.
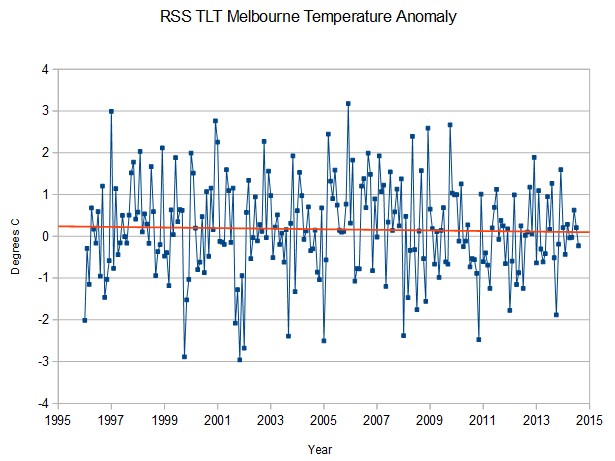
The BOM Melbourne thermometer is cleverly situated adjacent to many lanes of asphalt in downtown Melbourne, and shows a hockey stick of warming, with last year as the hottest year ever.
By contrast, satellite temperatures of the lower troposphere over Melbourne show a slight cooling trend for the past 18 years, with last year pretty close to the long term mean.
BOM then takes the severely tainted urban data, and contaminates surrounding rural stations through a process known as “homogenisation”