Odile Poised to Bring Catastrophic Flooding to Southwest US
Gavin has very little data in Antarctica, but that didn’t stop him from turning a large region of -0.5 degree anomaly into a + 6 anomaly, and reporting to a precision of 0.01 degrees.

Similar story in Africa. Gavin has no coverage over most of the continent, and simply makes temperatures up and reports them to 0.01 degrees. RSS showed Africa below normal temperature in August.

John Kerry making up one lie after another
When 97 percent of scientists agree on anything, we need to listen, and we need to respond.
And they agree that, if we continue to go down the same path that we are going down today, the world as we know it will change – and it will change dramatically for the worse.
There has never been any study or survey which showed anything remotely in the ballpark of what Kerry claimed.
Next he gets into a discussion of science which makes alchemists look like serious people.
So we know this is happening, and we know it with virtually the same certainty that we understand that if we reach out and touch that hot stove, we’re going to get burned. In fact, this is not really a complicated equation. I know sometimes I can remember from when I was in high school and college, some aspects of science or physics can be tough – chemistry. But this is not tough. This is simple. Kids at the earliest age can understand this.
Try and picture a very thin layer of gases – a quarter-inch, half an inch, somewhere in that vicinity – that’s how thick it is. It’s in our atmosphere. It’s way up there at the edge of the atmosphere. And for millions of years – literally millions of years – we know that layer has acted like a thermal blanket for the planet – trapping the sun’s heat and warming the surface of the Earth to the ideal, life-sustaining temperature. Average temperature of the Earth has been about 57 degrees Fahrenheit, which keeps life going. Life itself on Earth exists because of the so-called greenhouse effect. But in modern times, as human beings have emitted gases into the air that come from all the things we do, that blanket has grown thicker and it traps more and more heat beneath it, raising the temperature of the planet. It’s called the greenhouse effect because it works exactly like a greenhouse in which you grow a lot of the fruit that you eat here.
This is what’s causing climate change. It’s a huge irony that the very same layer of gases that has made life possible on Earth from the beginning now makes possible the greatest threat that the planet has ever seen.
How did the world’s stupidest people get control of the country?
WASHINGTON — Militants for the Islamic State in Iraq and Syria have traveled to Mexico and are just miles from the United States. They plan to cross over the porous border and will “imminently” launch car bomb attacks. And the threat is so real that federal law enforcement officers have been placed at a heightened state of alert, and an American military base near the border has increased its security.
Dr. Bill Gray is one of my heroes. He is a top hurricane forecaster, and one of the few people who actually understands the climate. He has been self-funded since 1993, when Al Gore cut off his long time NOAA funding because of his refusal to capitulate to the global warming orthodoxy. And most importantly because his late wife Nancy was the key player behind the excellent set of bike trails in Fort Collins, as mayor during the 1980’s.
———————————————————————————————————-
William M. Gray
Professor Emeritus
Department of Atmospheric Science
Colorado State University
Fort Collins, CO 80523
If you were to ask ten people on the street if mankind’s activities are causing global warming, at least seven or eight out of ten would likely say yes. This is due to nearly 25 years of gross exaggeration of the human-induced global warming threat by scientists, environmentalists, politicians, and the media who wish to profit from the public’s lack of knowledge on this topic. Many have been lead to believe that Al Gore’s movie and book, An Inconvenient Truth, provides incontrovertible evidence that human-induced global warming is a real threat. Yet, contrary to what is heard from warming advocates, there is considerable evidence that the global warming we have experienced over the last 30 years and over the last 100 years is largely natural. It is impossible to objectively determine the very small amount of human-induced warming in comparison to the large natural changes which are occurring.
Many thousands of scientists from the US and around the globe do not accept the human-induced global warming hypothesis as it has been presented by the Intergovernmental Panel on Climate Change (IPCC) reports over the last 15 years. The media has, in general, uncritically accepted the results of the IPCC and over-hyped the human aspects of the warming threat. This makes for better press than saying that the climate changes we have experienced are mostly natural. The contrary views of the many warming skeptics have been largely ignored and their motives denigrated. The alleged ‘scientific consensus’ on this topic is bogus. As more research on the human impact on global temperature change comes forth, more flaws are being found in the hypothesis.
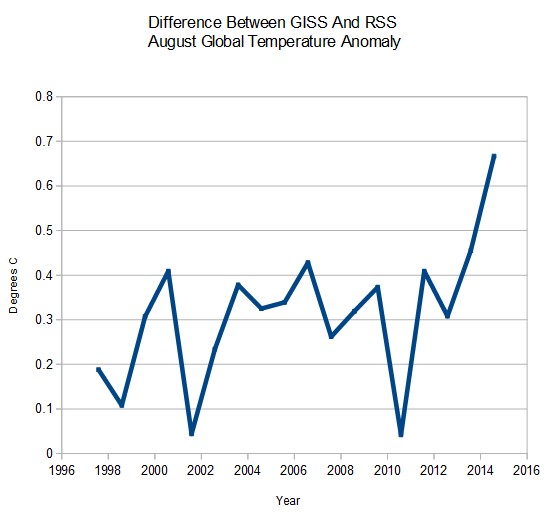
This is today’s version of GISS divergence from RSS graph. Normally during El Nino the gap closes, because the atmosphere warms more than the surface.. This year’s mini-El Nino has done the opposite.
Yesterday, Gavin told the Huffington Post that August was the hottest on record globally. He seems to have changed his mind since then, because today his map shows August was cooler than 2011 by 0.02 degrees.
2014 0.68 anomaly : Data.GISS: GISS Surface Temperature Analysis
2011 0.70 anomaly : Data.GISS: GISS Surface Temperature Analysis
RSS shows that August was seventh coolest and below average since 1997. So how did Gavin create his since reversed scientific flustercluck?
There were three stations in Antarctica on the right side of the 250 km map below which he marked as very hot. Those three stations averaged about -20C. This map has 250km extrapolation, and gives a feel for where the stations are located, and where there is no data.
He extrapolated those three -20C Antarctic stations across a huge area of below normal temperatures on both the lower right and lower left side of the map, and massively skewed his global average anomaly using a large area of fake +6C anomaly, which he declared hot at -20C. This map shows Gavin’s 1200 km extrapolations to smear the earth with non-existent warm data.
But it is much worse than it seems. None of those three stations actually have any temperature data during the 1951-1980 baseline period, so his since recanted (disproven by his own data) claim is a complete fraud. How can he know what the anomaly is, if there was no temperature data during the baseline period? These are the three stations in the region which he has August 2014 temperature data for.
There are all kinds of other things he did wrong, including filling in Africa and South America with fake warm data, when RSS showed them cold. Problems with Australia too, which RSS showed cold.
Now lets look at Gavin’s abuse of the Arctic. DMI showed the area north of 80N as first or second coldest on record. Gavin had no data north of 80N, but filled it in with hot data,
In summary, the claim of record heat has since been disproven by his own data, and was based largely on fake, cold data at the poles – which he declared to be hot.
How could Antarctica have been hot? They have record sea ice extent, indicating the winds are blowing away from the pole, towards the coast.
I found out what Gavin did to make August the hottest ever. It will blow you away.
August was cool in the US, western Europe, southern Asia, parts of Siberia, Australia, Africa, South America, Antarctica and the Arctic. It was the first or second coldest summer on record north of 80N.
And NASA says it was the hottest August ever.
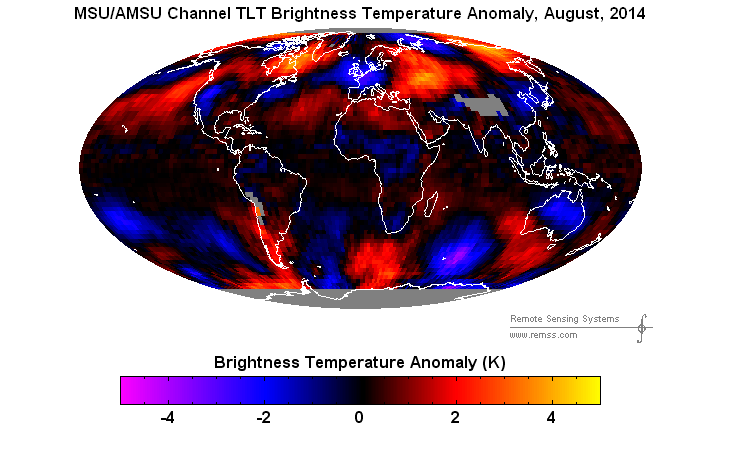
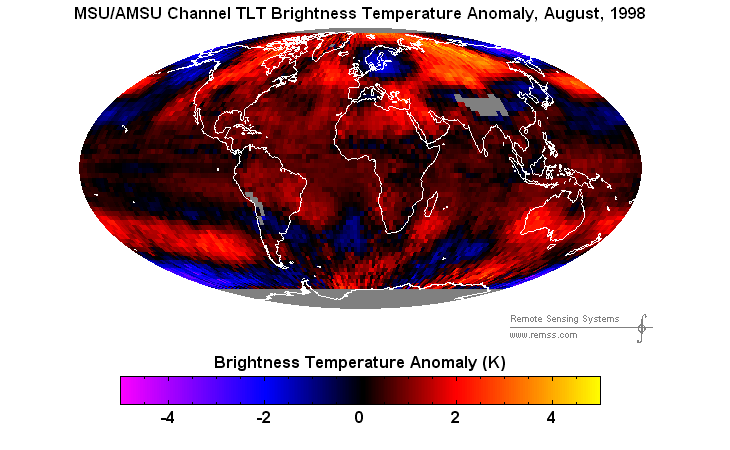
Compare vs. August 1998, when almost the whole world was hot.
We have passed a tipping point of full out fraud at government agencies.
[CORRECTION the graph at the bottom is incorrect. I was looking at the HUFF Post map, which showed warming since 1880, not temperature anomaly.]
I speculated a few months ago that NASA and NOAA have been instructed to make 2014 the hottest year ever, and it is becoming apparent that I was correct. After a big cool down in August, NASA has declared it to be the “hottest August ever.”.
This past August was the warmest since records began in 1881, according to new data released by NASA. The latest readings continue a series of record or near-record breaking months. May of this year was also the warmest in recorded history.
Dr. Gavin Schmidt, a climatologist and climate modeler at NASA’s Goddard Institute for Space Studies, told The Huffington Post that while the agency’s data does indicate that this August was the hottest on record, the difference falls within a few hundredths of a degree compared with previous Augusts.
In fact it was the sixth coolest August since 1997, and below the declining trend line.
Gavin and crew accomplished this by obliterating the record for deviating from reality.
[CORRECTION – the graph below is incorrect. It should show 2014 as a little over 0.5, not 0.68]