Betting On A Sure Thing

A Norwegian football fan has won more than £500 after placing a £3 bet that Luis Suárez would bite someone at the World Cup.

Thomas Syverson, of Trondheim, placed a bet at 175/1 on online gambling website Betsson along with 166 other punters – one of whom scooped an even bigger win of almost £2,000.

Luis Suarez bite bet leaves punters cashing in on 175-1 odds | Mail Online
Posted in Uncategorized | 4 Comments

Cleaning Up The Temperature Mess

Anthony Watts has put a huge amount of work into documenting significant problems with station siting and UHI.

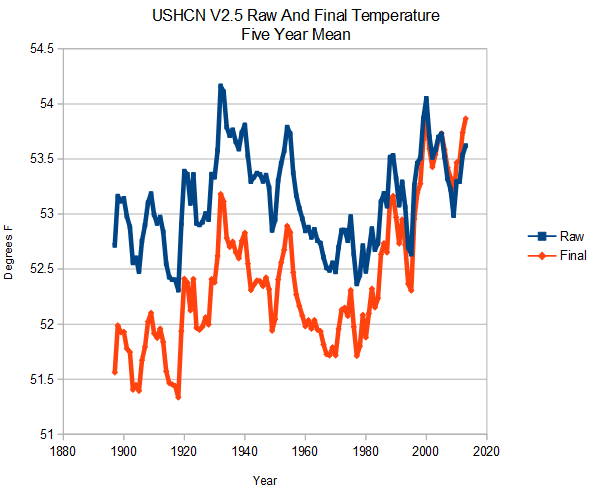
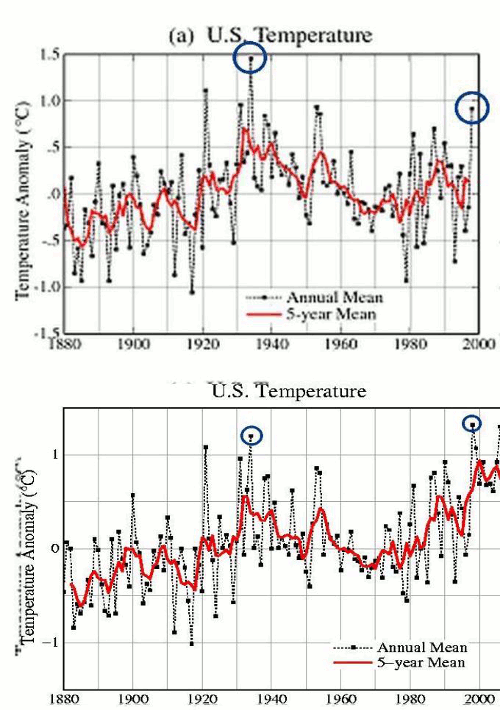
Beyond that are the issues with the data handling and manipulation. USHCN has actually reversed the measured trend since 1920 from cooling to adjusted warming, based on the fact that a few of their co-benefactors in the global warming scam thought it was a good idea.

I come from a different background. I was on the design team of many microprocessors, including the Intel I7, Intel Itanium and IBM Power PC. These designs have billions of transistors, and every one of them has to work perfectly. These companies spend vast resources on flushing every last bug out of these designs.

How did we manage to isolate and remove every bug? The process involved analyzing  the design using many different simulation and modeling techniques. A single approach would be inadequate, and would guarantee failure. They hire dozens of people whose sole purpose is to find and flush out problems with the design, using as much creativity and diversity of thought as possible. The designers benefit from the process, because they want their bugs found before the product goes to market.

NASA and NOAA do the exact opposite. They are pushing an agenda, and have developed a single methodology which achieves the results they are looking for. When someone like me comes along and analyzes the data using different approaches, how do they respond?

Everyone else does it our way

And that is exactly the problem. Everyone else is doing their data analysis the same way, using the same assumptions, so they all come up with the same results. I am digging up all sorts of problems with their data and methodology, and they would be wise to listen – if they actually are interested in producing an accurate temperature record.

Posted in Uncategorized | 63 Comments

The Muller Strategy

Muller wanted to be the chief alarmist, so he bashed Michael Mann in an attempt to become respectable among skeptics. It didn’t go over very well for him.

Sadly, some skeptics have attempted the same trick in reverse.

Posted in Uncategorized | 17 Comments

Shocking Discovery From Scientists

Scientists have discovered that life itself can not exist without large amounts of greenhouse gases H2O and CO2 in the atmosphere.

The EPA classifies the fundamental building blocks of life as pollutants, which tells us much about their ultimate intentions and motivations.

Posted in Uncategorized | 8 Comments

A Better Peer-Review Idea

Alarmists keep telling me to use the peer review process. I am all for that.

Journals should send me articles for review, and I will restore the climate peer-review process to respectability.

Once the process becomes legitimate, then I will publish.

Posted in Uncategorized | 21 Comments

Smoking Gun Of Massive USHCN Adjustment Confirmation Bias

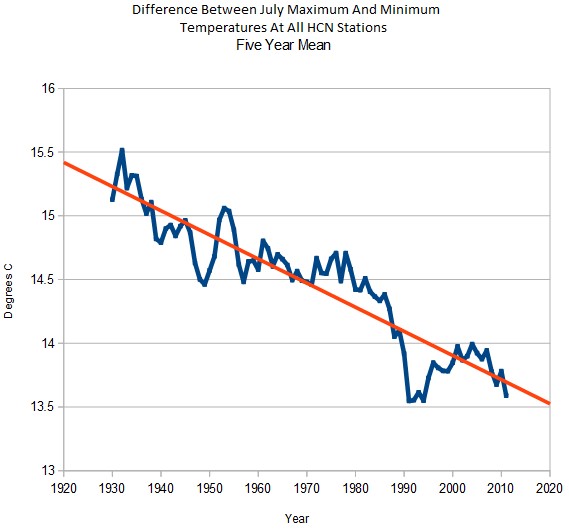
US July maximum temperatures have plummeted since the 1930s.

ScreenHunter_648 Jun. 25 06.17

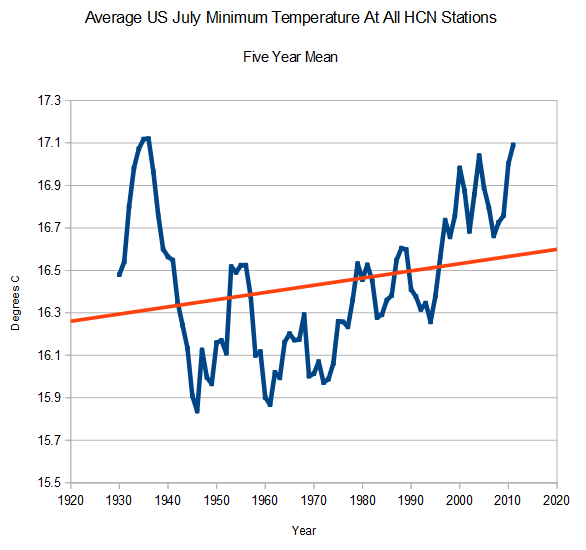
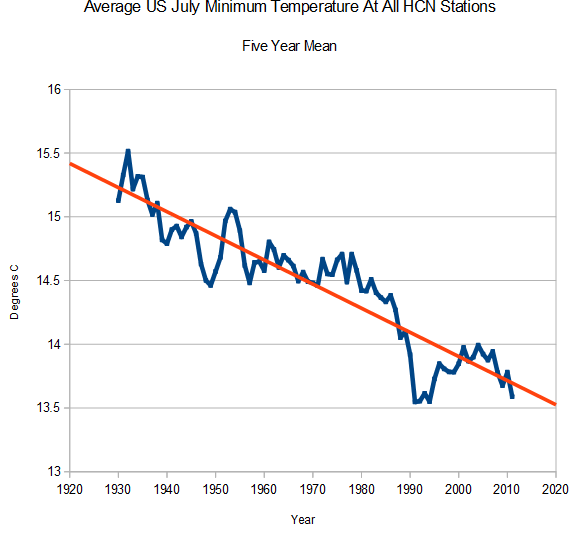
Over the same period, US July minimum temperatures have increased.

ScreenHunter_649 Jun. 25 06.18

The difference between maximum and minimum temperatures has dropped by more than 15%.

ScreenHunter_28 Jun. 25 10.33

This is very indicative of urban heat island contamination. Paved roads, snow removal, irrigation, and other factors cause nighttime temperatures to be elevated, and all have increased sharply since 1930. We have seen nearly 2C (3.6F) summer UHI since 1930.

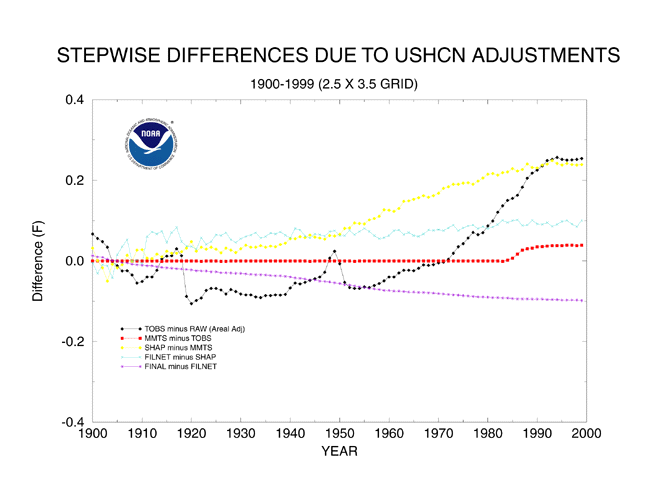
So how much does USHCN correct for UHI? less than 0.1F

ts.ushcn_anom25_diffs_pg

ts.ushcn_anom25_diffs_pg.gif (650×502)

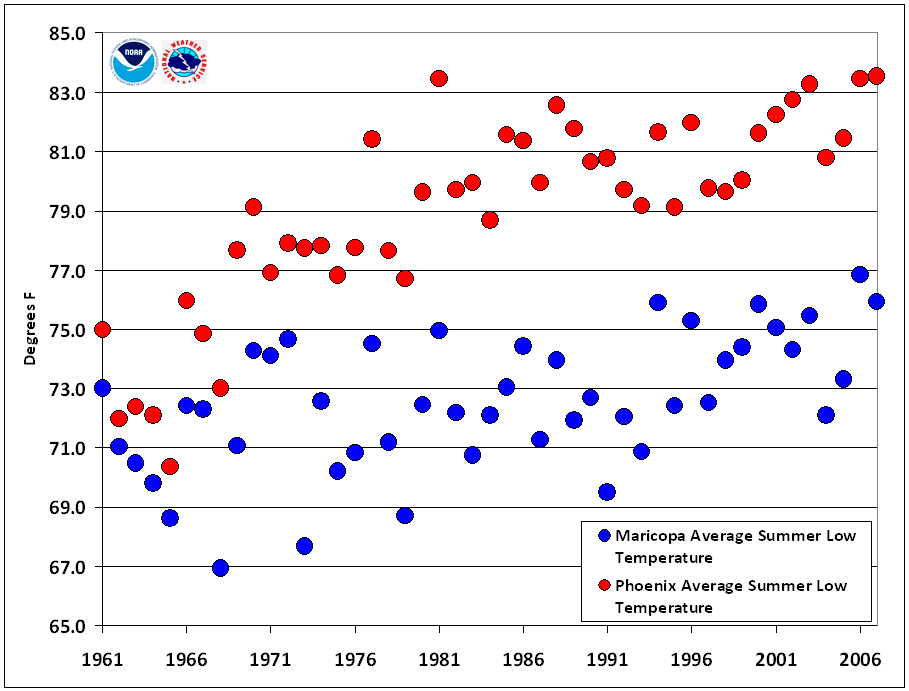
NOAA has documented more than six degrees of UHI in Phoenix.

UHIlows

National Weather Service – NWS Phoenix

At the same time they exaggerate TOBS and FILNET, USHCN massively undercounts UHI. If they did their adjustments properly, they would increase the cooling trend since the 1930s, rather than reverse it.

As a result of data tampering, they have made a complete mockery of the US temperature record.

ScreenHunter_235 Jun. 01 15.26

Zeke blows this all off as “changing station composition” This is not credible for many reasons. Zeke needs to come up with a physical explanation for why the changes since 1930 have caused daytime temperatures to plummet, while nighttime temperatures have increased. And remember that the station loss didn’t begin until 1990.

Posted in Uncategorized | 28 Comments

An Exercise For Dull-Minded Folks

People who try to guess what temperatures should have been in the past are not thinking clearly. A change in elevation can cause temperatures to either increase or decrease. Along the Colorado Front Range, temperatures in the foothills are almost always higher than they are down at lower elevations. Cold air sinks.

As far as TOBS goes, you have no idea if a station operator in 1940 reset their thermometer before they went to bed, as anyone would do who wanted to get meaningful data would do. You don’t know when the road got paved in front of their house. You don’t know when the city started doing snow removal. You don’t know when they planted a lawn, painted their house a different color or installed an air conditioner. There are dozens of factors which affect temperature which can’t be guessed about the past.

Leave the data alone. Adjusting the data will almost certainly introduce confirmation bias, and the odds of getting the adjustments correct are slim to none.

Posted in Uncategorized | 36 Comments

Precision Vs. Accuracy

One of the most fundamental mistakes which wannabee scientists make, is to attempt to apply precision to a problem which hasn’t been sanity tested for accuracy.

It should be obvious to everyone that the current data set is not sane.

What I am doing is what professionals call “sanity testing” – and the adjusted data fails miserably. The problems are too numerous to enumerate, but here are a few of them.

1. Anomalies, infilling and gridding.

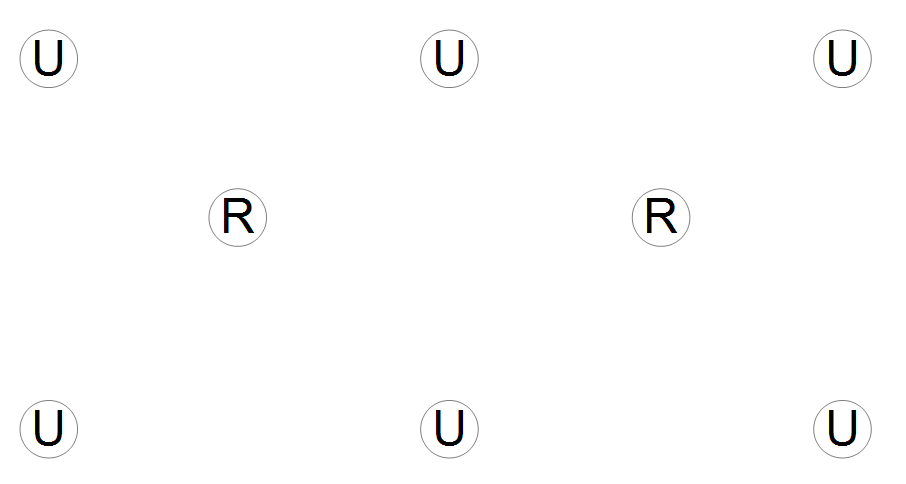
The image below represents a grid cell. The U’s stand for Urban, and the R’s stand for rural. Let’s say that the U anomaly is 1.0 and the R anomaly is 0.0. The average anomaly of this grid cell is 6/8 = 0.75

ScreenHunter_640 Jun. 24 21.24

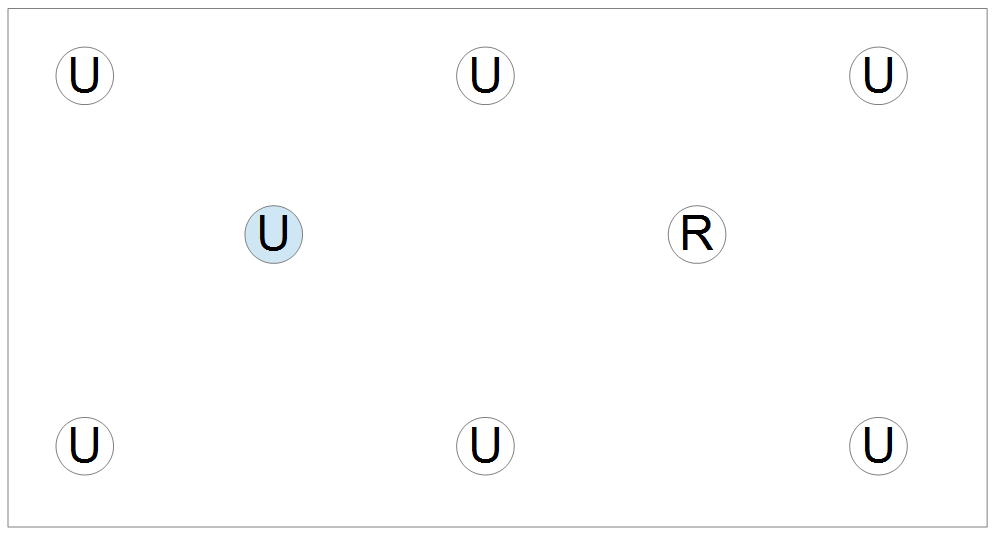
Now, let’s take away one of the rural stations – as has been happening to the network. Because of infilling, the rural station now gets effectively counted as an urban station – due to it being infilled with data from its urban neighbors. The anomaly of the grid cell goes up to 7/8 = 0.875. The infilling aggravated the rural station loss, rather than improving it.

ScreenHunter_642 Jun. 24 21.37

Anomalies, infilling and gridding simply smear data together. This might be a good idea with a truly random error distribution, but that isn’t what we are dealing with.

By using absolute temperatures, I am able to do sanity checking – which is impossible using Zeke’s method. Zeke skips the sanity checking, and goes directly to trying to generate false precision.

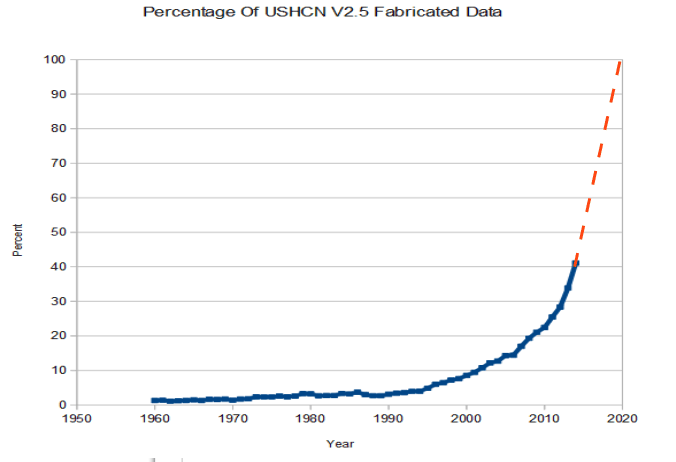
USHCN is losing station data at a phenomenal rate since 1990. If current trends continue, they will have no station data by 2020. Does Zeke plan to eventually use one station to represent the entire country, like Phil Jones does for the southern hemisphere in 1851?

ScreenHunter_266 Jun. 03 08.09

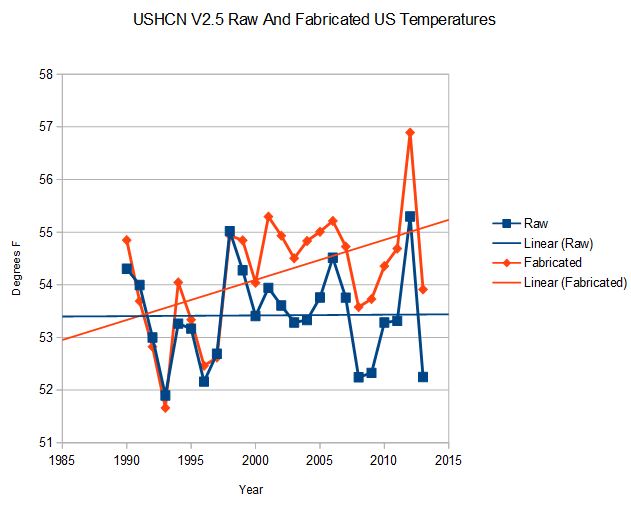
Now, lets look at the raw measured data vs. the fabricated data – i.e. station data which has no raw data to back it up. The raw data shows no trend since 1990. The fabricated data shows a massive warming trend. This a huge red flag that the adjustments are garbage.

ScreenHunter_259 Jun. 02 21.12

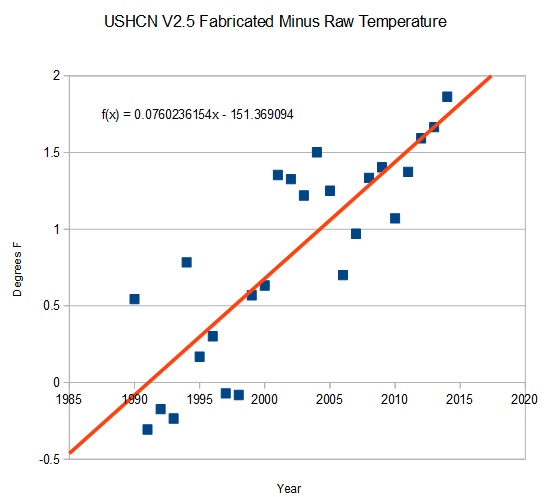
The fabricated data is diverging from the measured data at a mind-boggling rate of almost 8 degrees per century.

ScreenHunter_261 Jun. 02 21.21

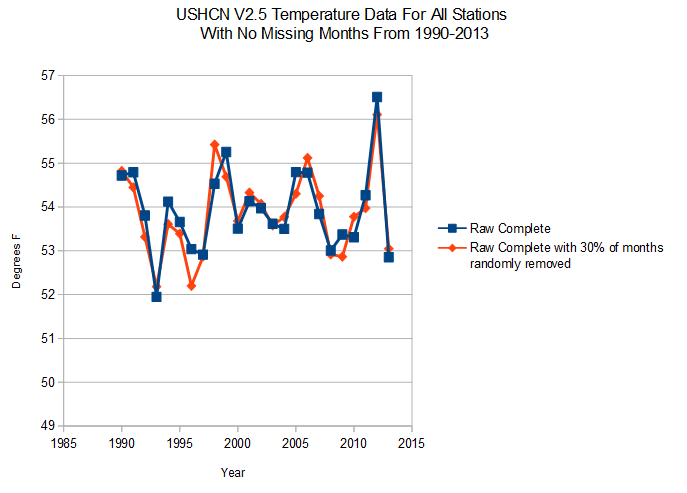
The next experiment is to see what happens if data is removed from all the stations with complete records. The blue line below shows temperatures for all stations with no missing data since 1990. The red line shows the same data set, with 30% of the data randomly removed.

ScreenHunter_351 Jun. 07 22.20

Not surprisingly, random data loss has very little impact on the temperature. Much of science depends on that very principle. This shows us unequivocally that whatever is causing the massive data loss at NOAA is not random. It has a huge bias to it.

Zeke and crew want to smear over all this, and obtain high precision on a garbage data set with very low accuracy. I want to find out what is wrong with the data set.

Not a very subtle distinction. This is a critically important issue, and it would be very helpful if people who should be helping bring it forward would do the right thing.

Posted in Uncategorized | 47 Comments

Today’s Humor

I started the day with Anthony Watts sending an E-Mail to an alarmist saying that I am worse than Michael Mann, because I use only raw, untampered  data.

Then Zeke stopped by and said that my objection to using anomalies was for a “different kind of anomaly.” All he wants me to do is to double count (I will explain this in a later post) lost rural station data via infilling and gridding, and lose any possibility of detecting the huge baseline shifts that have occurred.

Then Suarez bared his teeth.

You can’t make this stuff up.

Posted in Uncategorized | 72 Comments

Definition Of Data Tampering

2. Quality control: Continually adjusting a process to compensate for variations in its output. If the variations are within the control limits of a stable system (and all stable systems have variations) then tampering invariably makes things worse. Only a change in the system itself (and not any ad hoc adjustment) can reduce variation and improve quality. Urge to tamper (trying to do ‘one’s best,’ but actually messing around) springs from the naïve desire to do something anything to improve results without sufficiently understanding the system, and ruins an otherwise working process.

What is tampering? definition and meaning

Posted in Uncategorized | 19 Comments