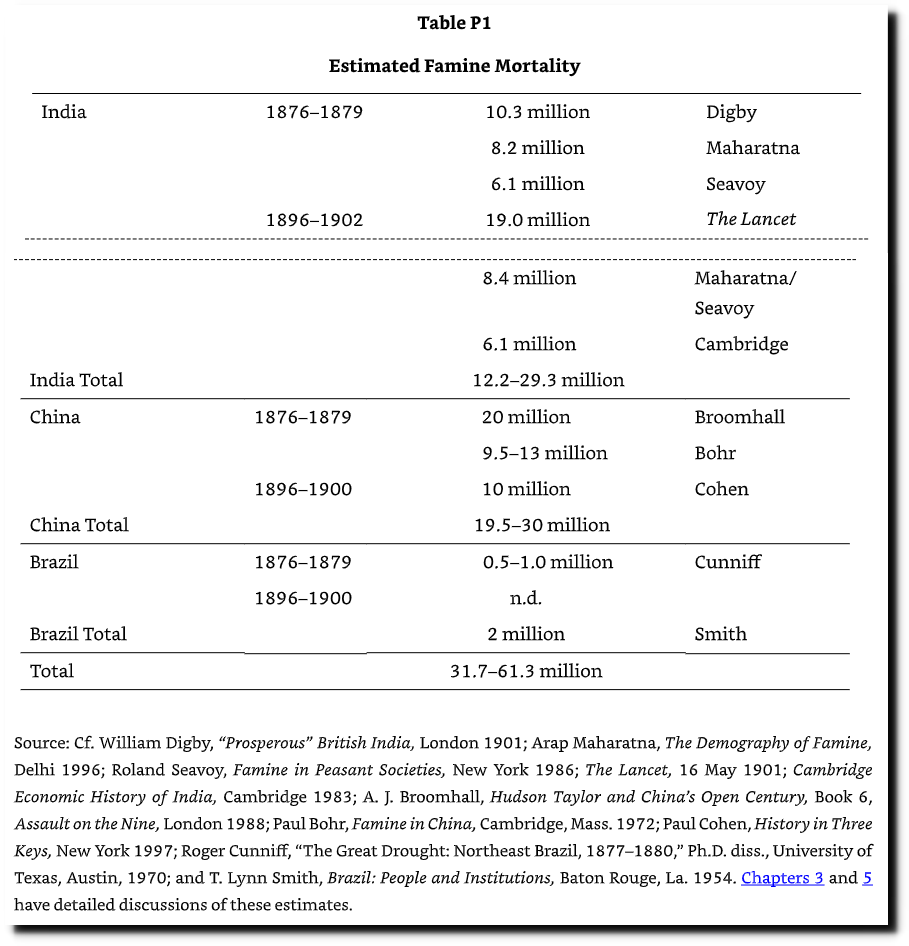
The worldwide drought and record heat of 1876-1878 killed fifty million people.
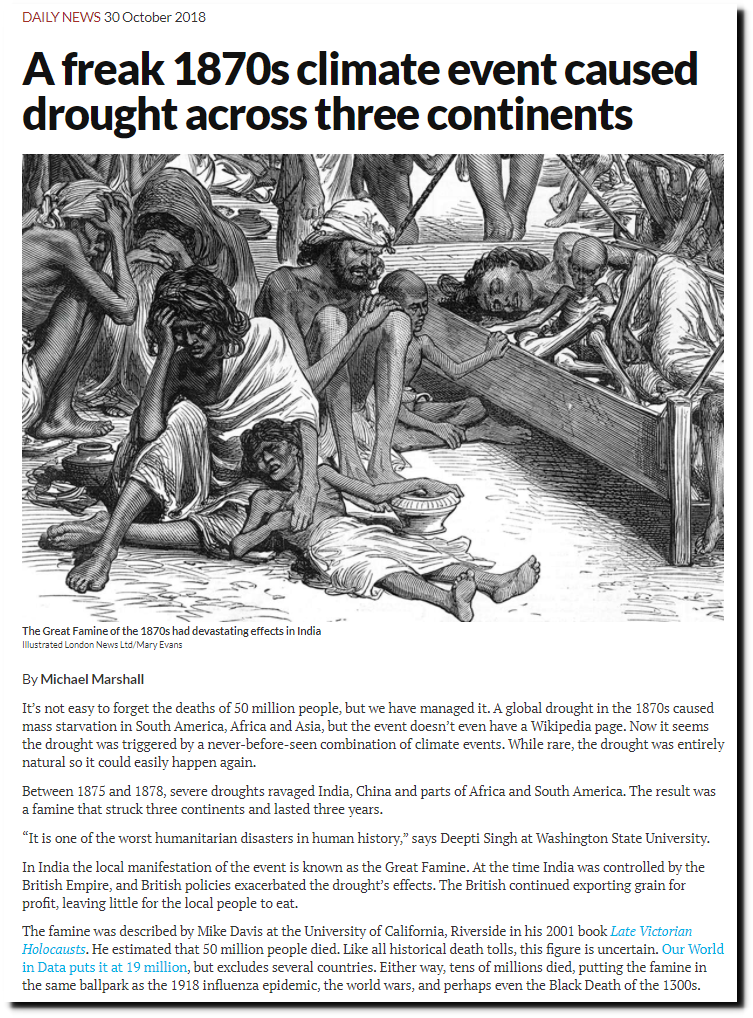
A freak 1870s climate event caused drought across three continents | New Scientist
Late Victorian Holocausts: El Niño Famines and the Making of the Third World , Davis, Mike – Amazon.com
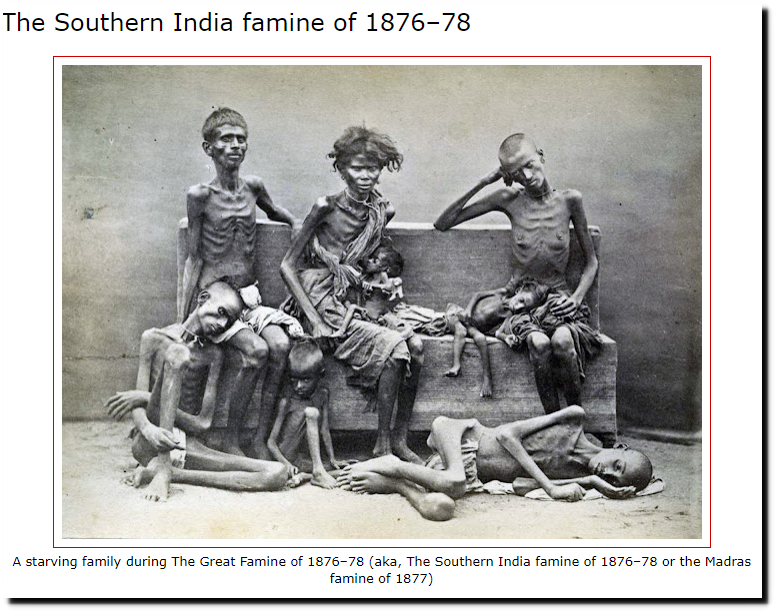
SNAFU!: The Southern India famine of 1876–78

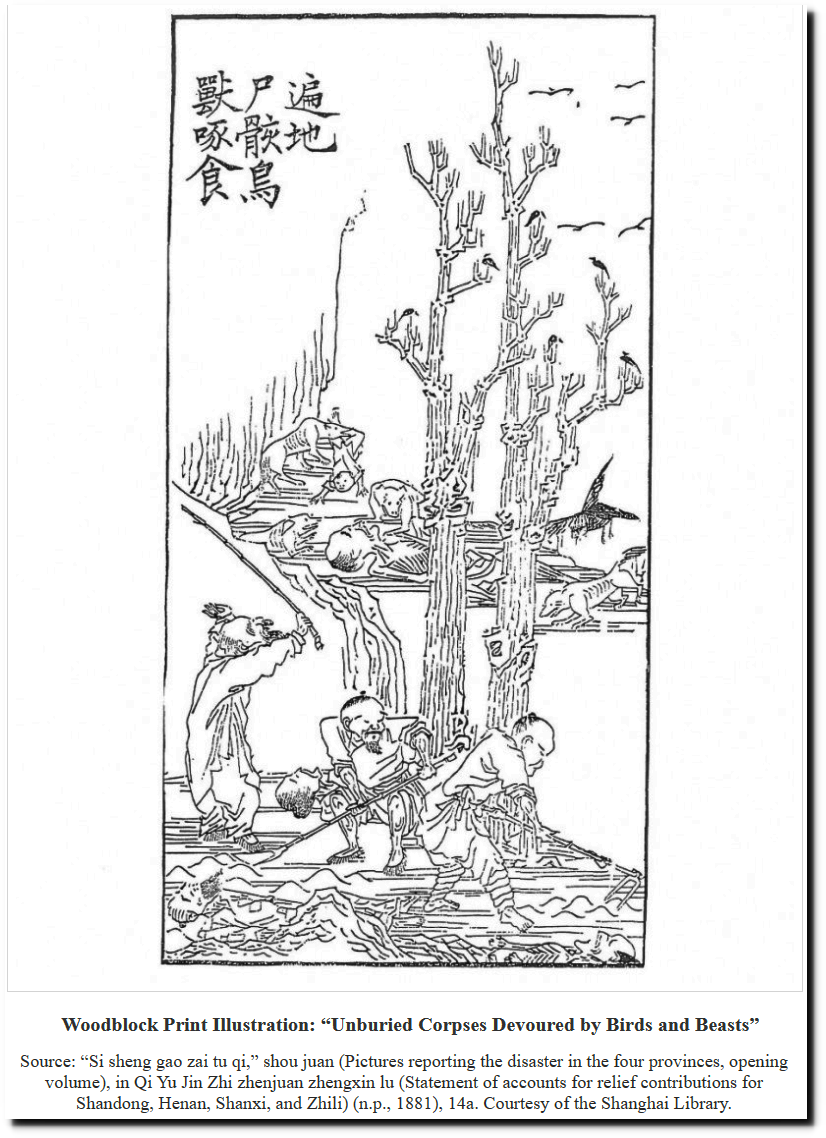
North China famine, 1876-79 | DisasterHistory.org
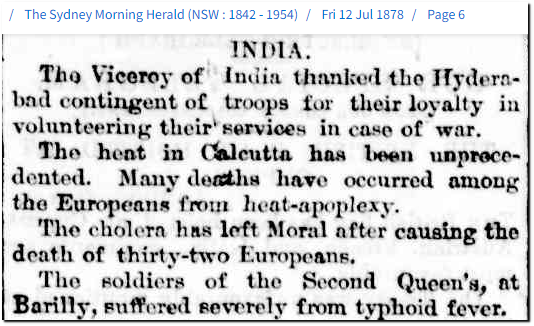
12 Jul 1878 – INDIA. – Trove
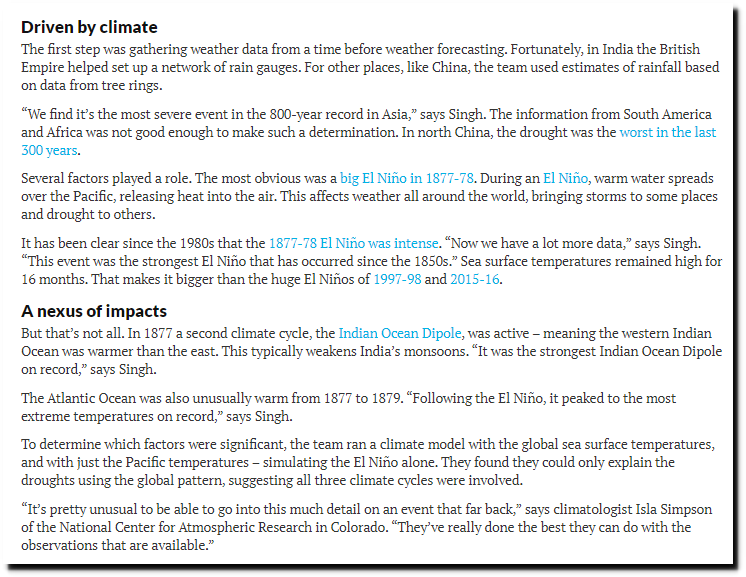
It has been clear since the 1980s that the 1877-78 El Niño was intense. “Now we have a lot more data,” says Singh. “This event was the strongest El Niño that has occurred since the 1850s.” Sea surface temperatures remained high for 16 months. That makes it bigger than the huge El Niños of 1997-98 and 2015-16. A nexus of impacts But that’s not all. In 1877 a second climate cycle, the Indian Ocean Dipole, was active – meaning the western Indian Ocean was warmer than the east. This typically weakens India’s monsoons. “It was the strongest Indian Ocean Dipole on record,” says Singh. The Atlantic Ocean was also unusually warm from 1877 to 1879. “Following the El Niño, it peaked to the most extreme temperatures on record,” says Singh.
A freak 1870s climate event caused drought across three continents | New Scientist
This came at the peak of the Atlantic Multidecadal Oscillation.
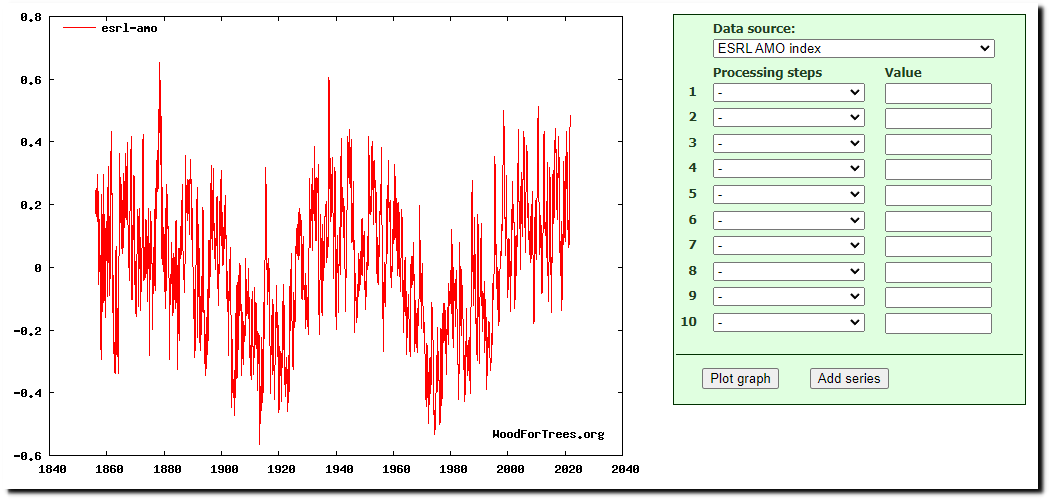
Wood for Trees: Interactive Graphs
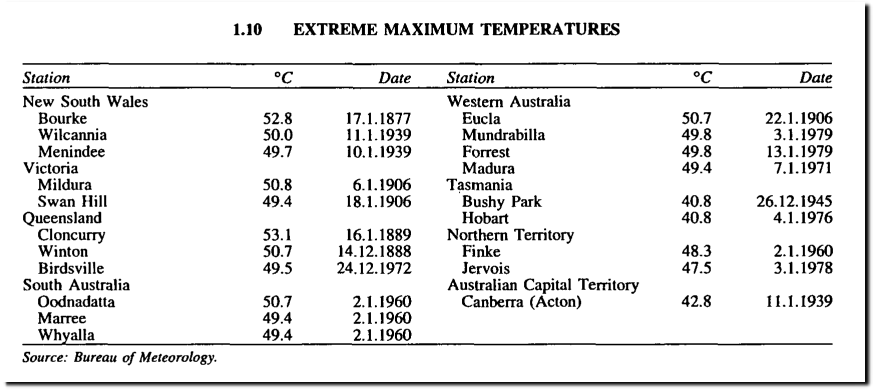
New South Wales’ all-time record temperature of 127F occurred on January 17, 1877.
13010_1995_Bk77.pdf
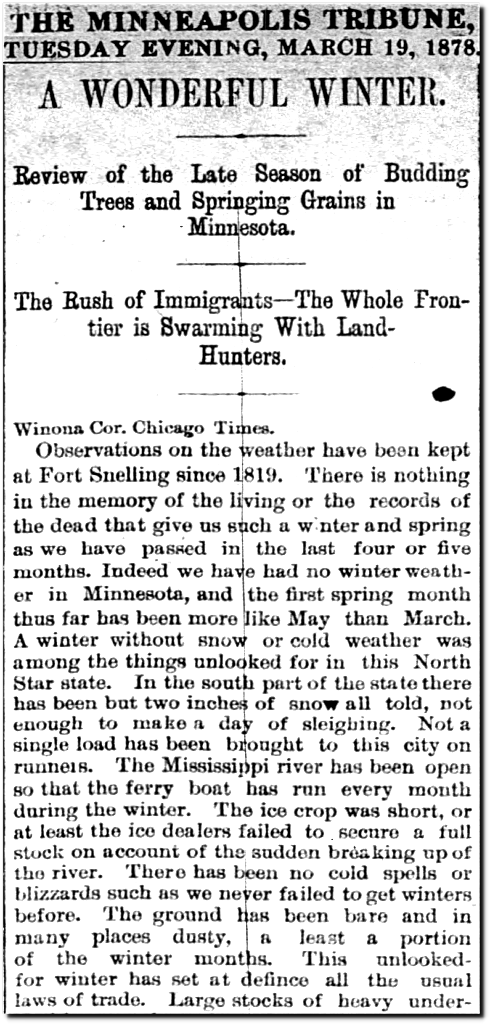
There was no winter in Minnesota that year.
19 Mar 1878, Page 2 – Star Tribune at Newspapers.com
Australia had record heat.
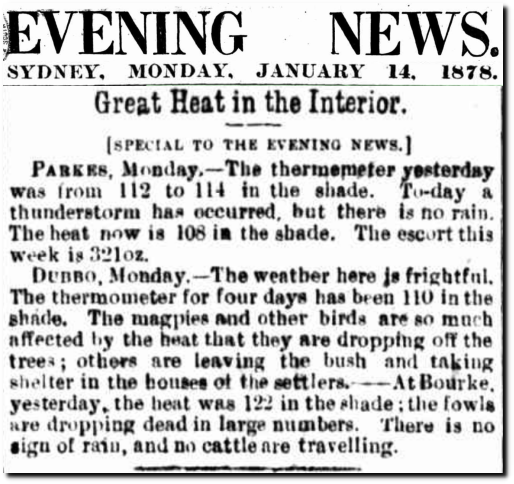
14 Jan 1878 – Great Heat in the Interior. – Trove
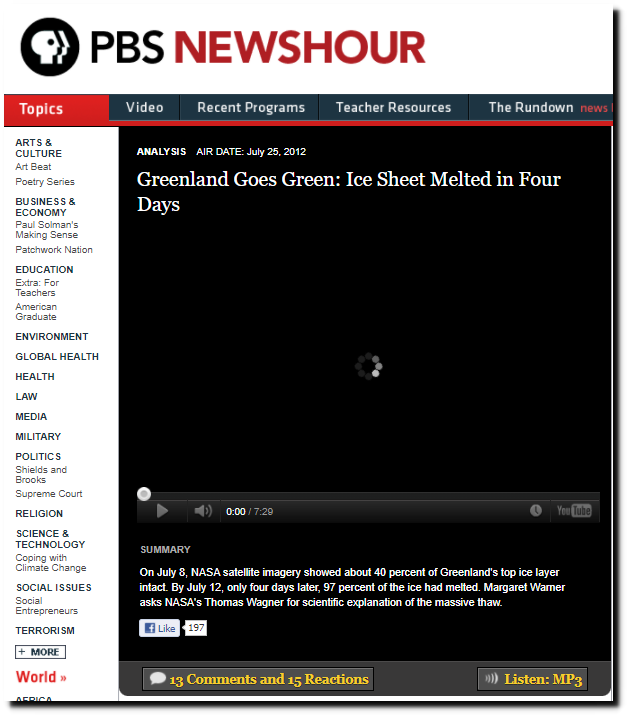
China had a famine which killed nearly ten million people.
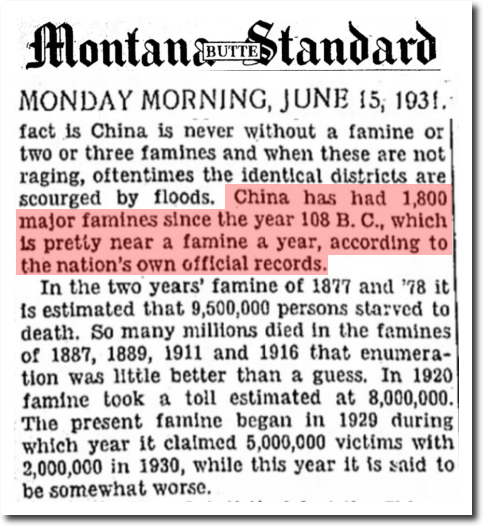
15 Jun 1931, Page 6 – Montana Butte Standard at Newspapers.com
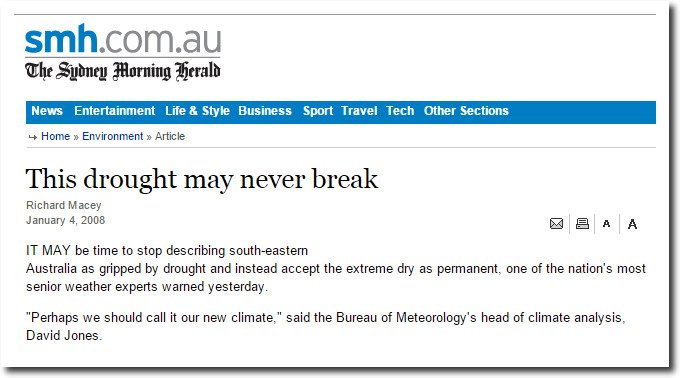
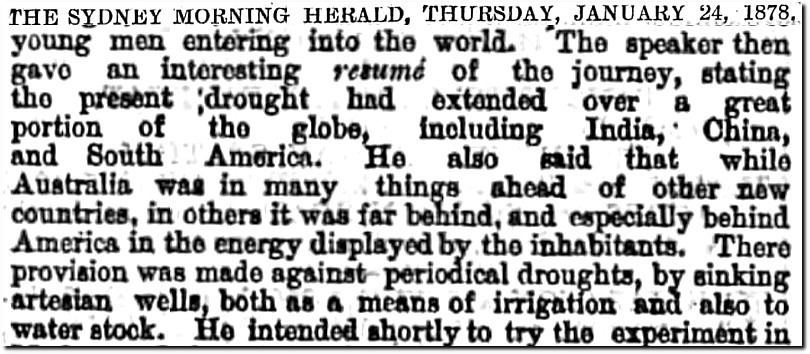
And there was universal drought.
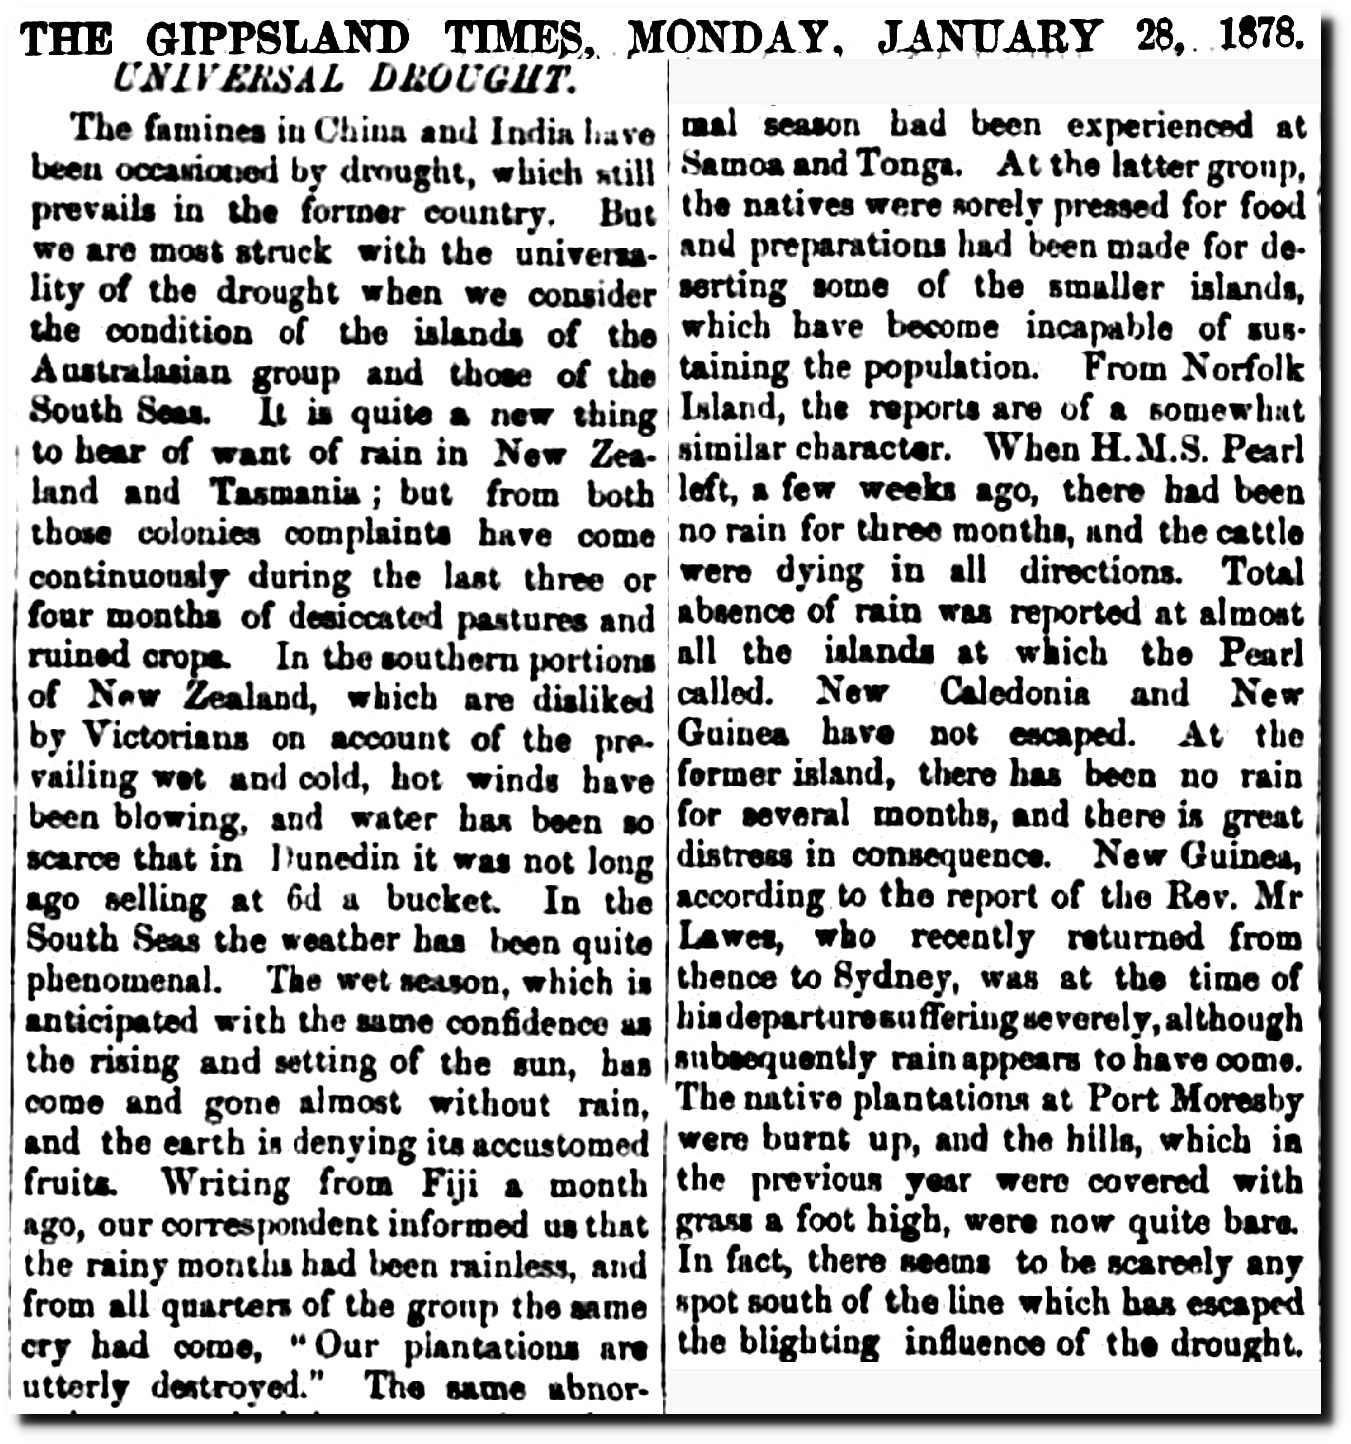
28 Jan 1878 – UNIVERSAL DROUGHT. – Trove

29 Jan 1878, Page 7 – The Sydney Morning Herald at Newspapers.com

31 Jan 1878, Page 7 – The Sydney Morning Herald at Newspapers.com
24 Jan 1878, Page 7 – The Sydney Morning Herald at Newspapers.com
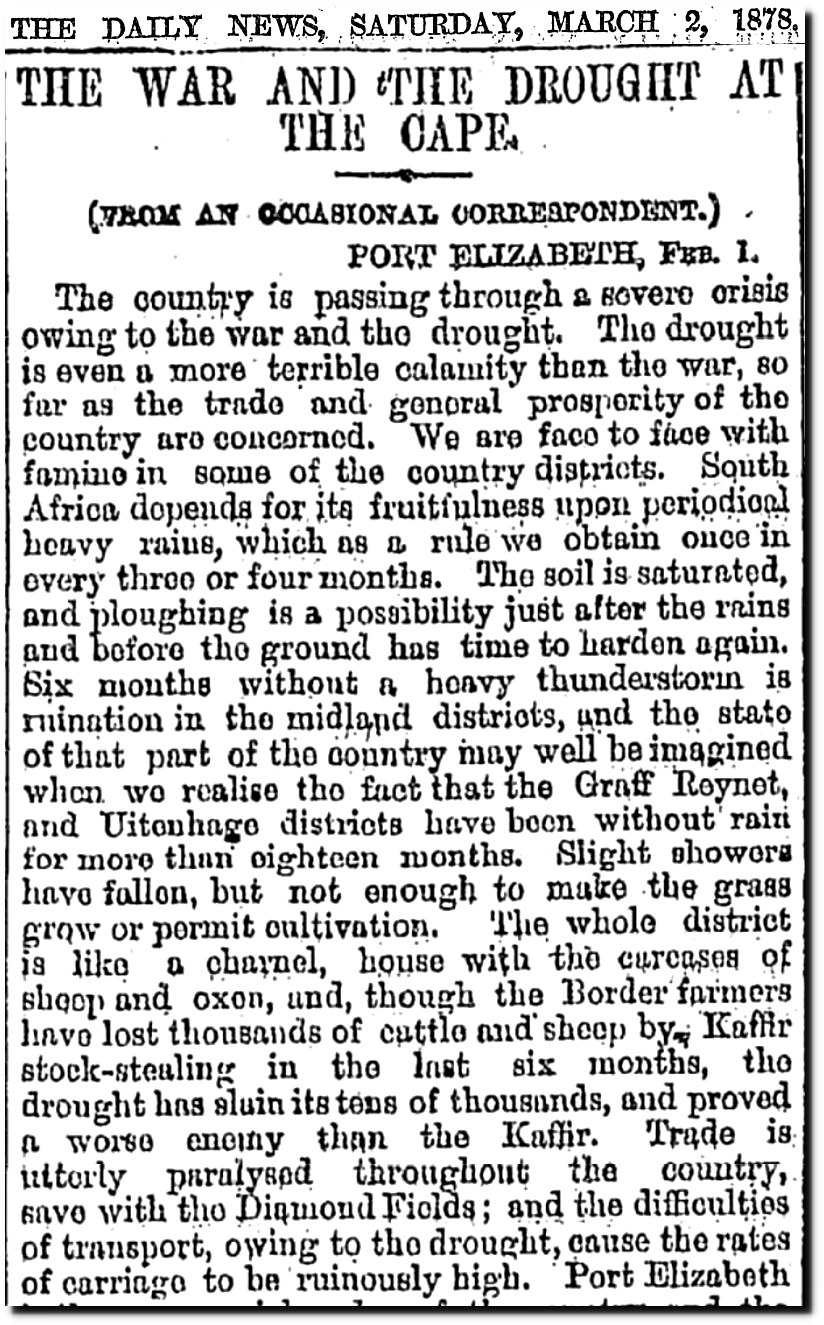
02 Mar 1878, 6 – Daily News at Newspapers.com
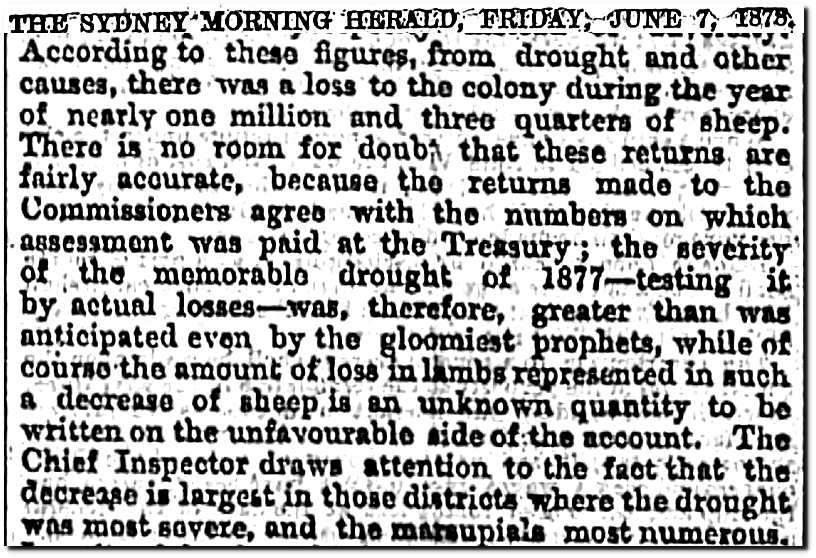
07 Jun 1878, Page 7 – The Sydney Morning Herald at Newspapers.com
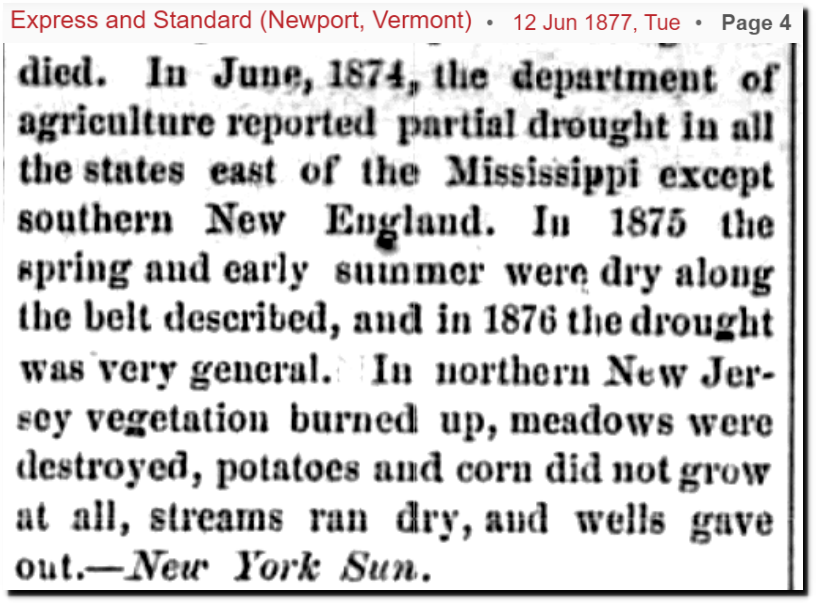
12 Jun 1877, 4 – Express and Standard at Newspapers.com
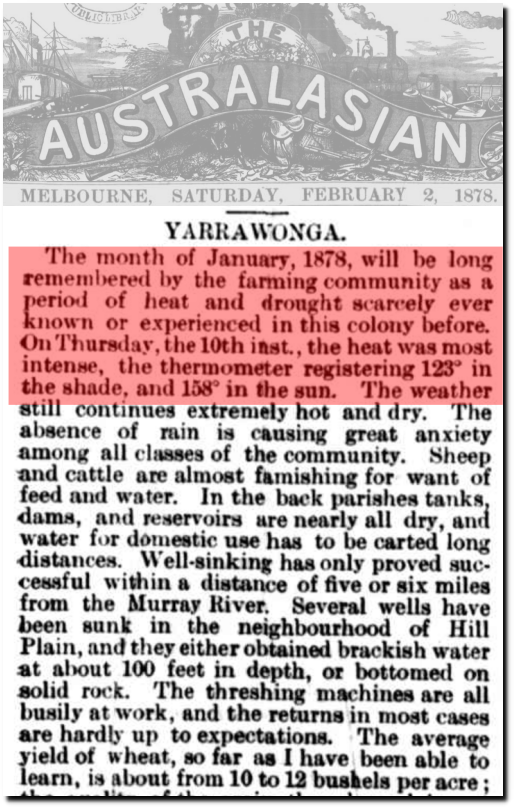
02 Feb 1878 – YARRAWONGA. – Trove
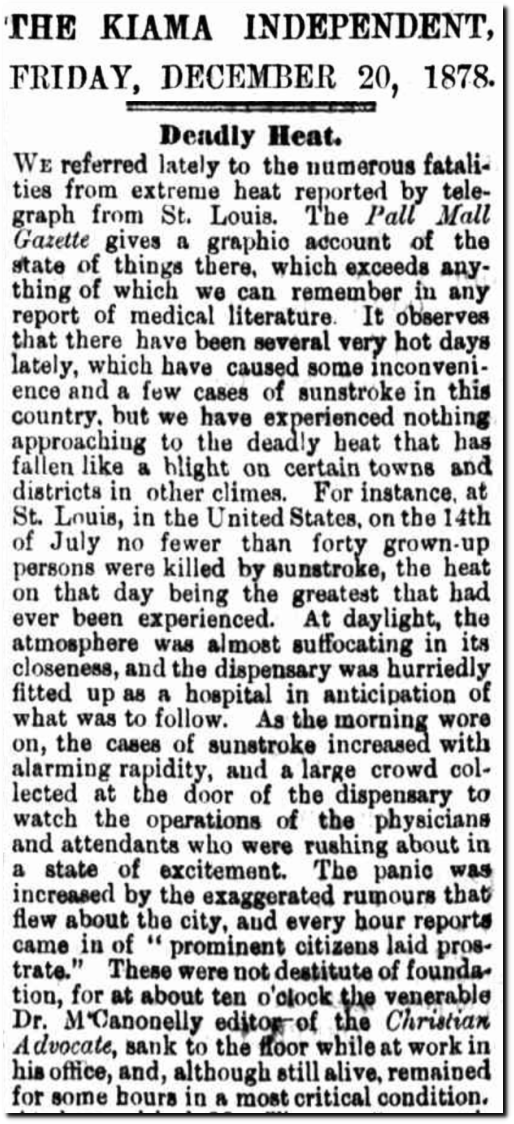
20 Dec 1878 – Deadly Heat. – Trove
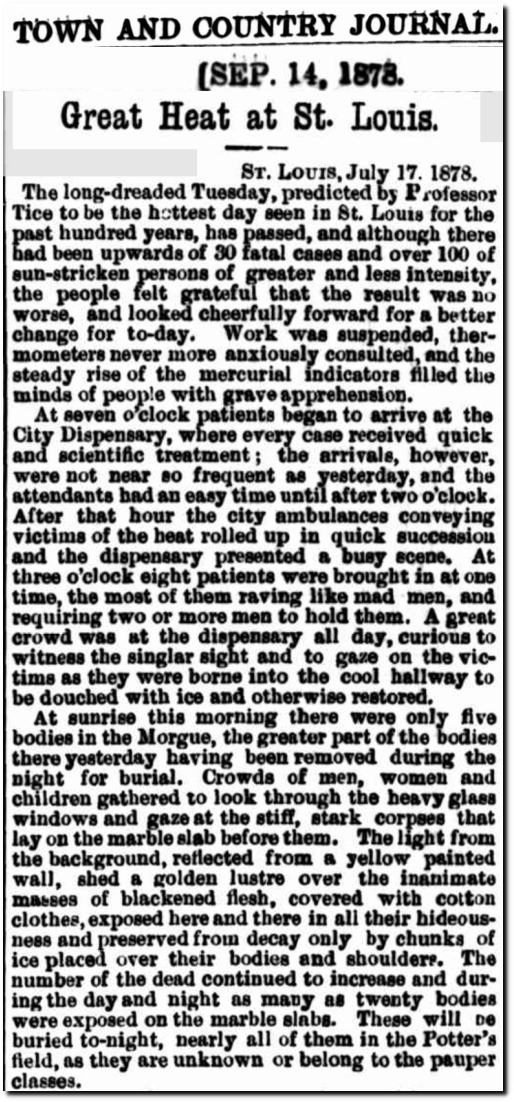
14 Sep 1878 – Great Heat at St. Louis. – Trove
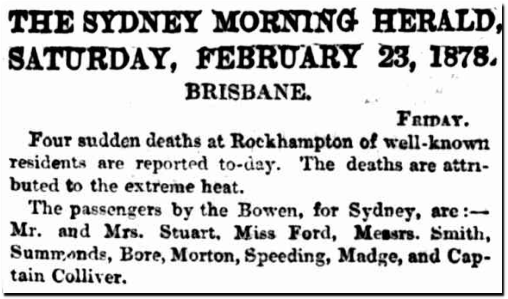
23 Feb 1878 – BRISBANE. – Trove
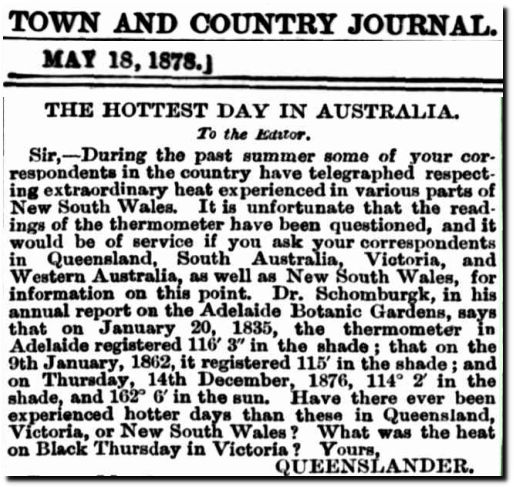
18 May 1878 – THE HOTTEST DAY IN AUSTRALIA. – Trove
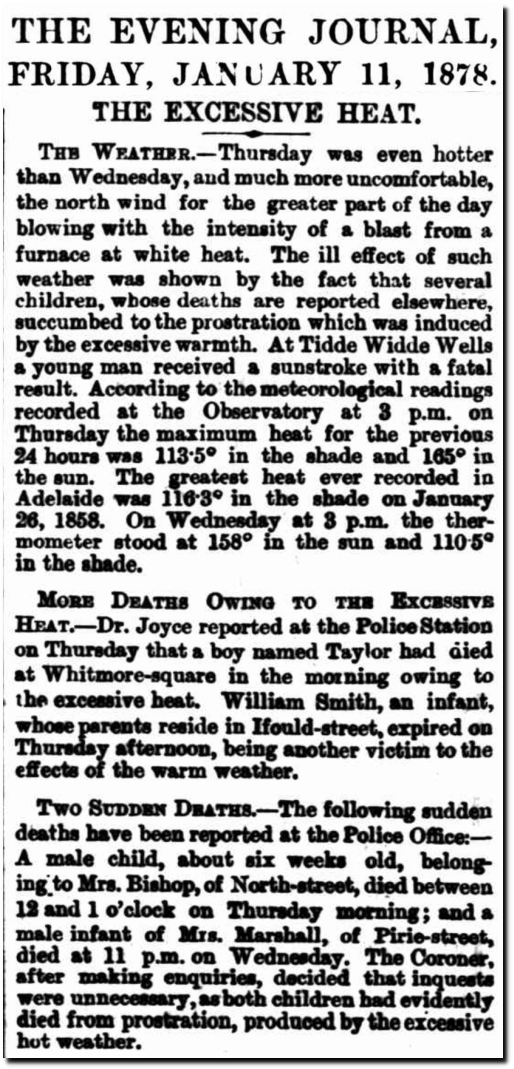
11 Jan 1878 – THE EXCESSIVE HEAT. – Trove
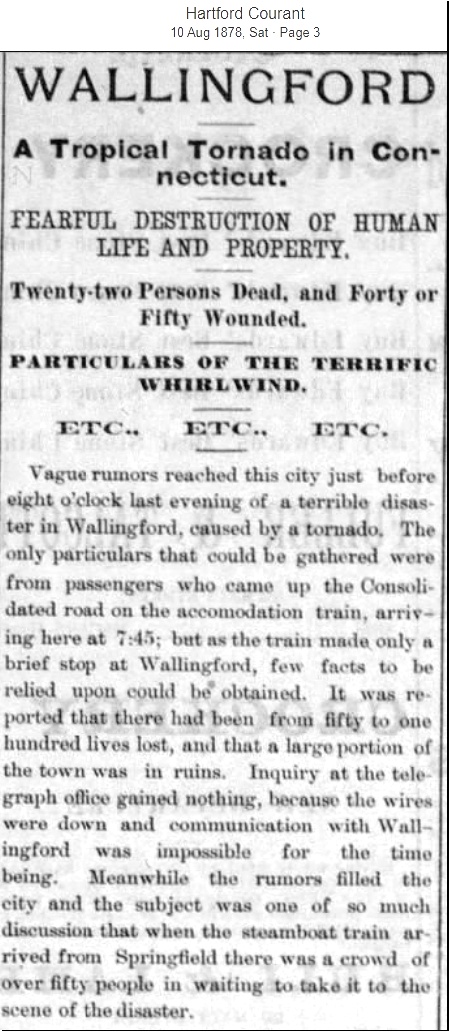
10 Aug 1878, 3 – Hartford Courant at Newspapers.com
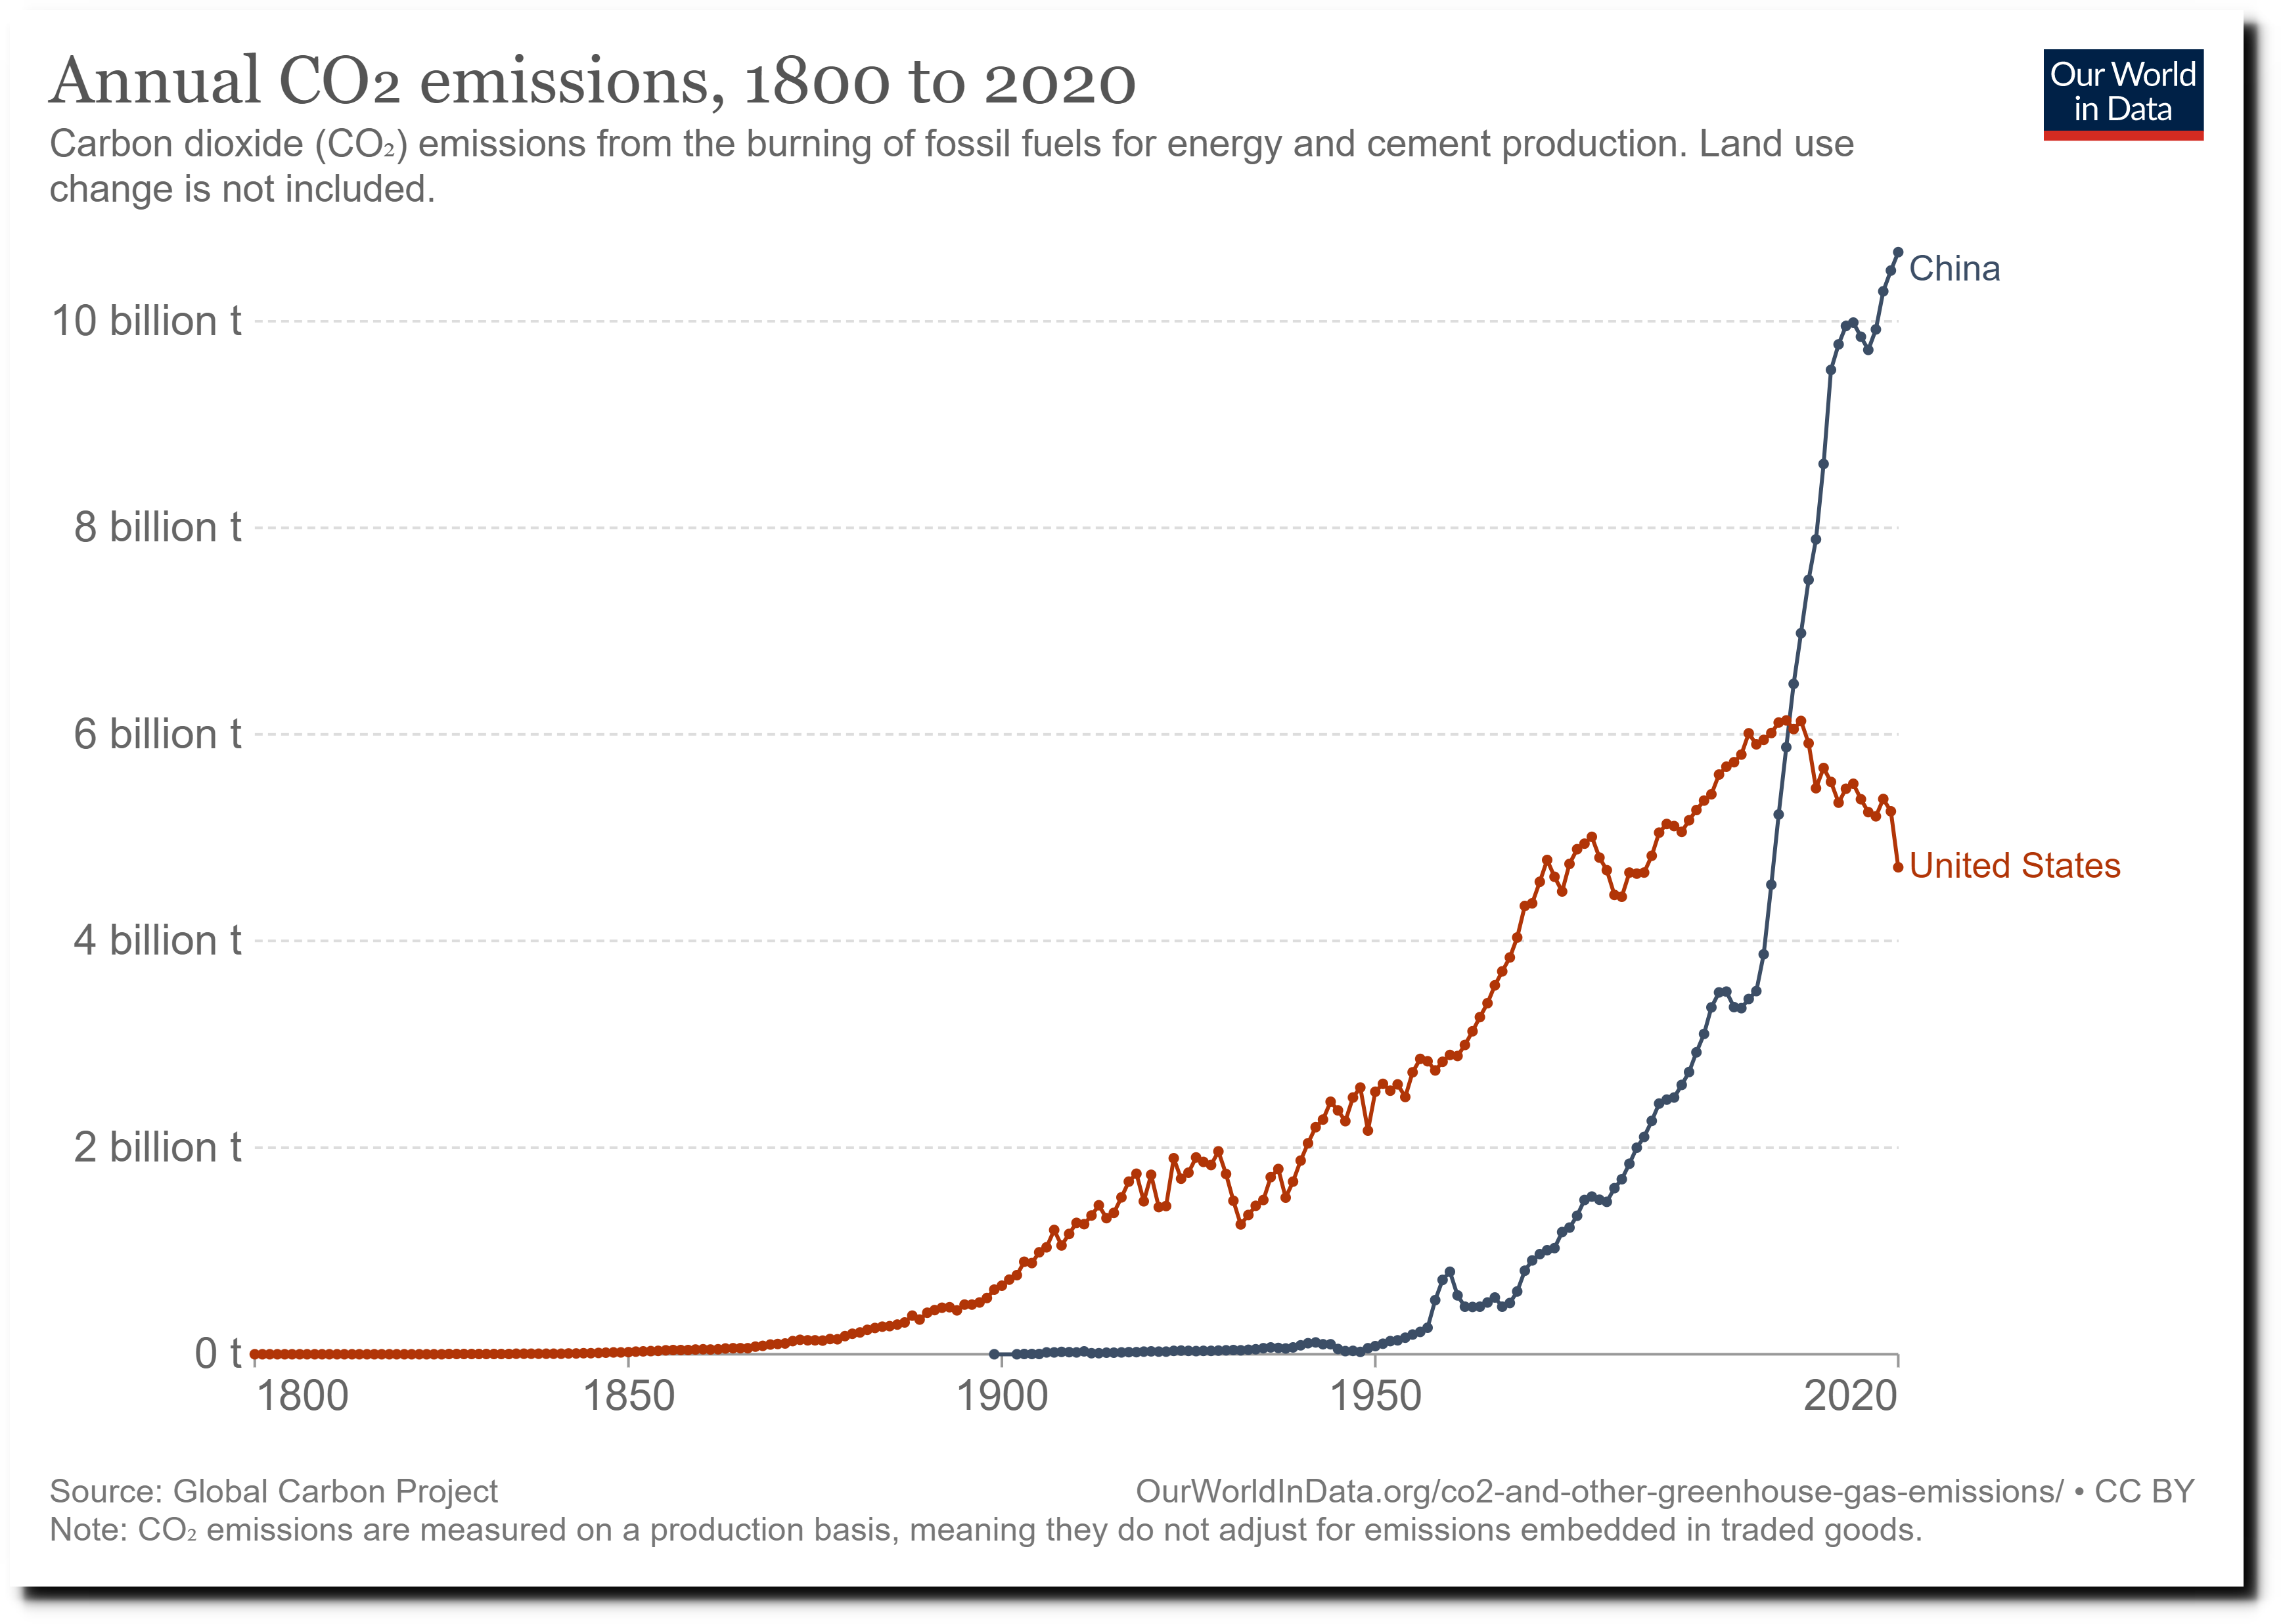
This didn’t suit the agenda of climate alarmists, so Michael Mann is now trying to erase the AMO.
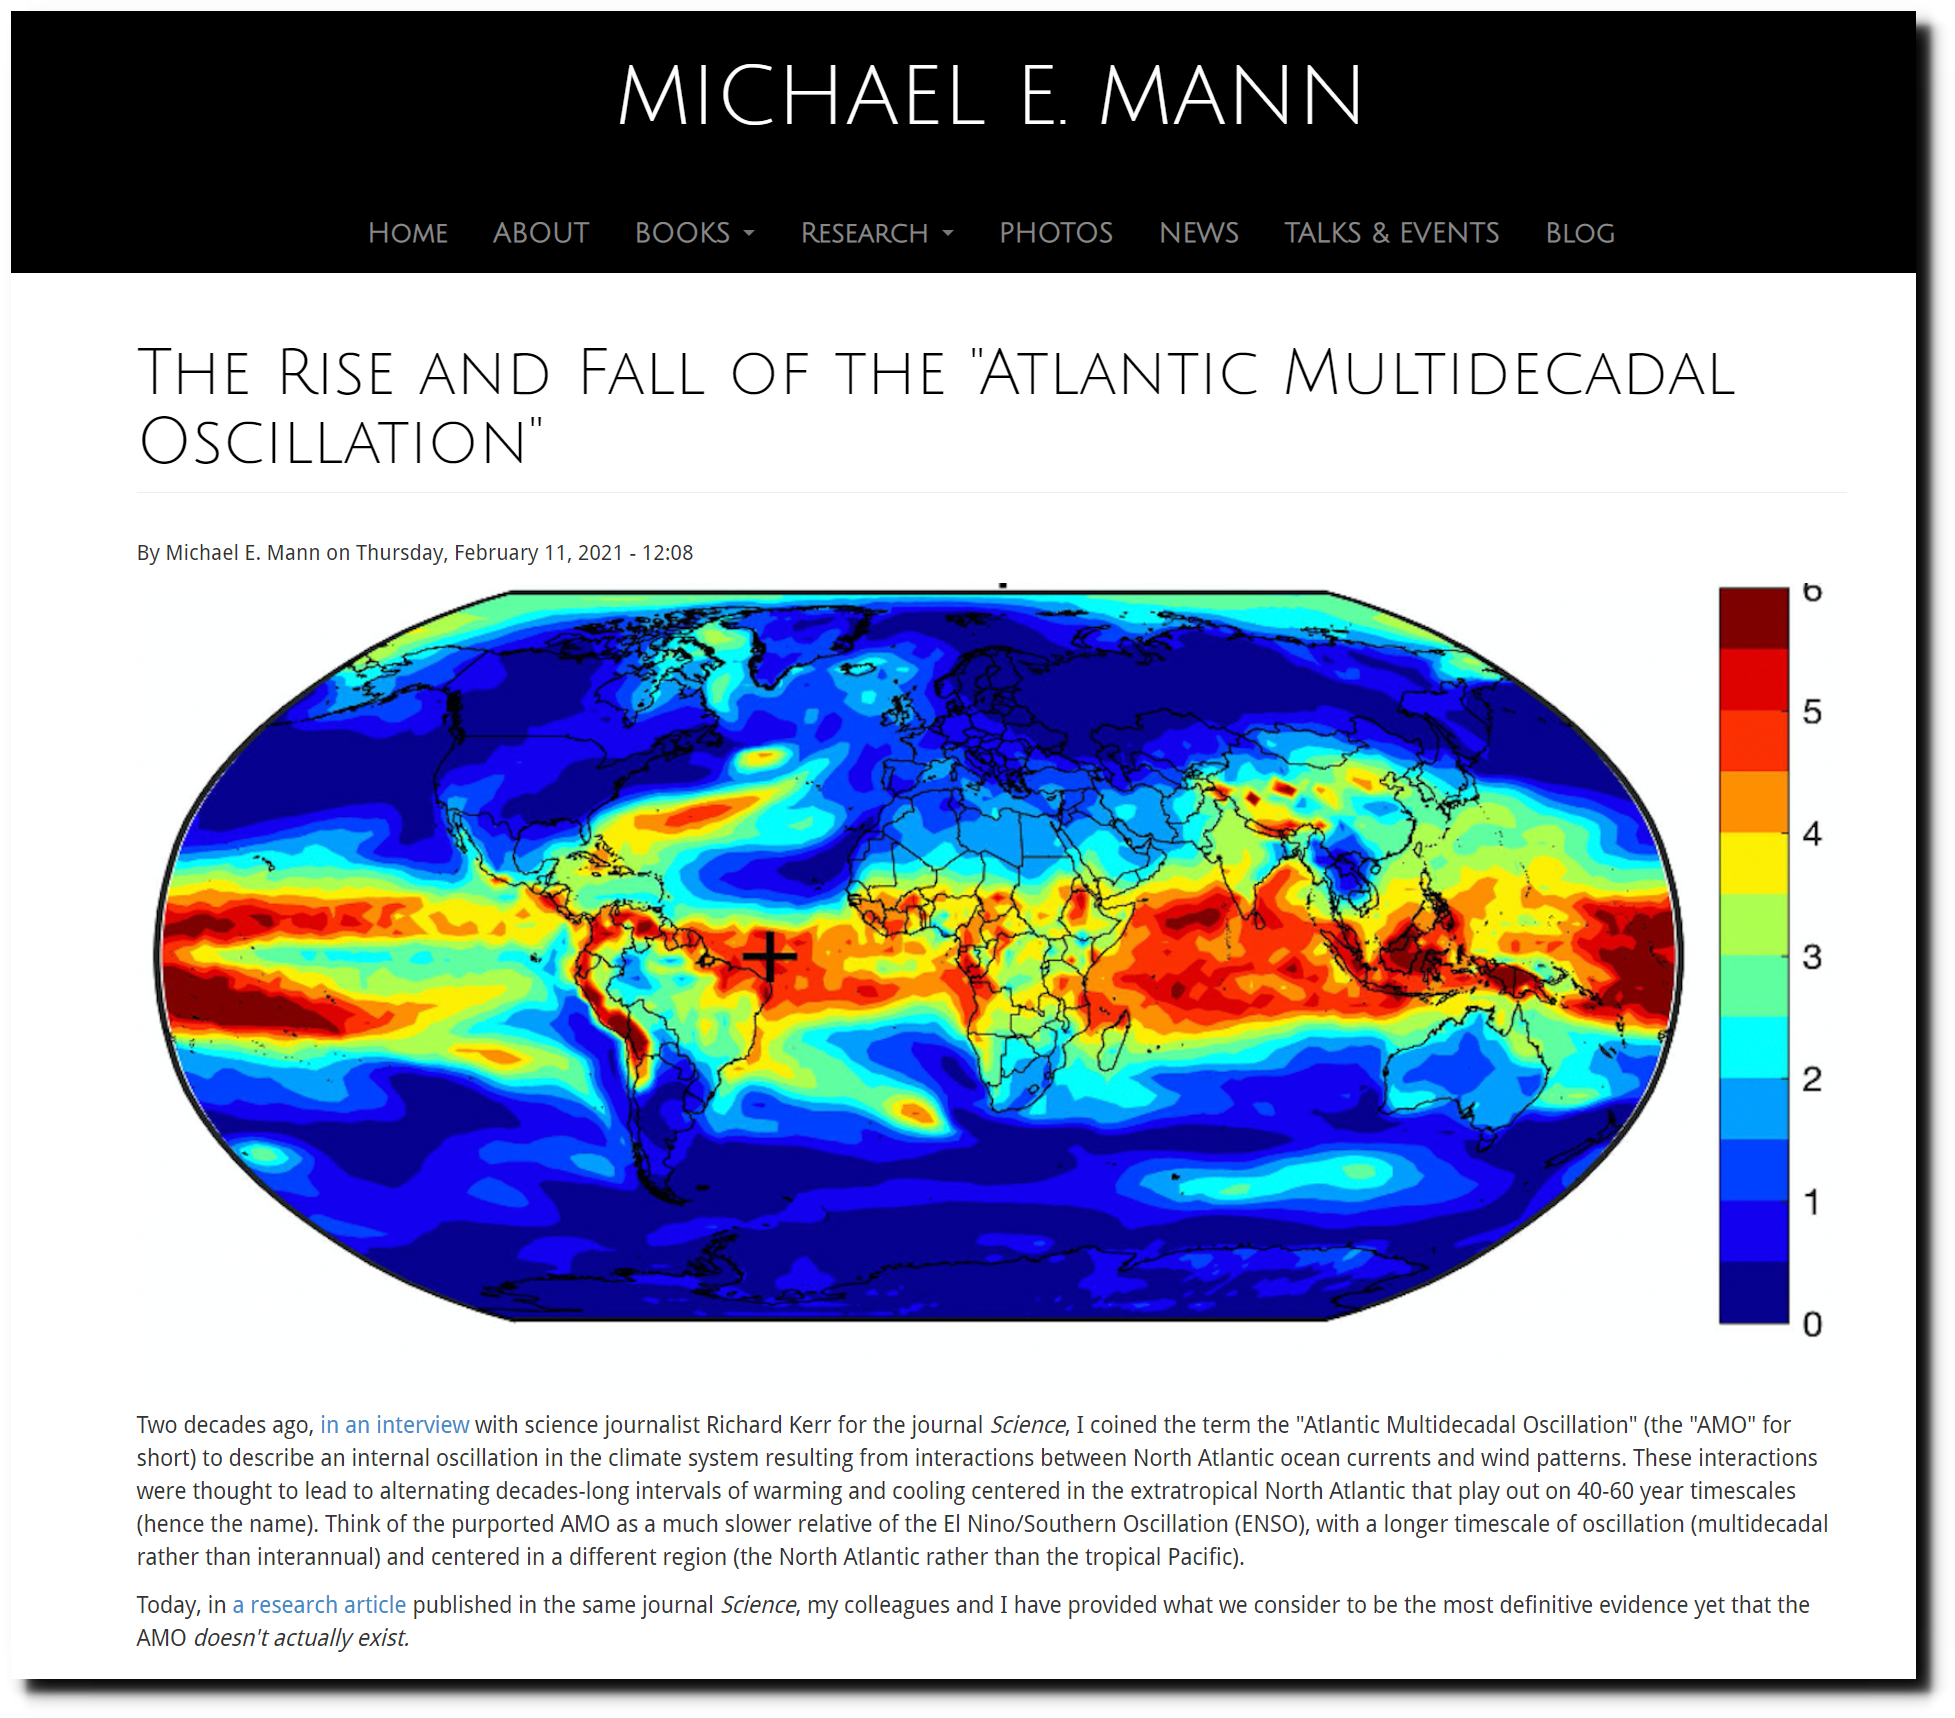
The Rise and Fall of the “Atlantic Multidecadal Oscillation” | MICHAEL E. MANN
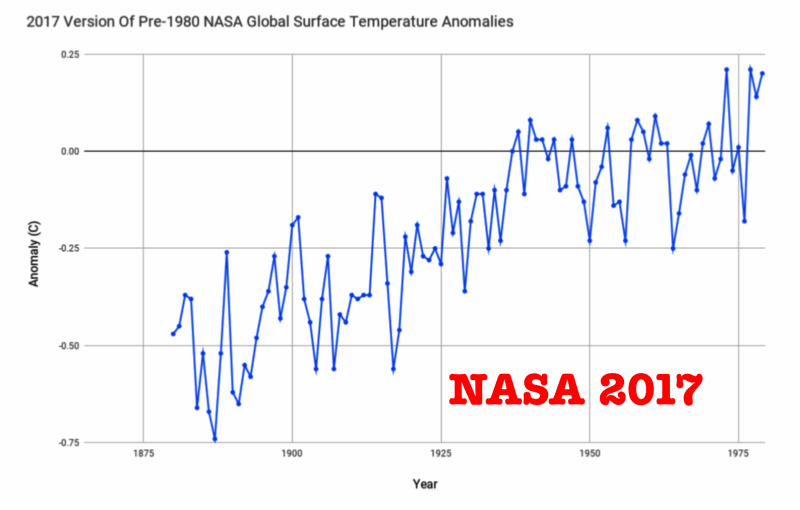
NASA has also erased 1878.
As of the year 2000, NASA showed no net warming from 1870 to 1979, with 1878 being the warmest year.
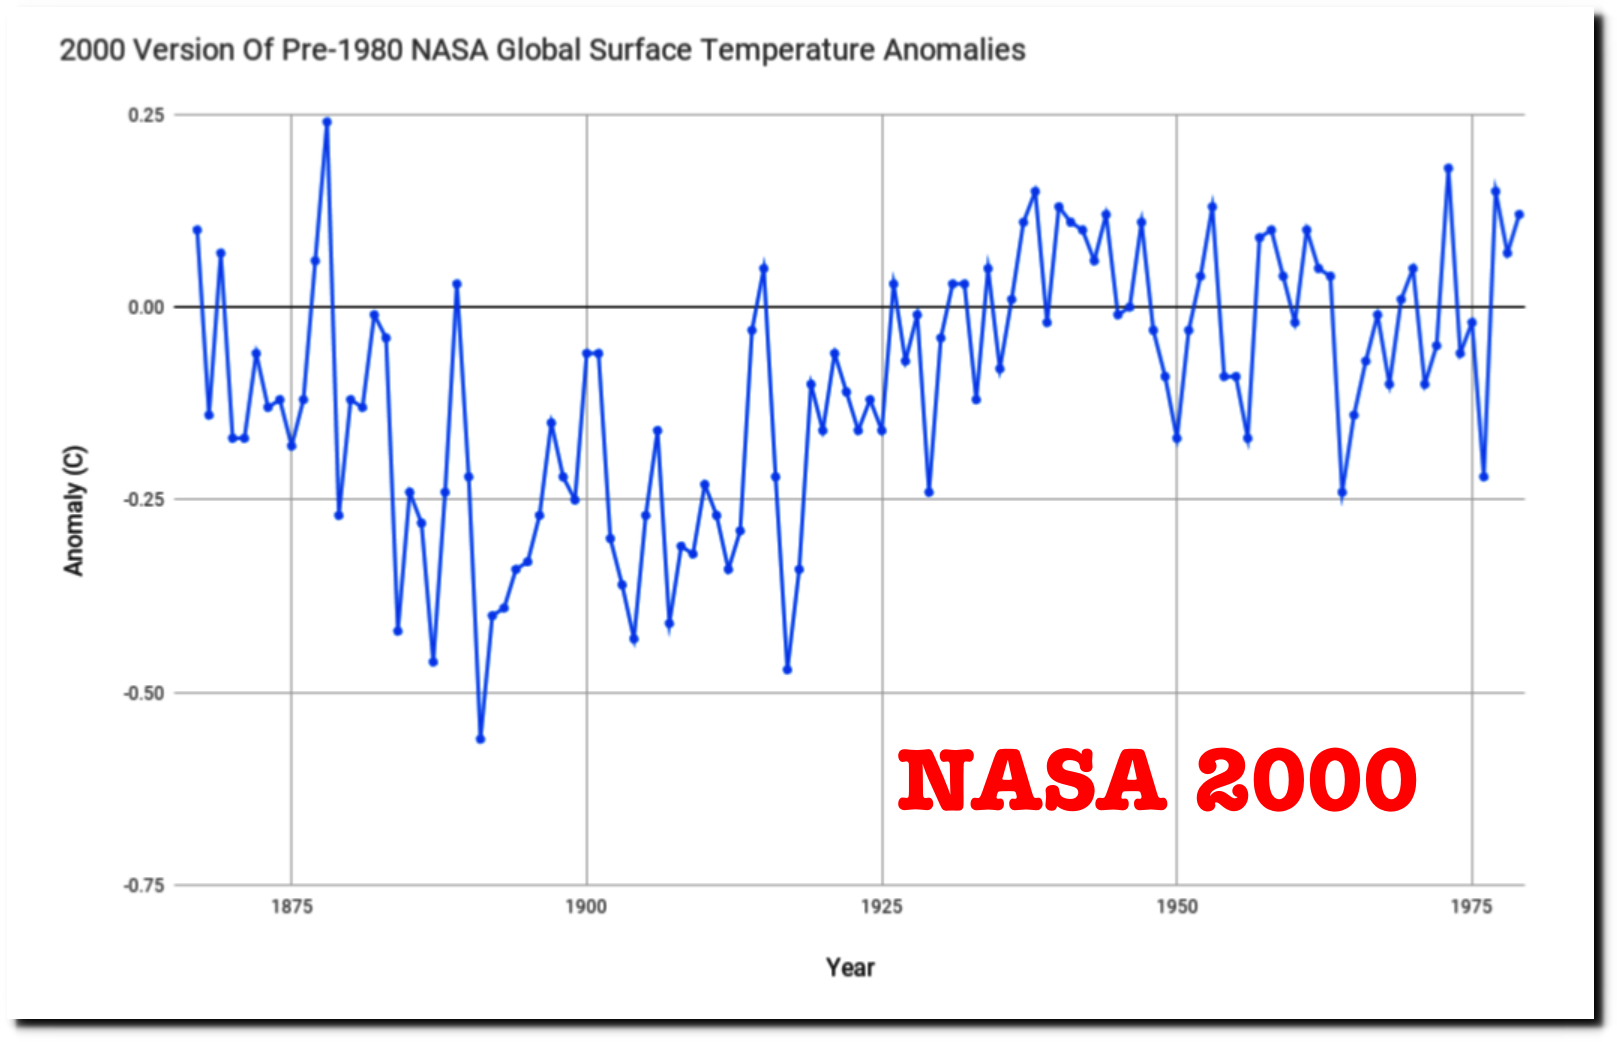
But they now hide data before 1880, and show about 0.7C warming prior to 1980
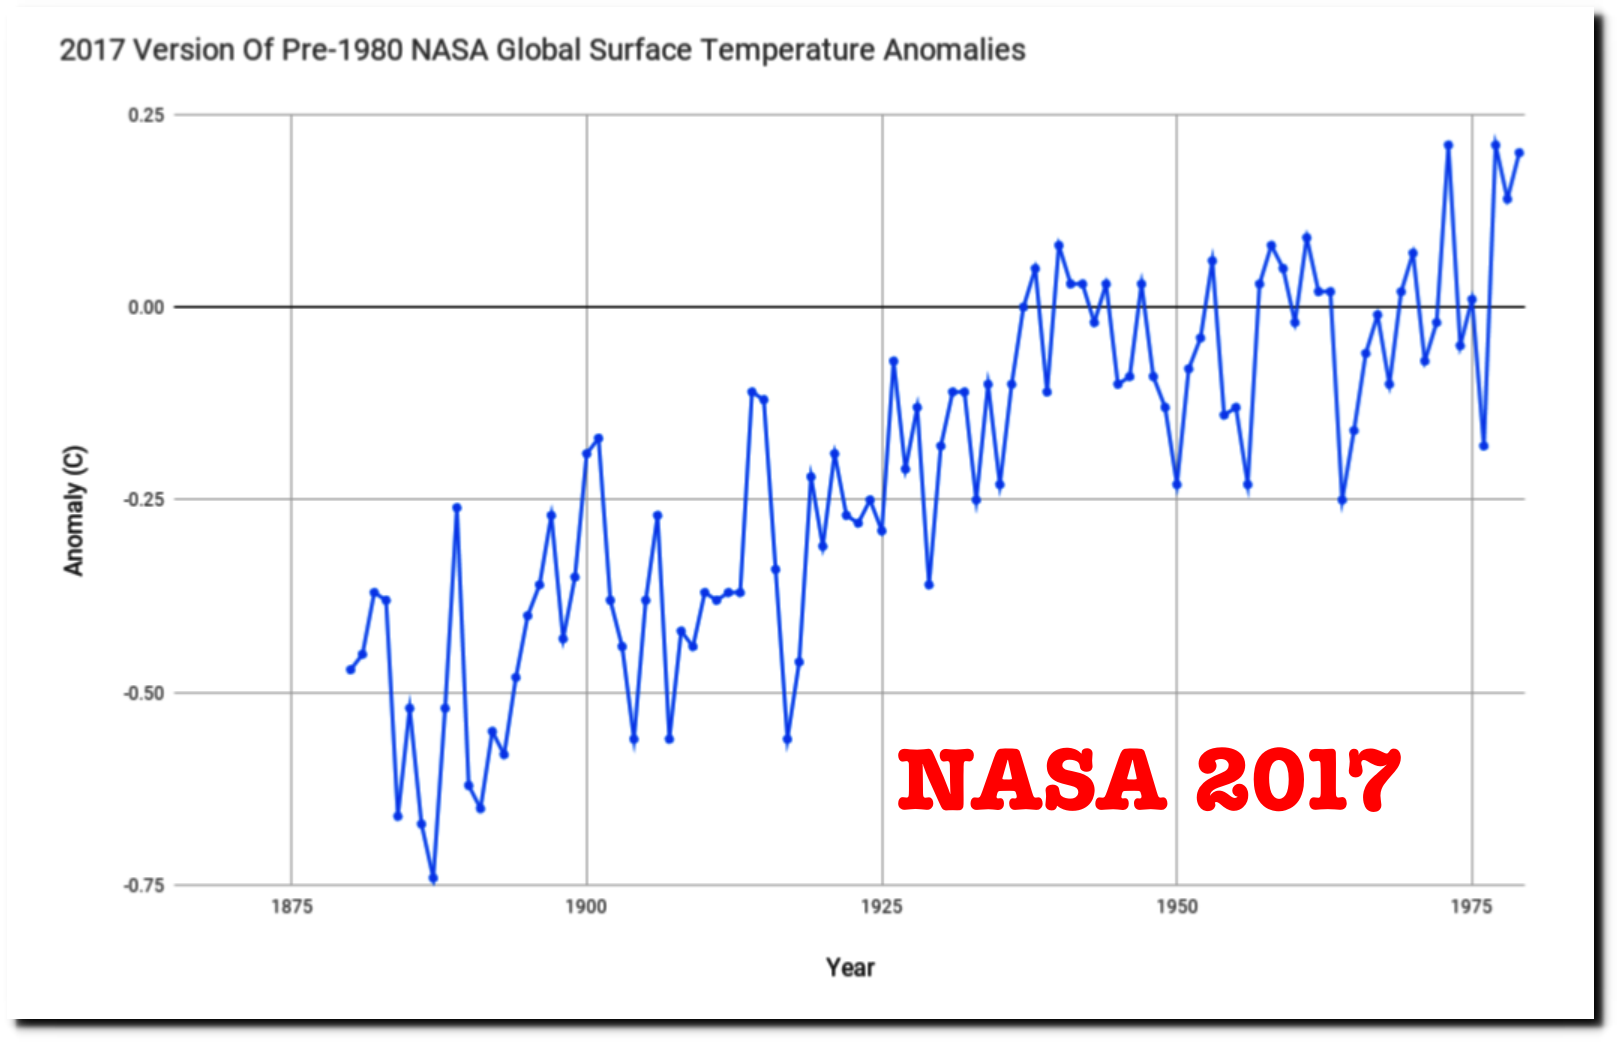
https://data.giss.nasa.gov/gistemp/history/output/met_used.zip
This animation shows how they have altered the data