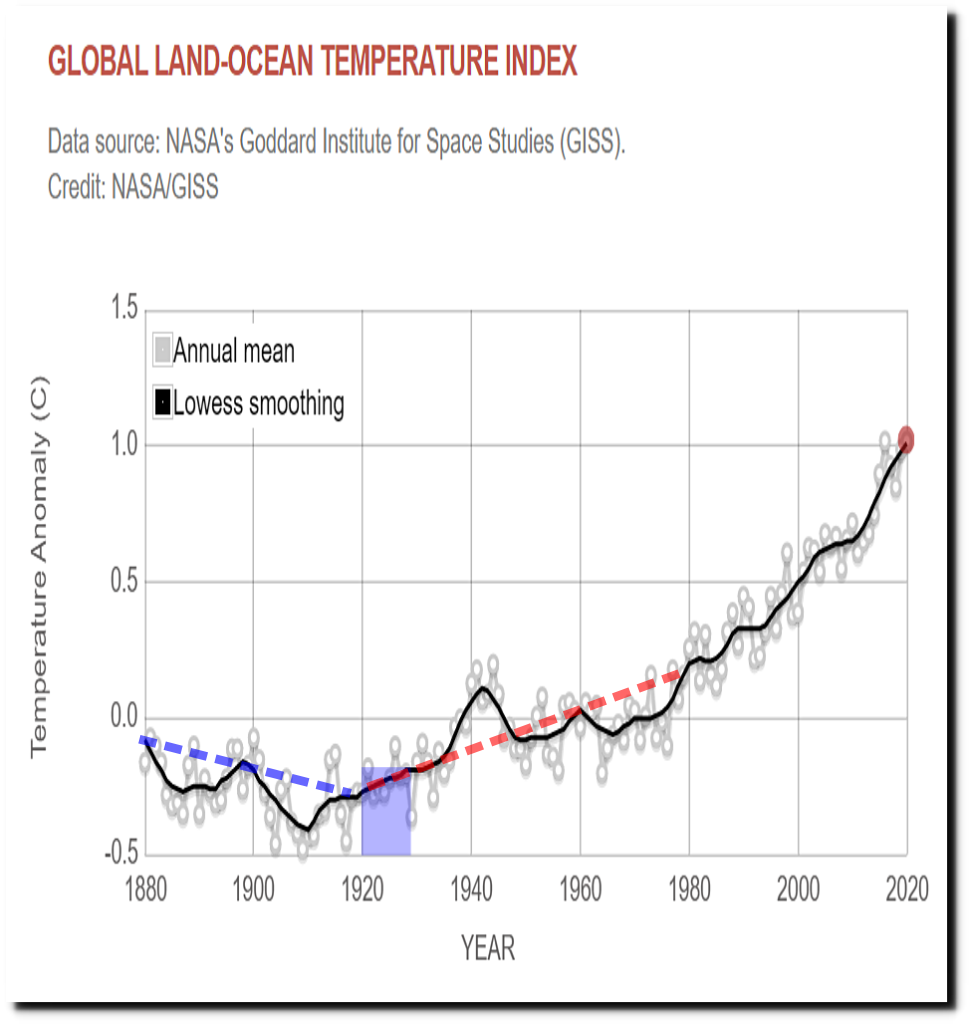
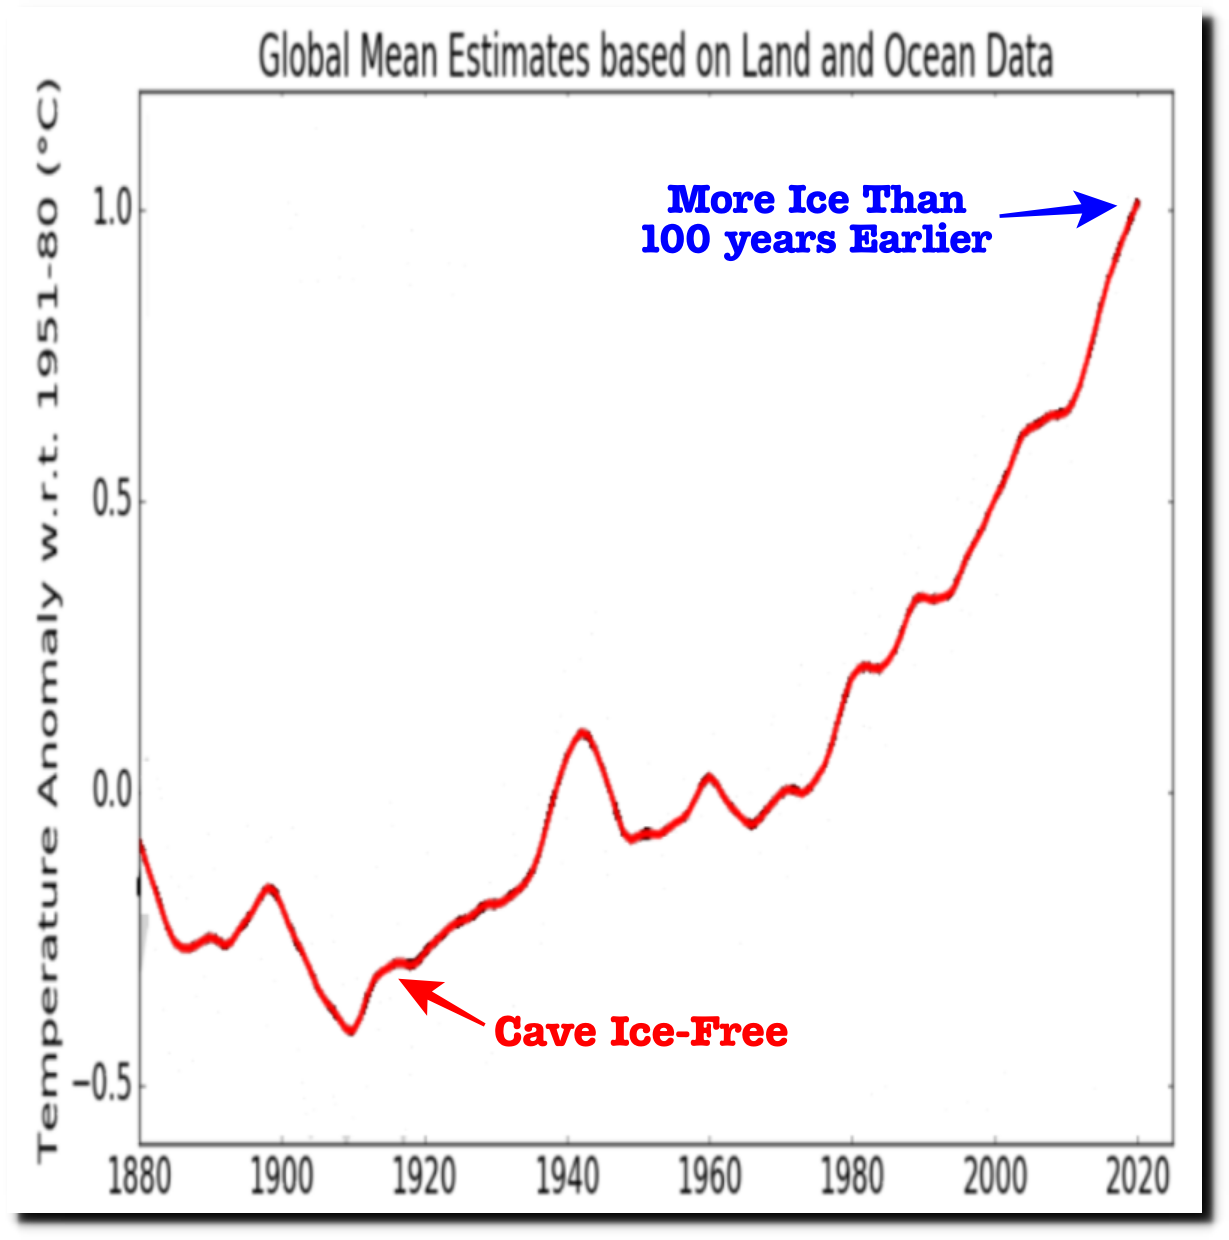
NASA says facts and scientific consensus show earth has warmed 1C since 1880. They show the year 1921 as 0.18C below “normal.”
“This research is broadly consistent with similar constructions prepared by the Climatic Research Unit and the National Oceanic and Atmospheric Administration”
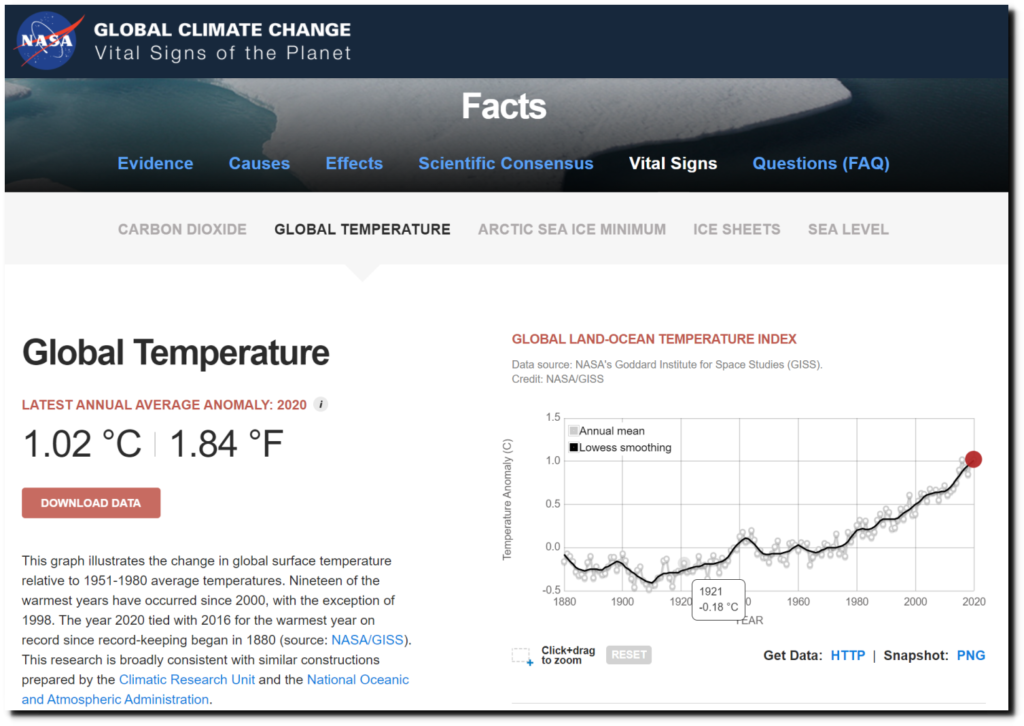
NASA shows the 1920s as one of the coldest decades, that earth cooled from 1881 to 1919 and that earth warmed about 0.4C from 1921 to 1979.
Global Temperature | Vital Signs – Climate Change: Vital Signs of the Planet
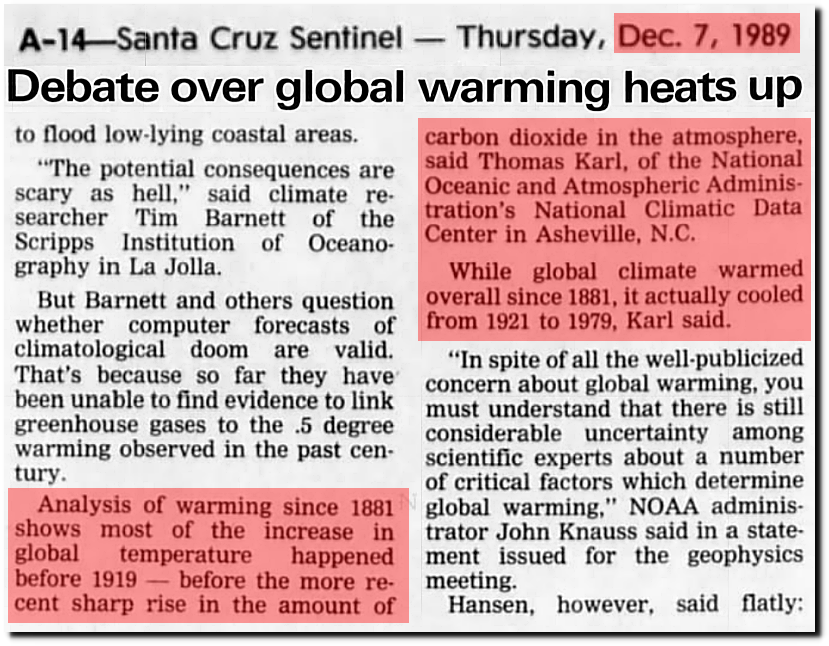
But in 1989, NOAA said the exact opposite.
“Analysis of warming since 1881 shows most of the increase in global temperature happened before 1919 — before the more re-cent sharp rise in the amount of carbon dioxide in the atmosphere. said Thomas Karl, of the National Oceanic and Atmospheric Administration’s National Climatic Data Center in Asheville, N.C. While global climate warmed overall since 1881, It actually cooled from 1921 to 1979, Karl said.”
07 Dec 1989, Page 14 – Santa Cruz Sentinel at Newspapers.com
This map from NOAA shows where they have daily temperature data from 1920. The vast majority is from the US, with some coverage in Europe, Canada and parts of Australia. Most of the world has little or no daily temperature coverage going back 100 years.
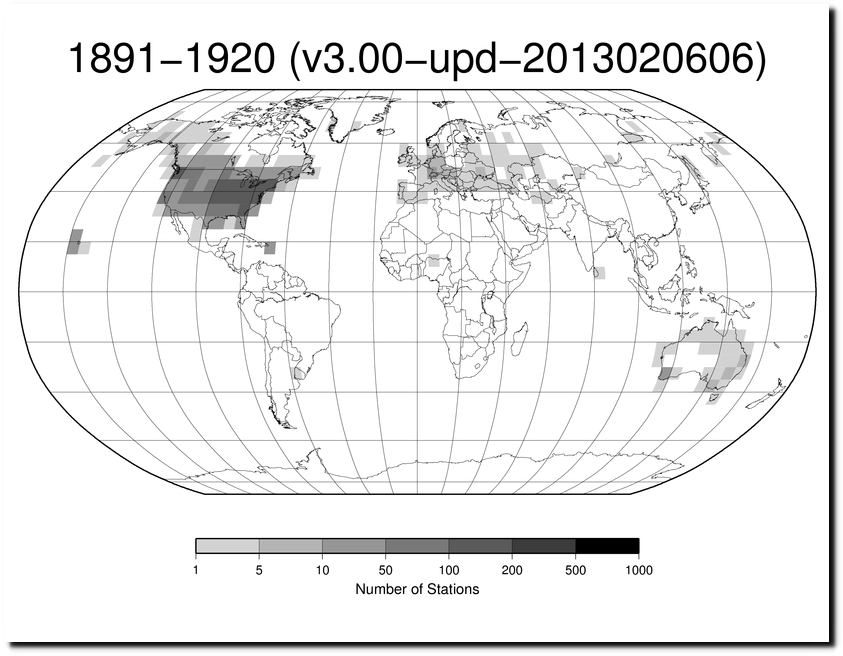
station-counts-1891-1920-temp.png
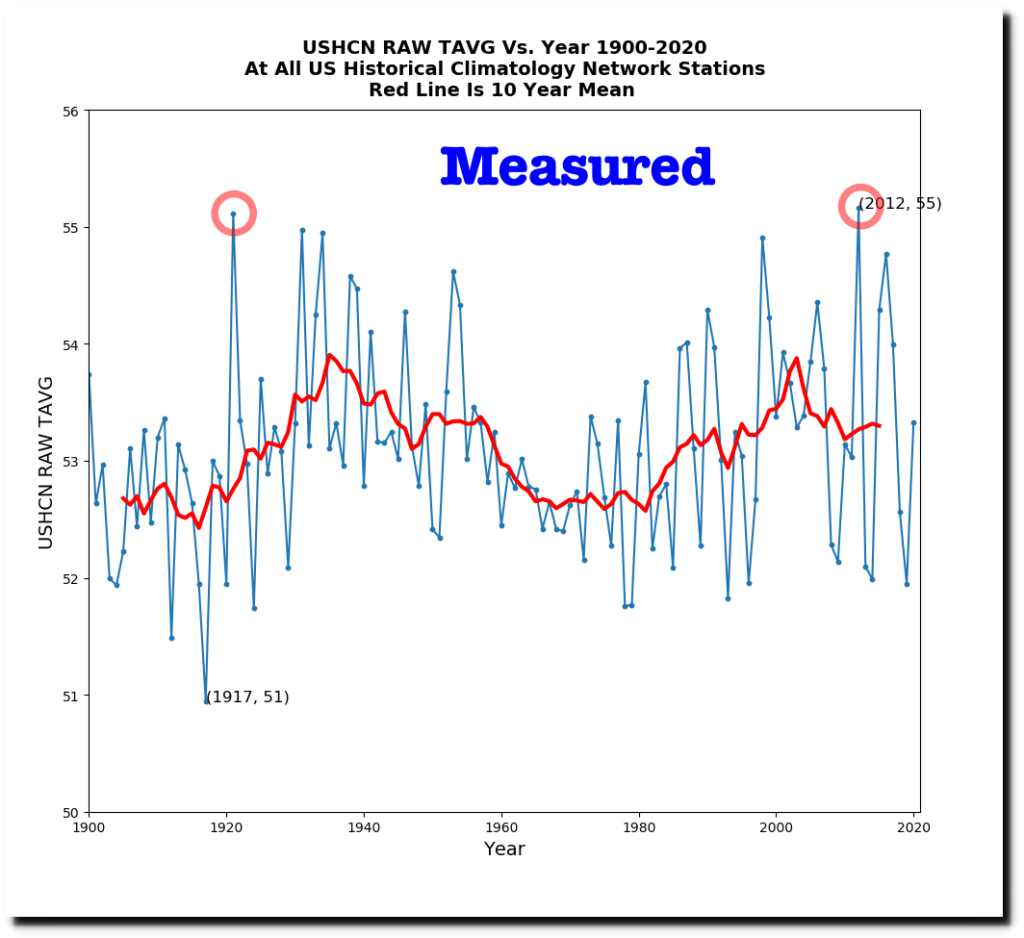
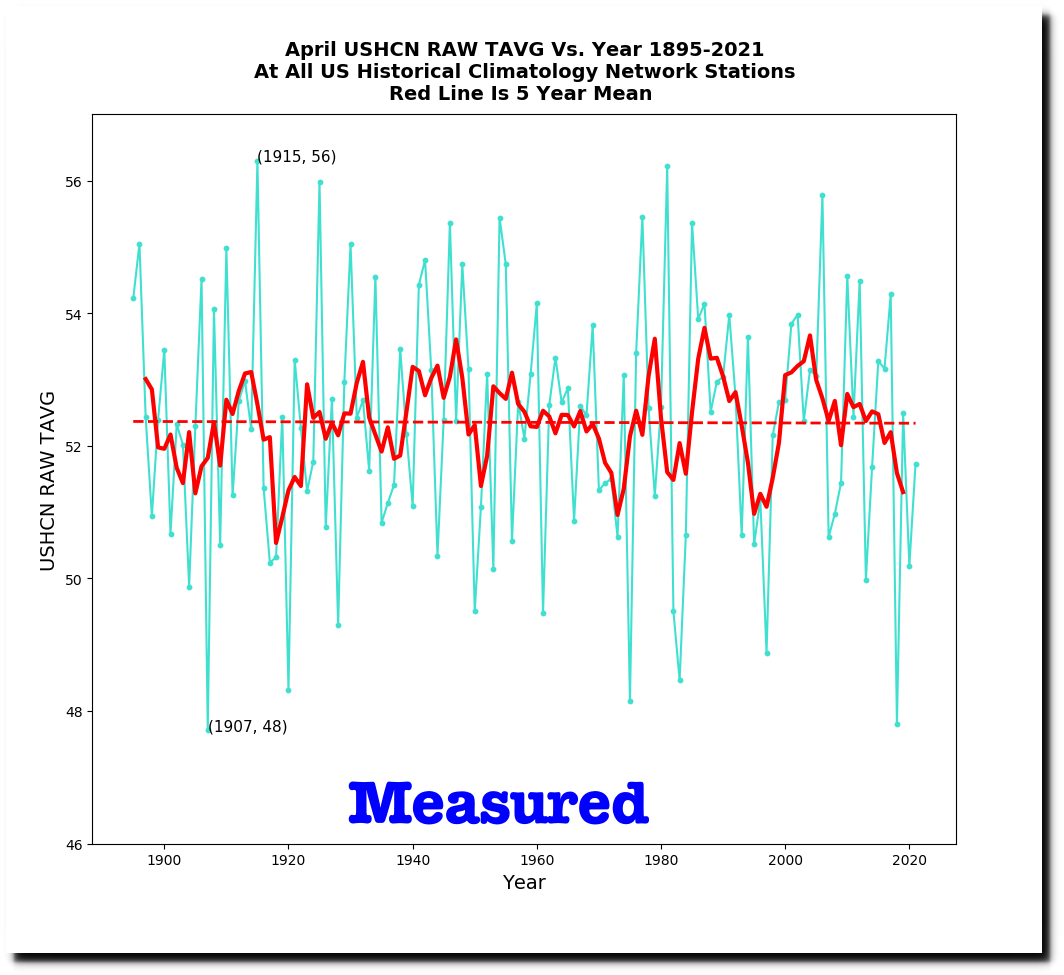
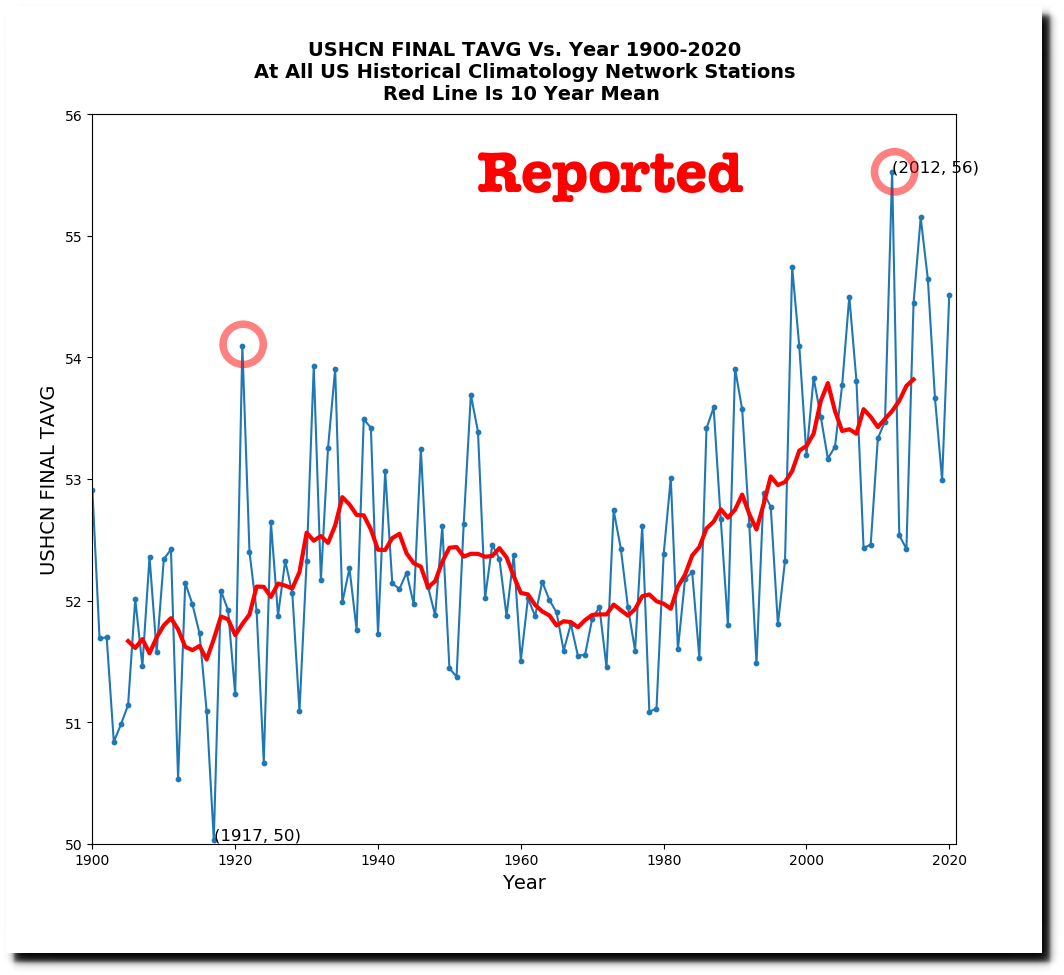
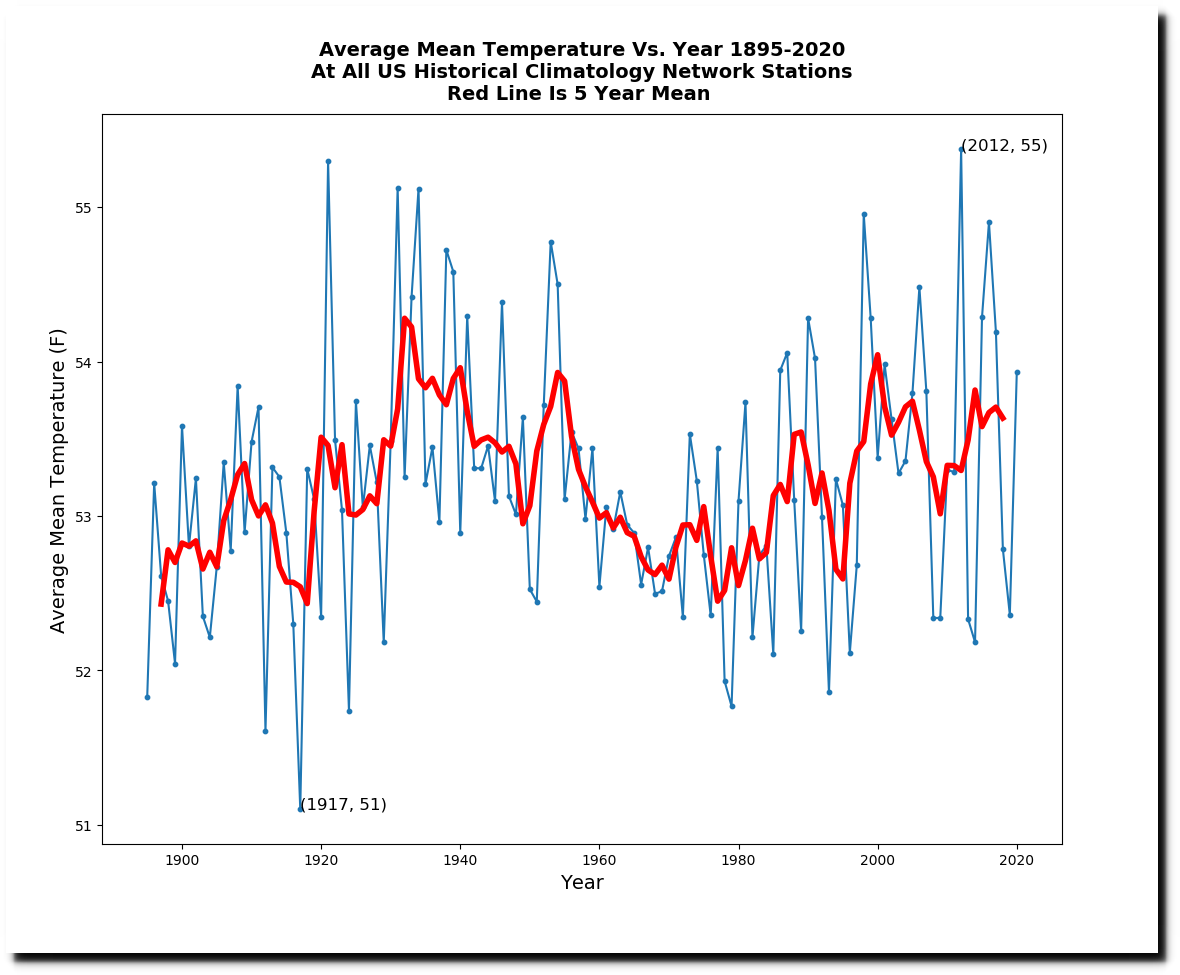
This makes the US temperature data very important. NOAA thermometer data shows 1921 tied with 2012 for the warmest average temperature on record, and that there has been no net warming over the past century.
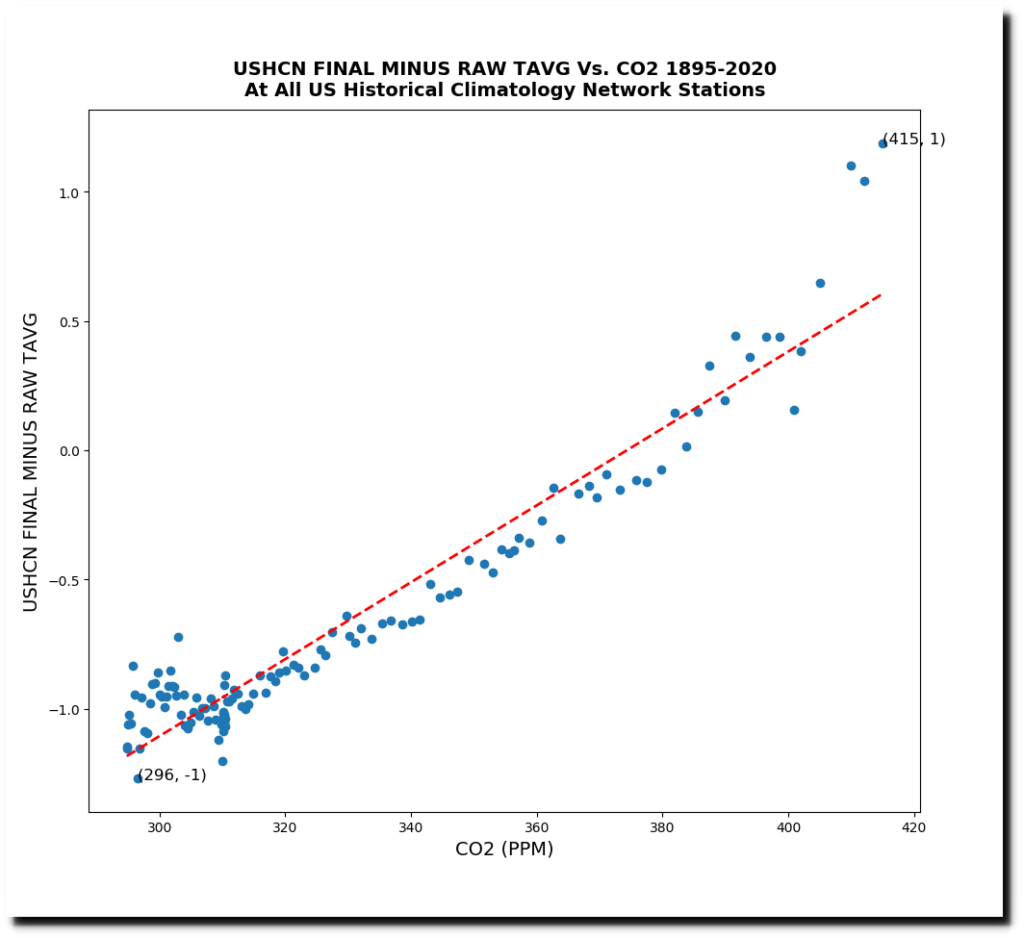
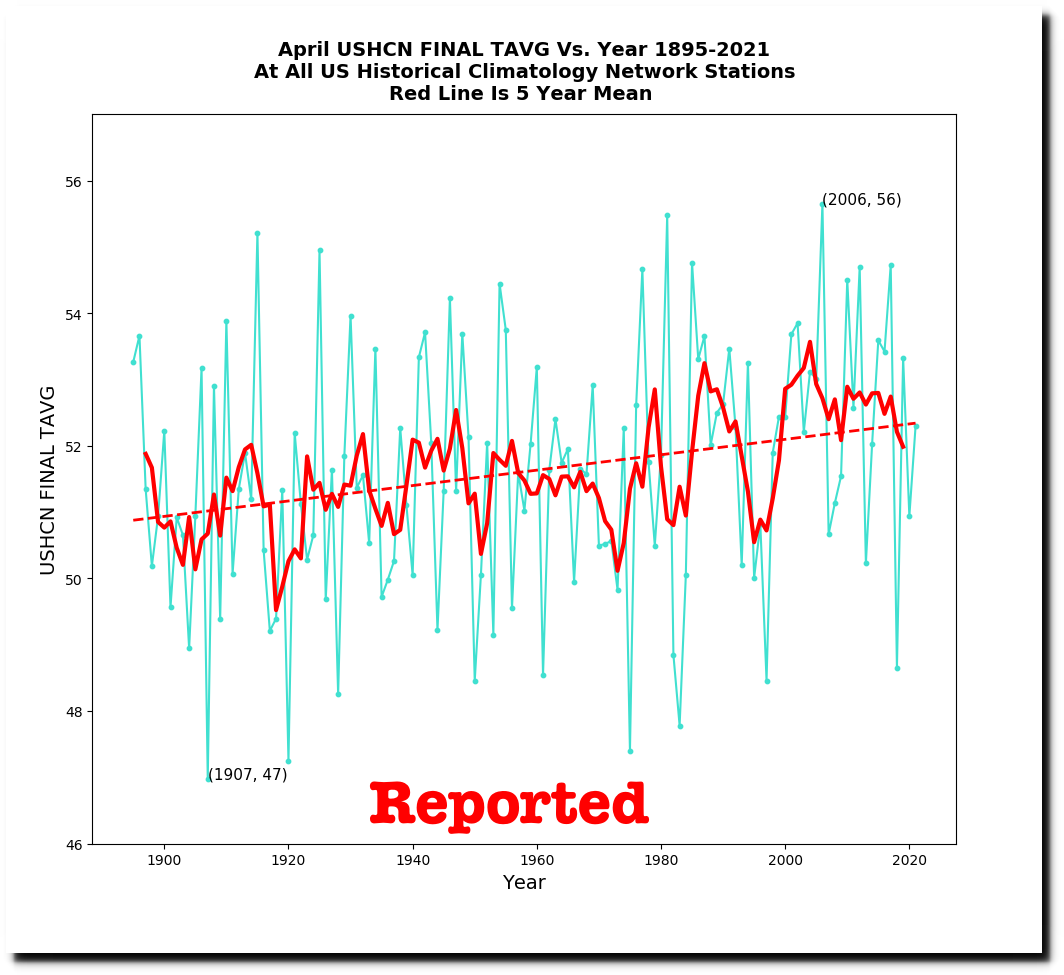
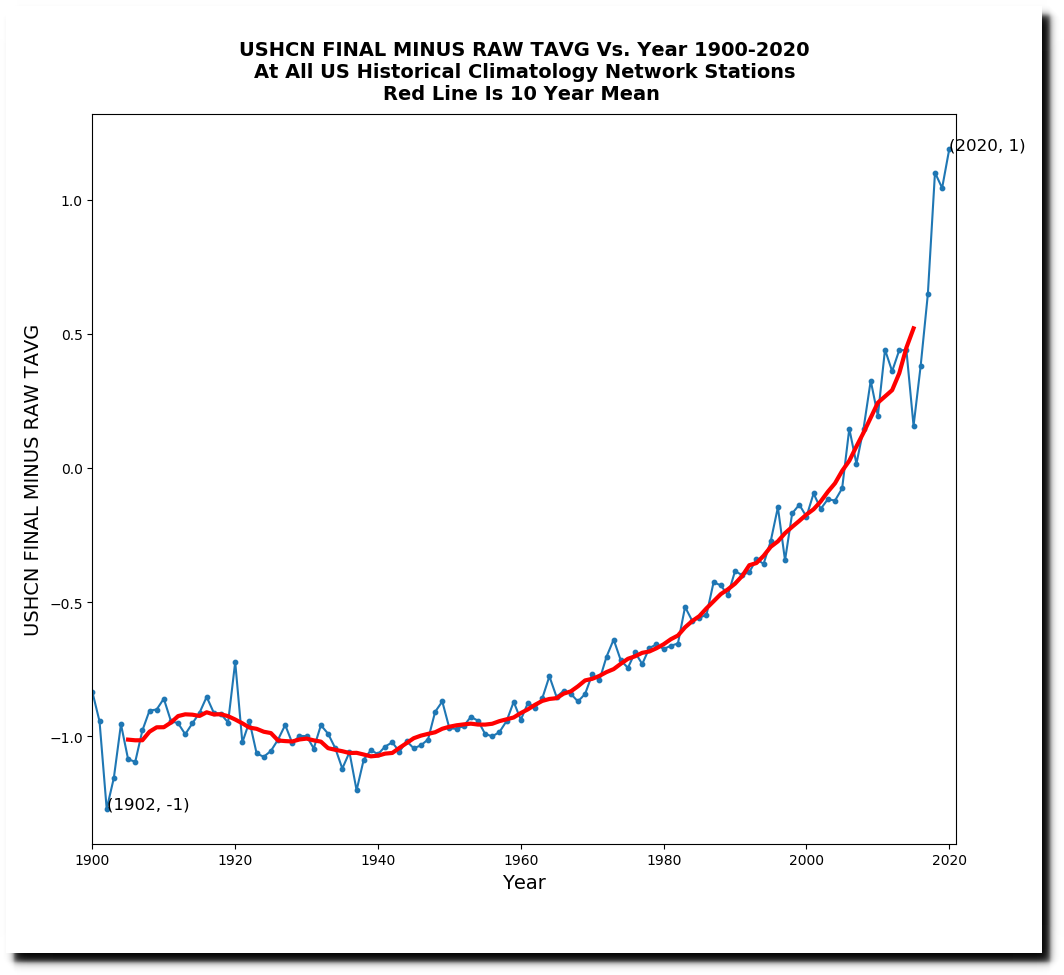
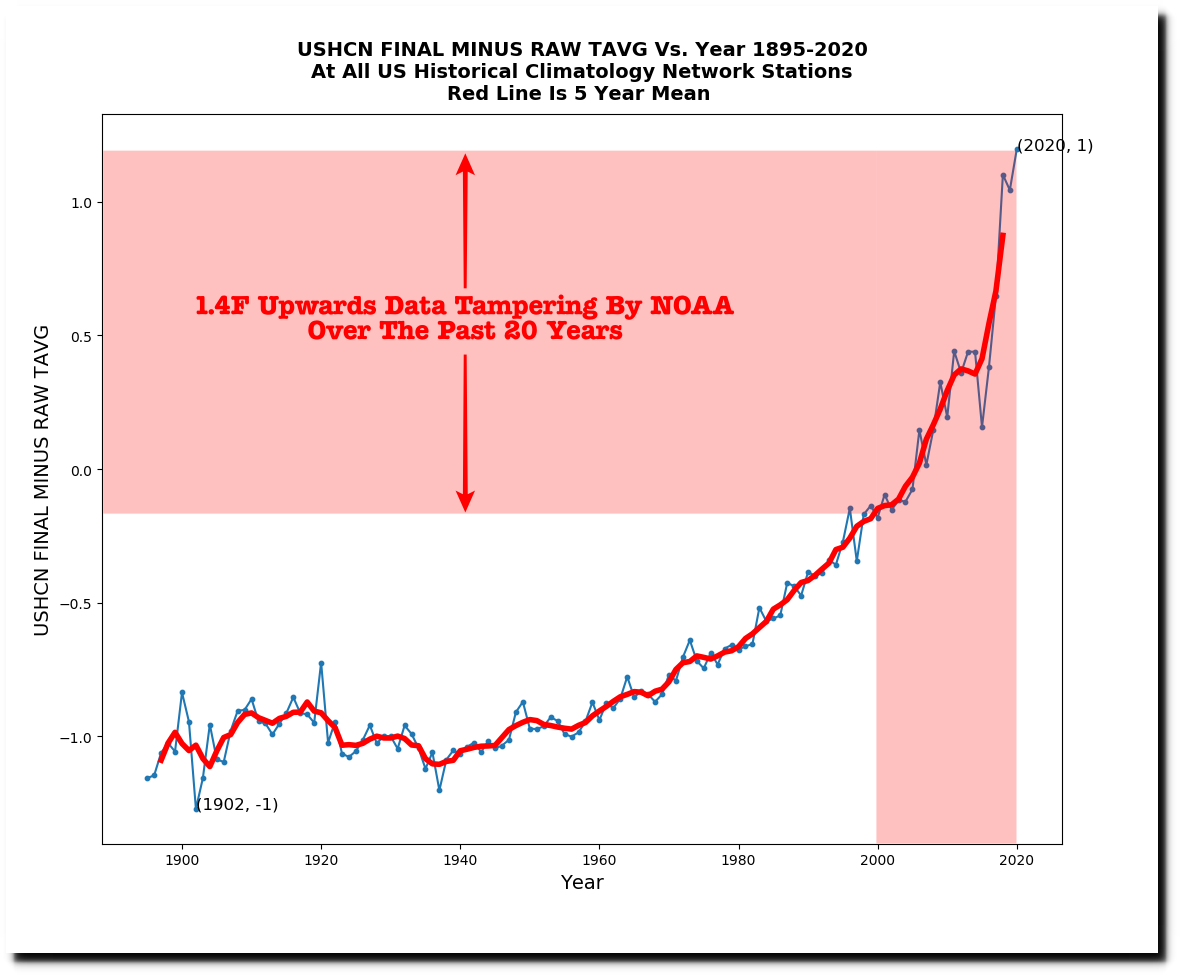
But NOAA massively tampers with the data to cool the past and warm the present. All claimed US warming over the past century is due to data tampering.

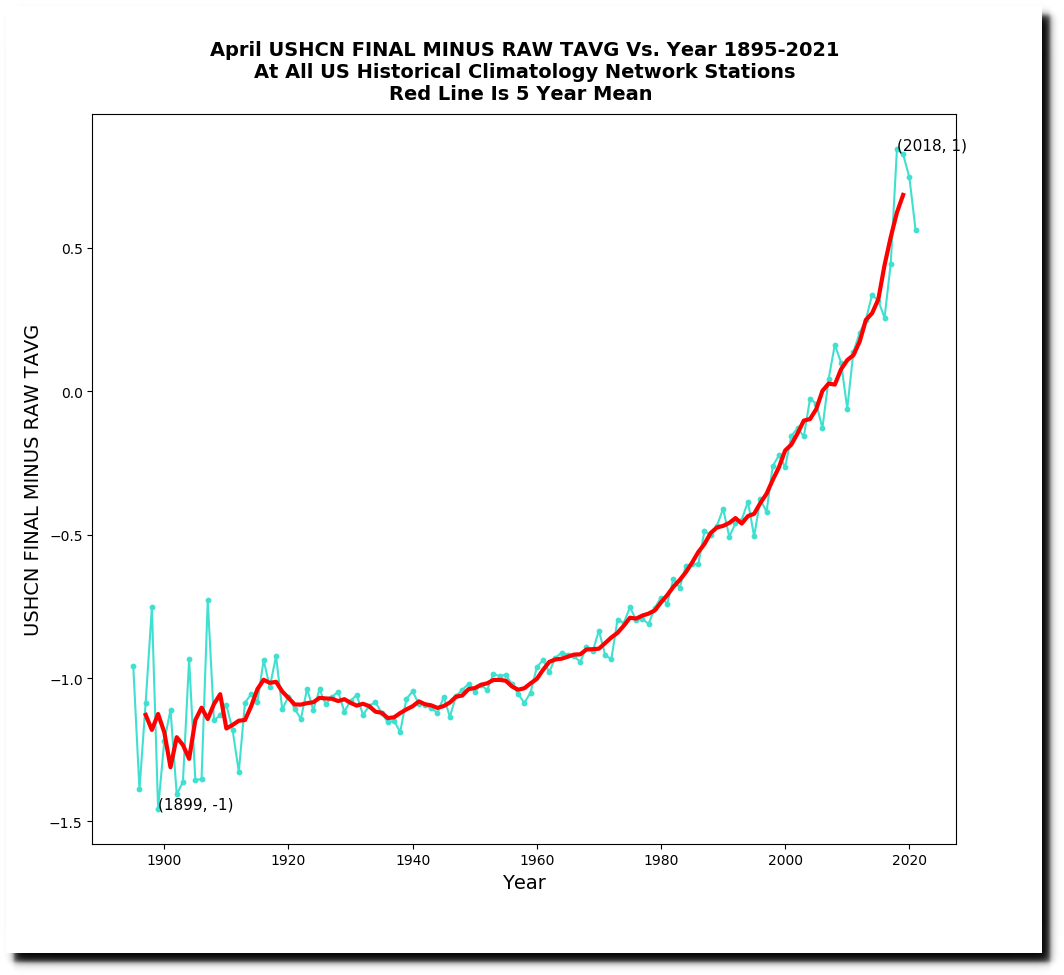
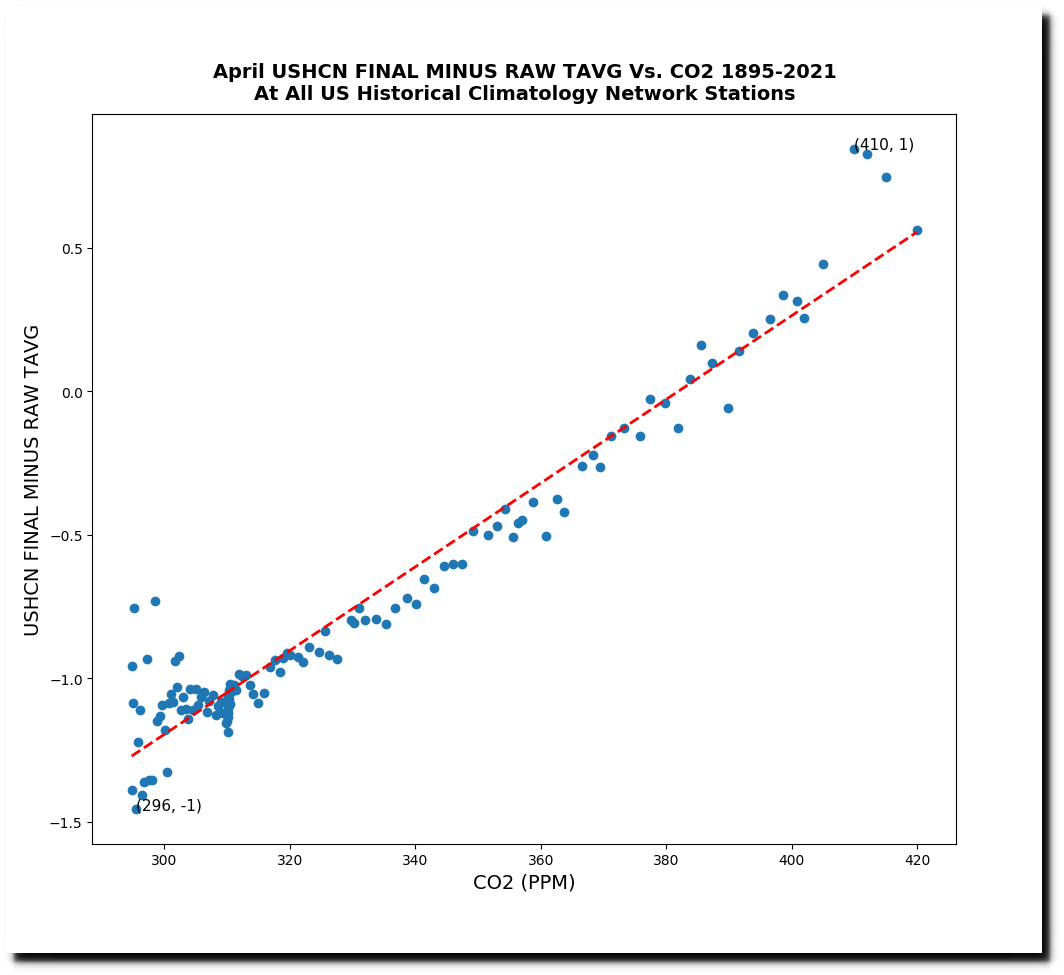
The data tampering is done in a hickey stick which cools past temperatures by 1F and warms recent temperatures by more than 1F

The tampering is done to closely align with the increase in atmospheric CO2 – i.e. data is being altered to match the theory.
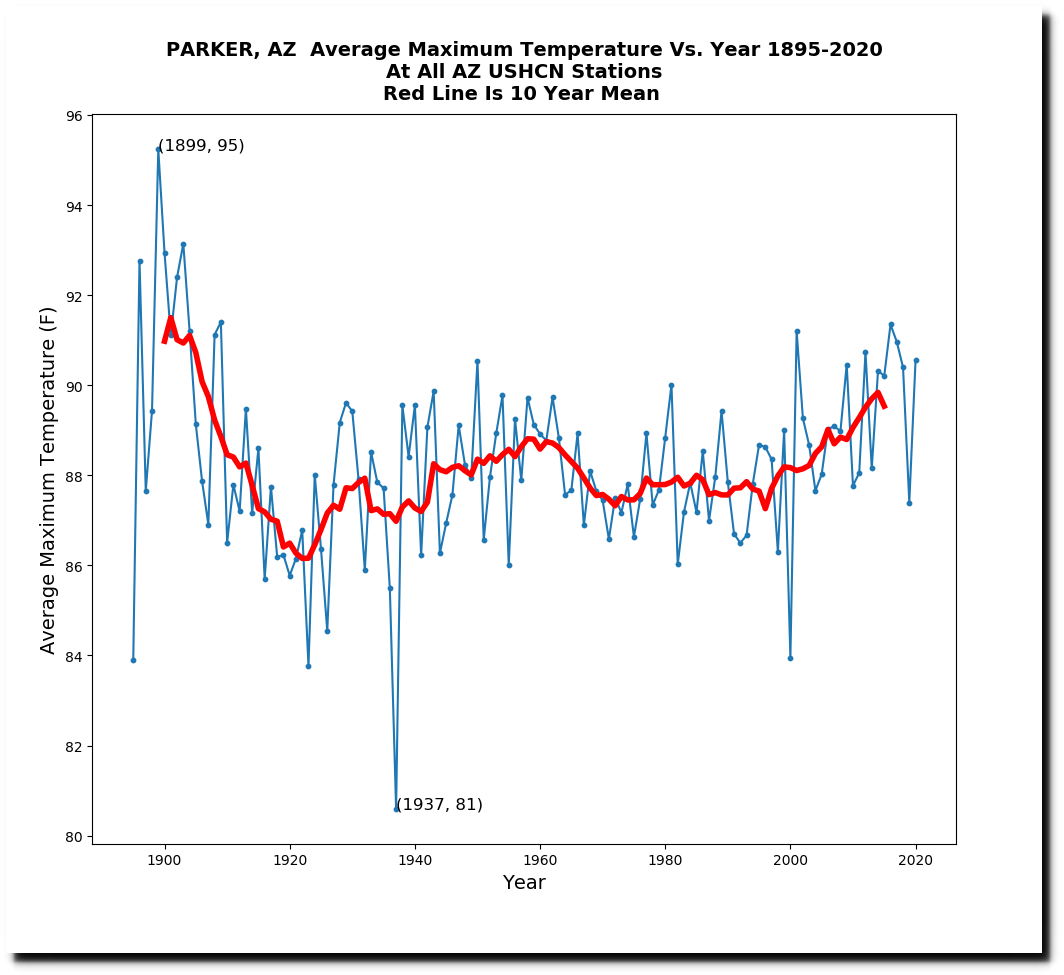
NASA and NOAA claim that 1921 was a very cold year, but it had the second highest average maximum temperature in the US.
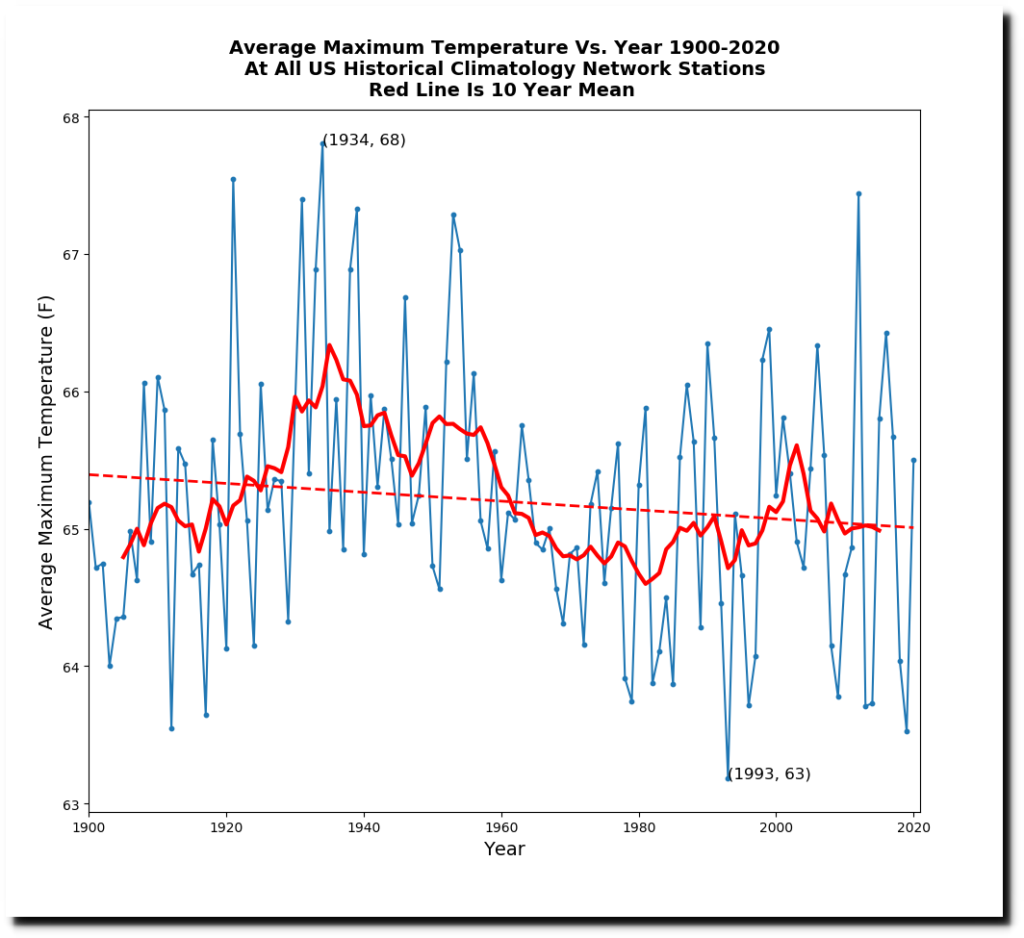
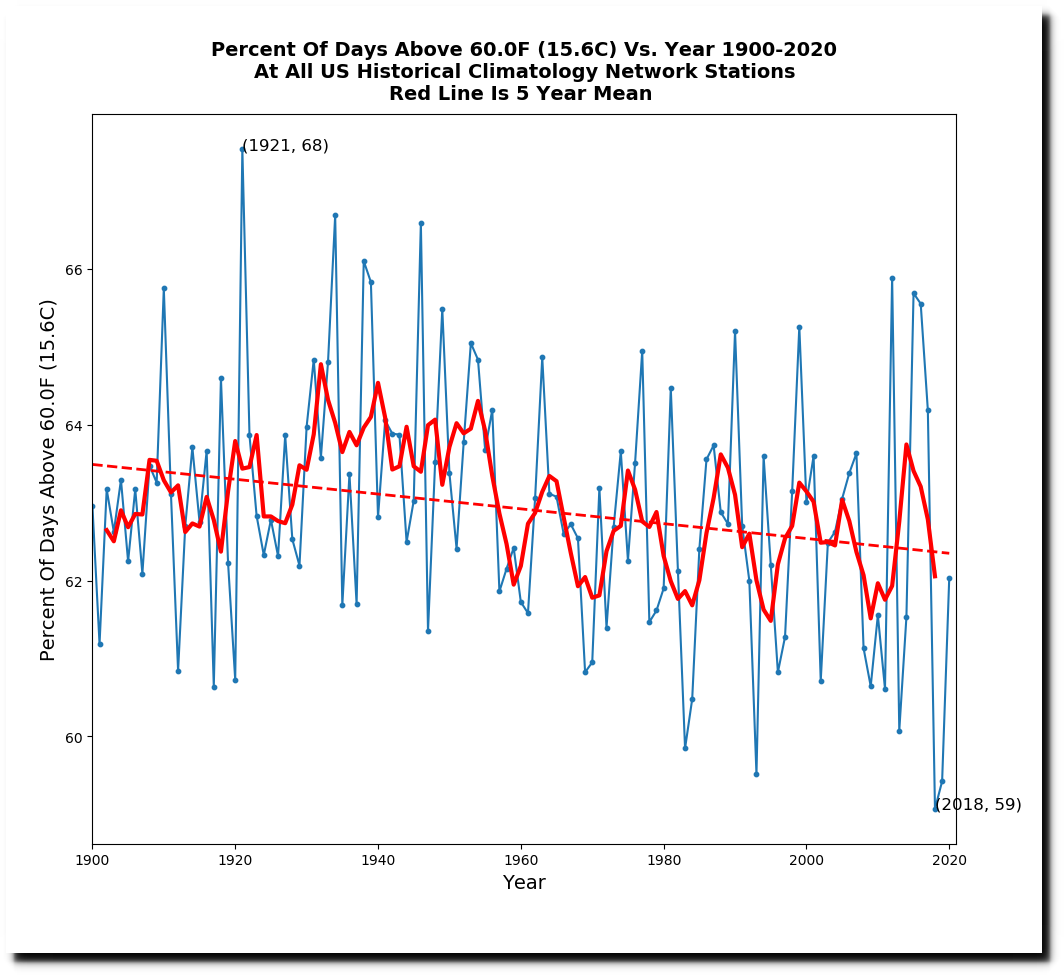
The percent of days above 60F during 1921 was the highest on record in the US by a wide margin.

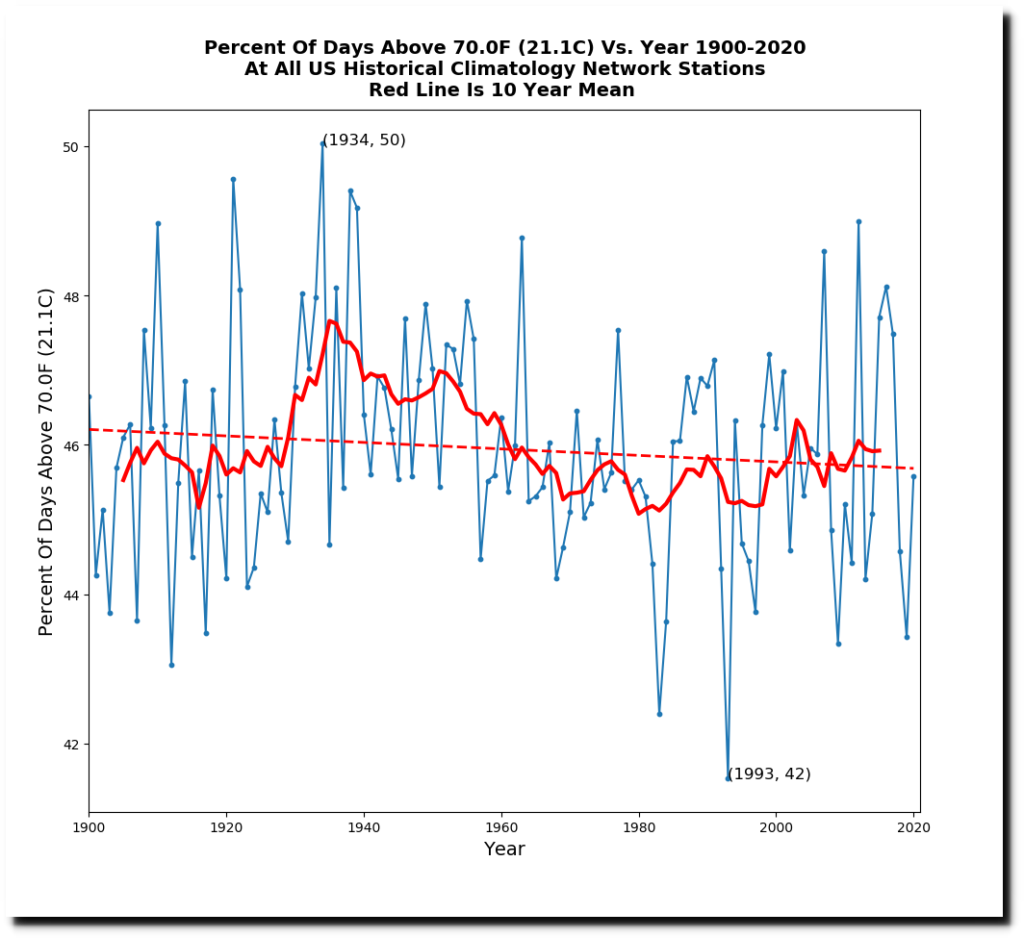
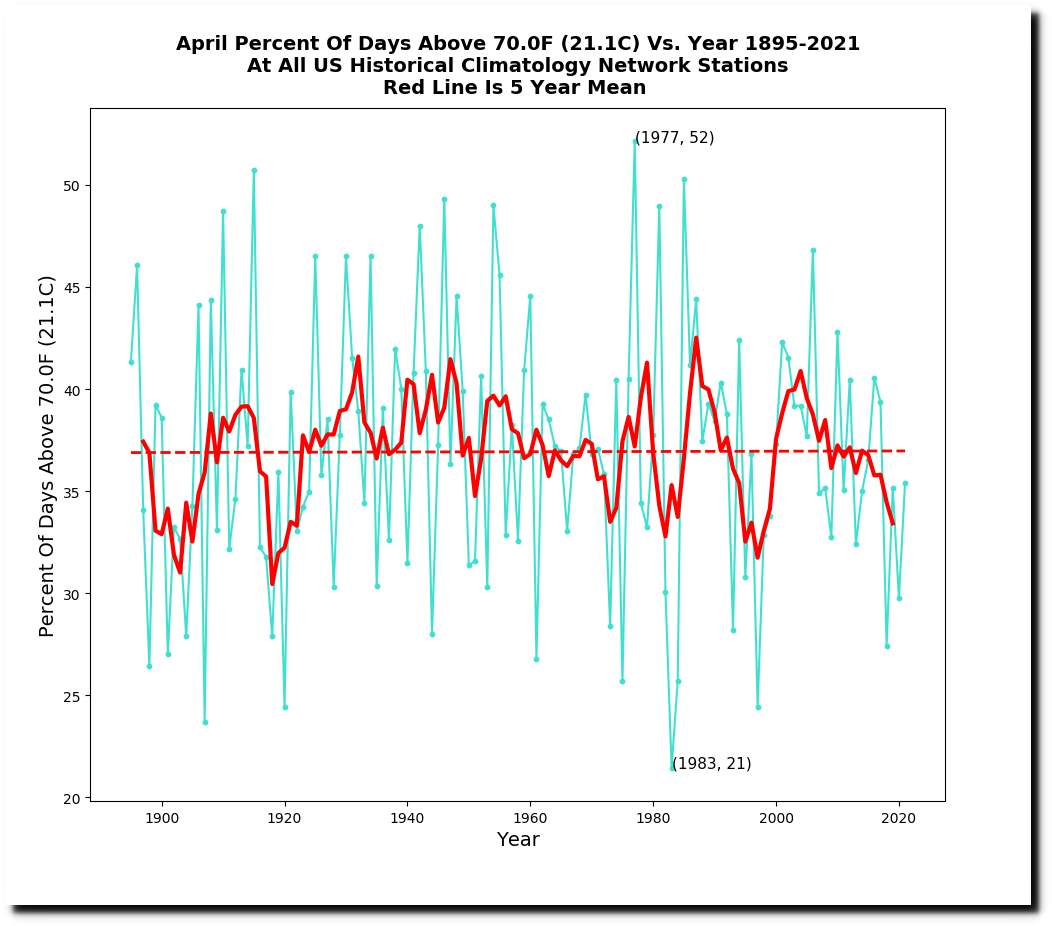
The percent of days above 70F was second highest on record.
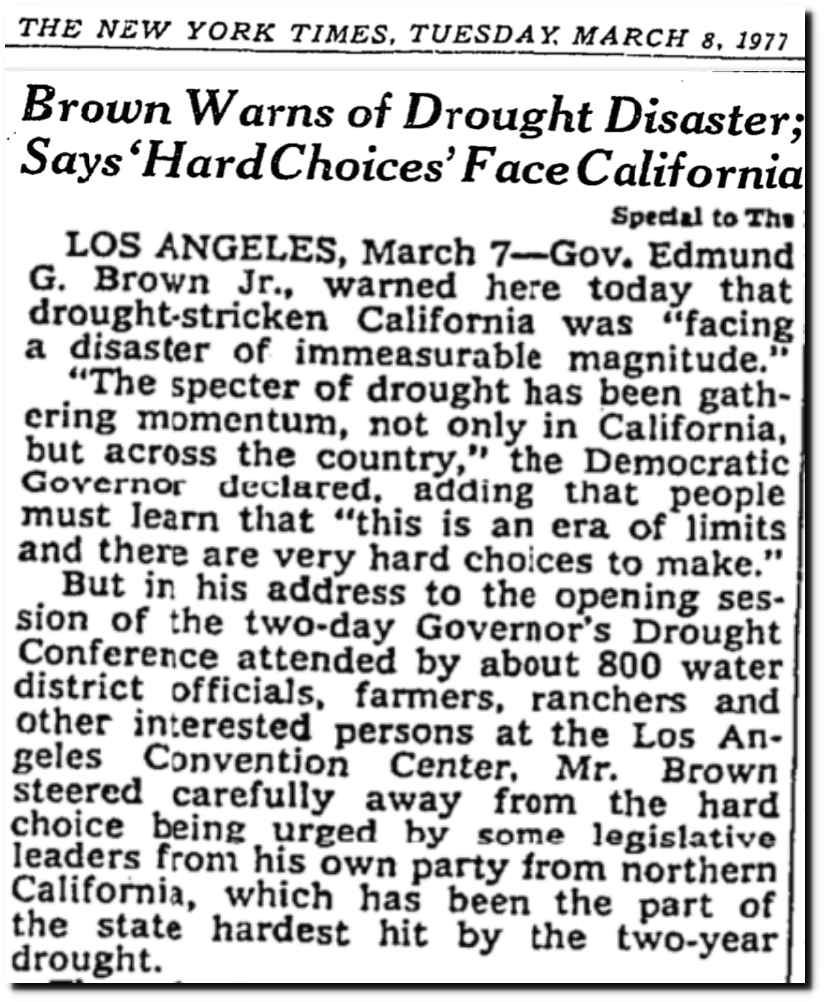
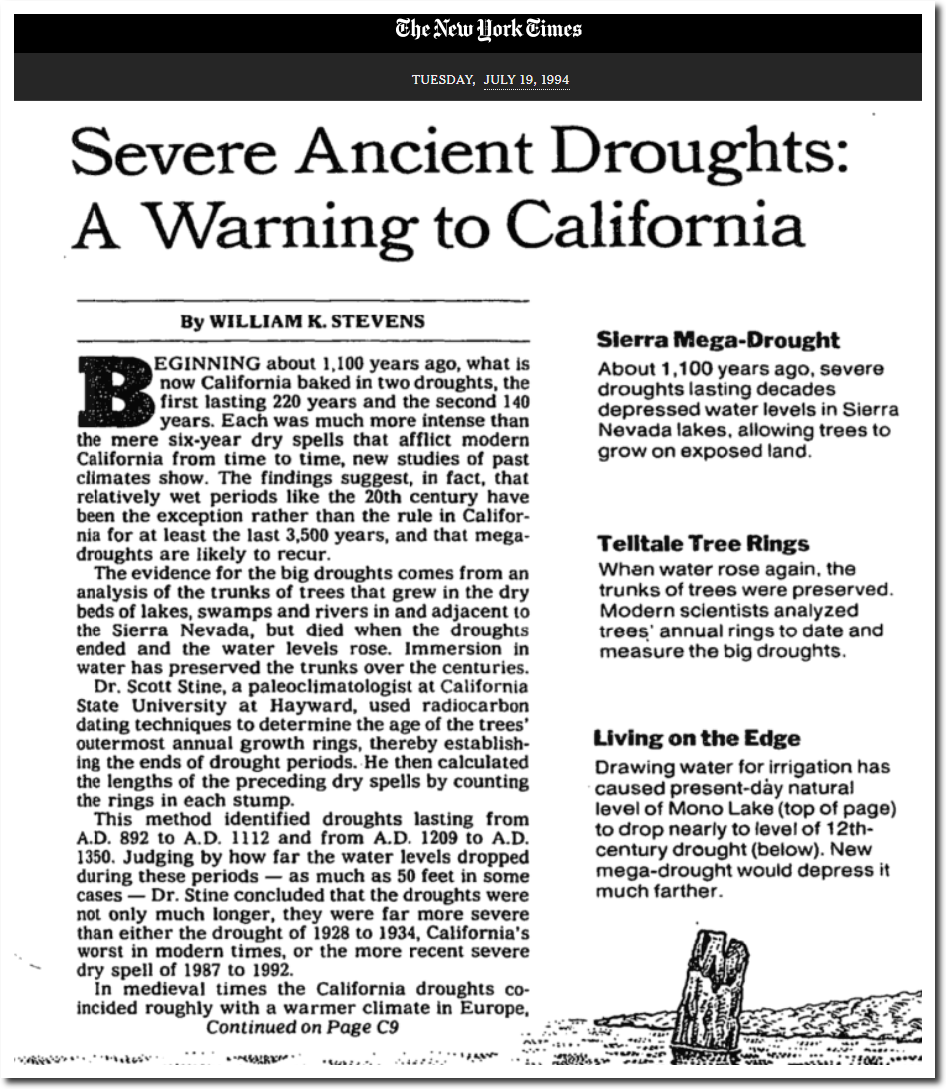
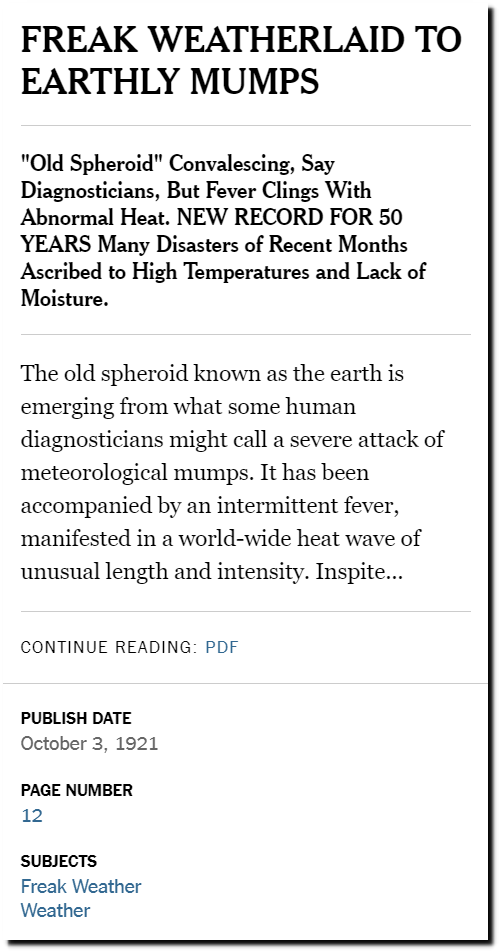
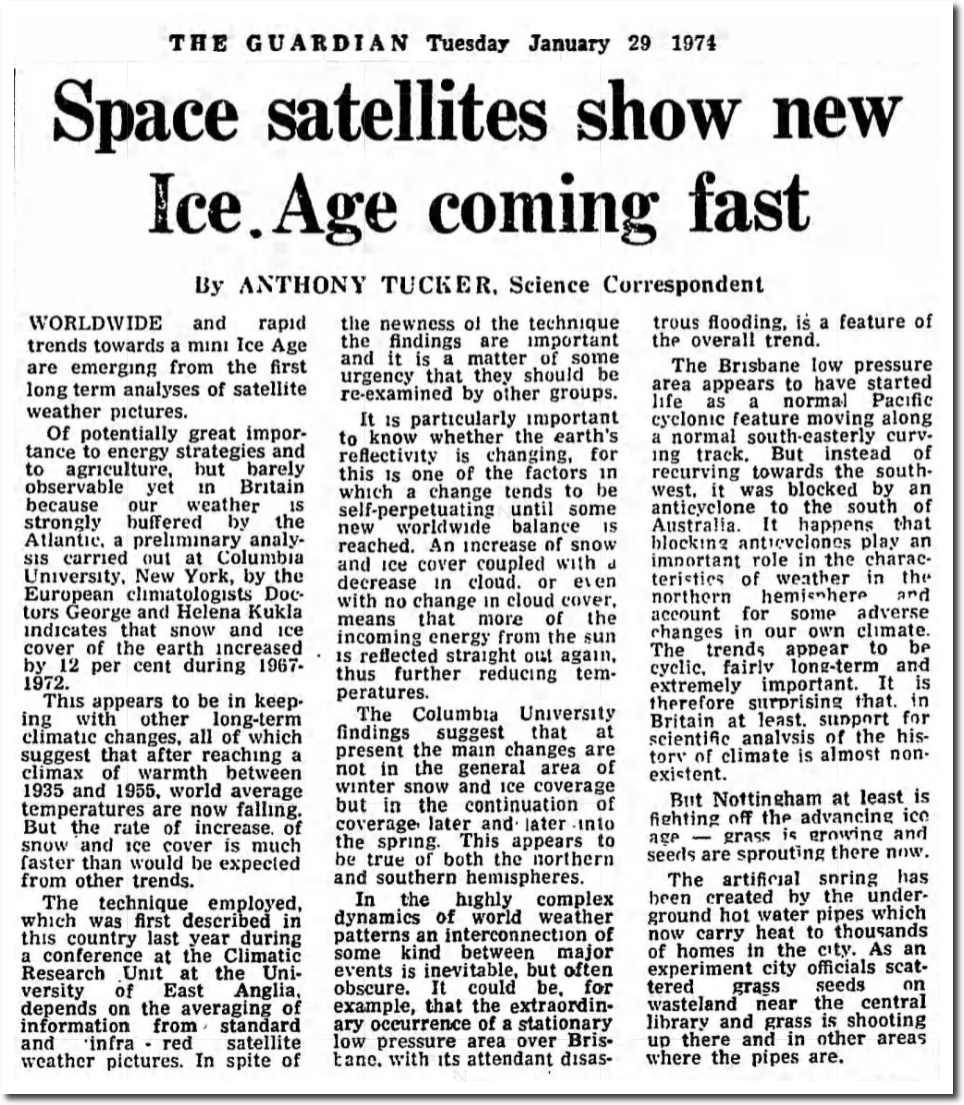
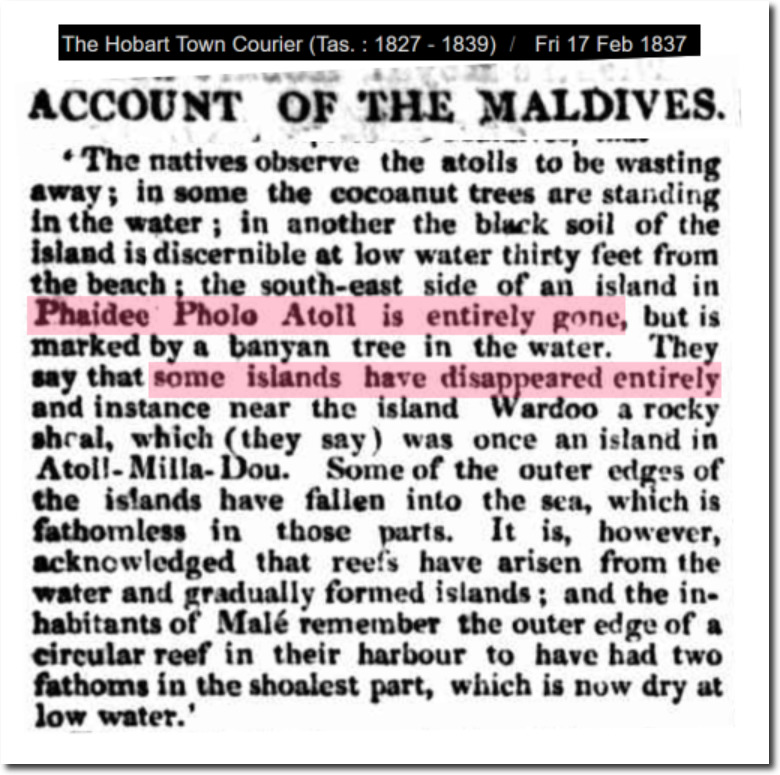
The New York Times reported that the heat of 1921 was global.
“a world-wide heat wave of unusual length and intensity”
“whether the worldwide heat wave is clue to some terrible paroxysm of nature, such as volcanic action In some remote region of the earth or seismic: upheaval in the depths of some unknown sea, or whether It is due to sun-spots or some other cause, is entirely problematical.”
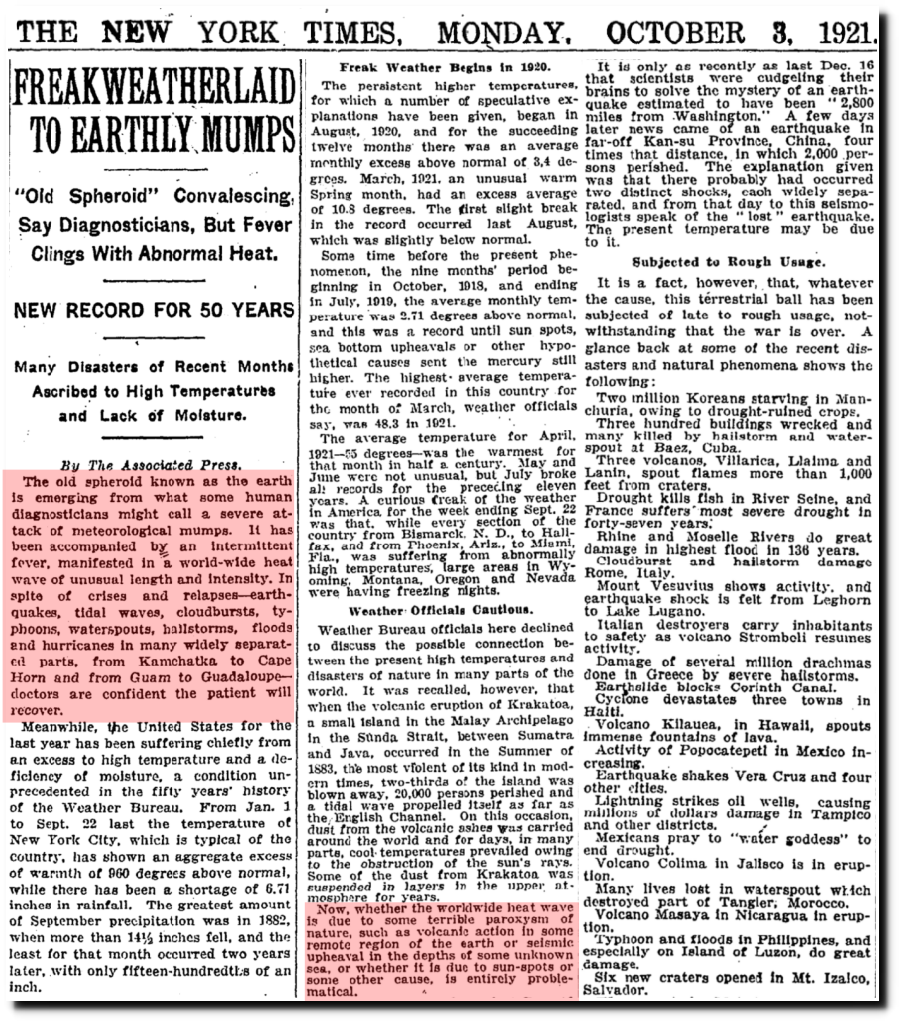
TimesMachine: October 3, 1921 – NYTimes.com
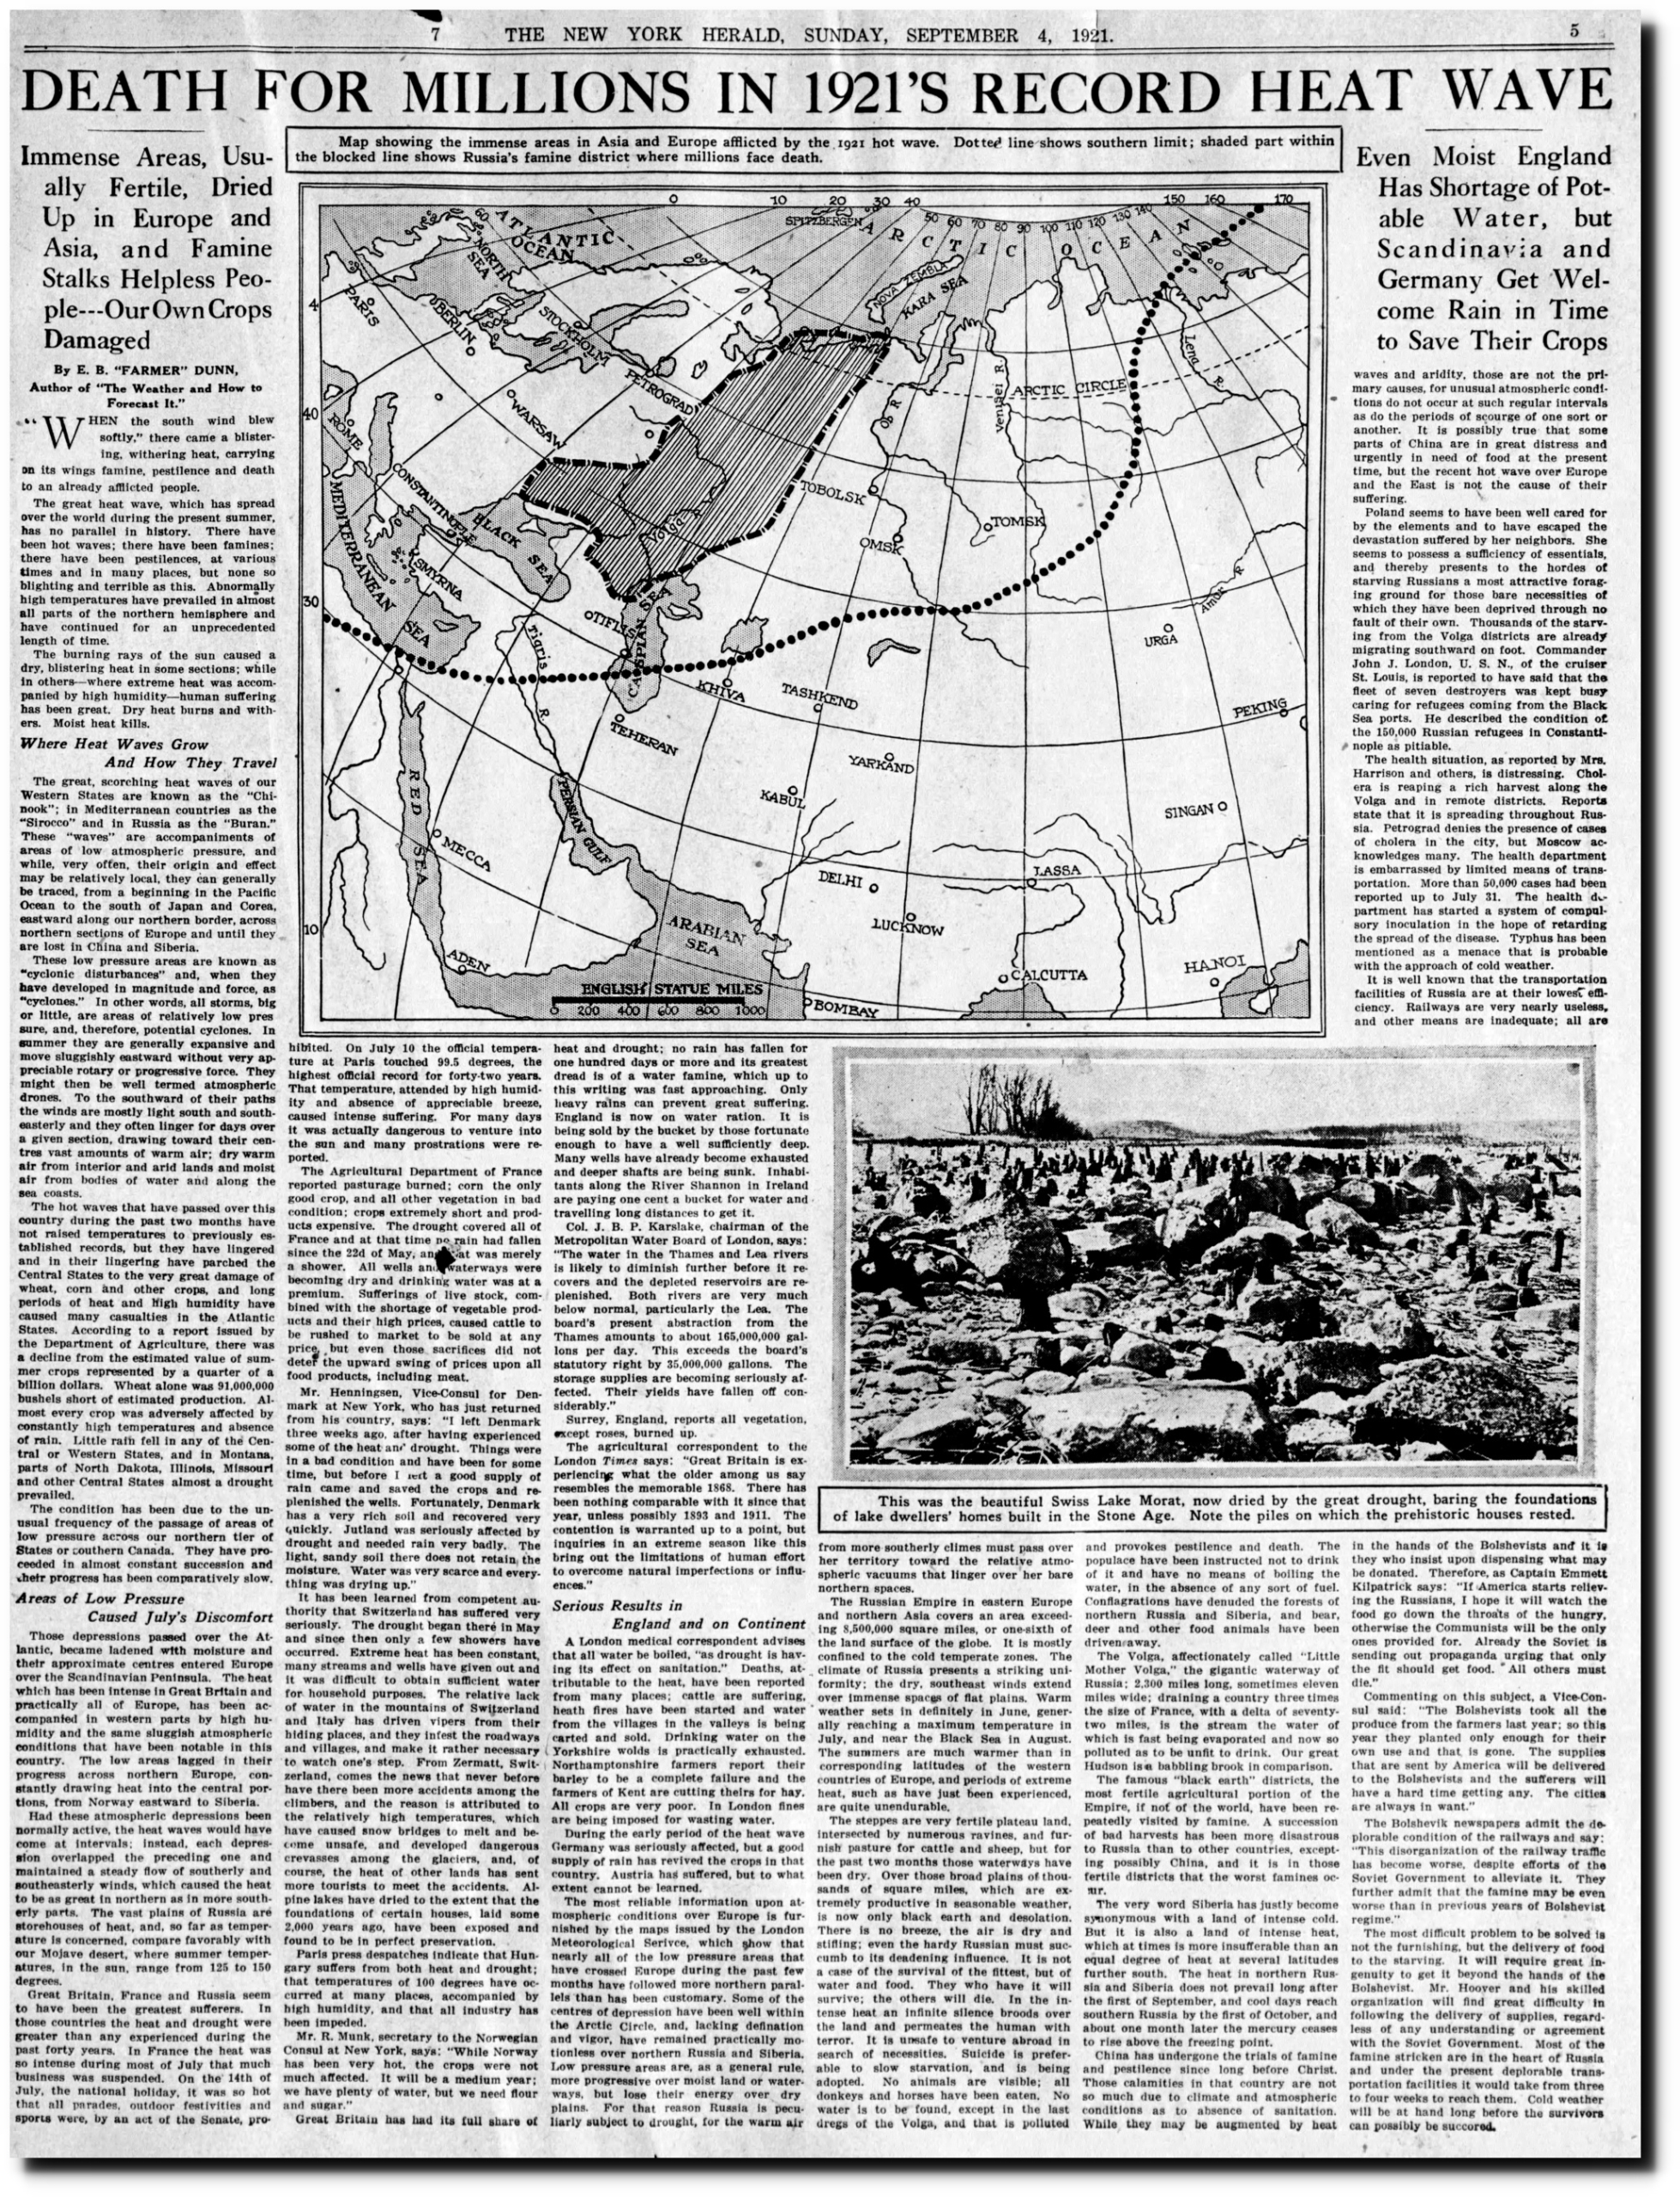
The New York Herald reported
“DEATH FOR MILLIONS IN 1921’s RECORD HEATWAVE”
“Immense Areas, Usually Fertile, Dried Up in Europe and Asia, and Famine Stalks Helpless People—Our Own Crops Damaged”
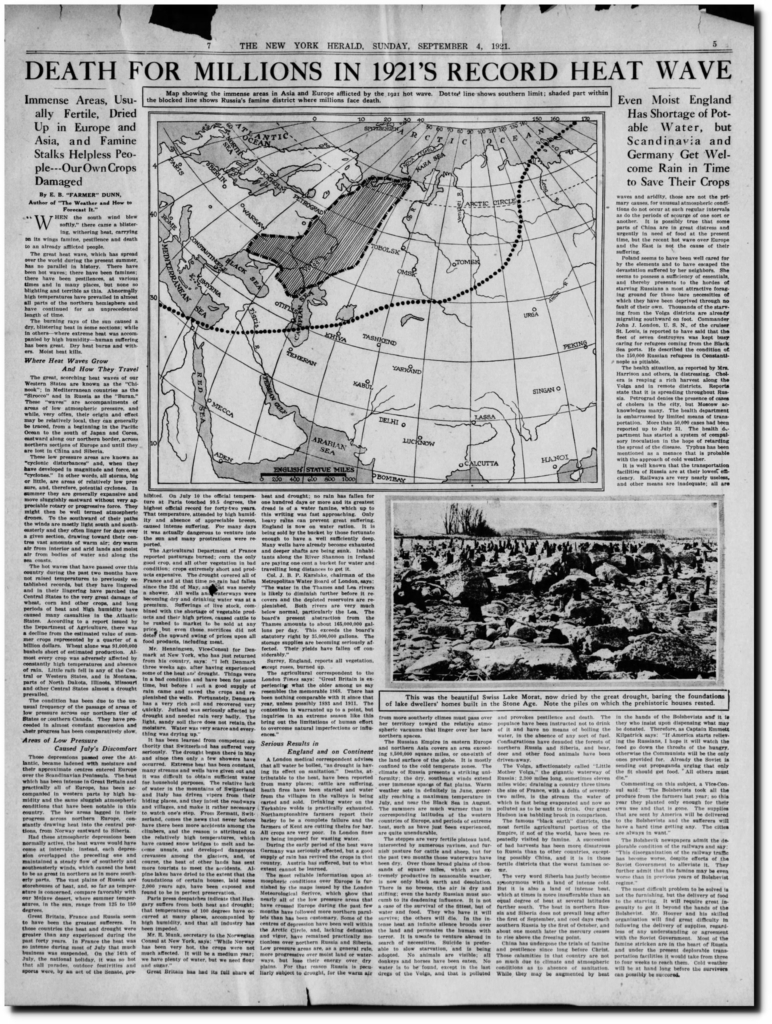
04 Sep 1921, 61 – New York Herald at Newspapers.com
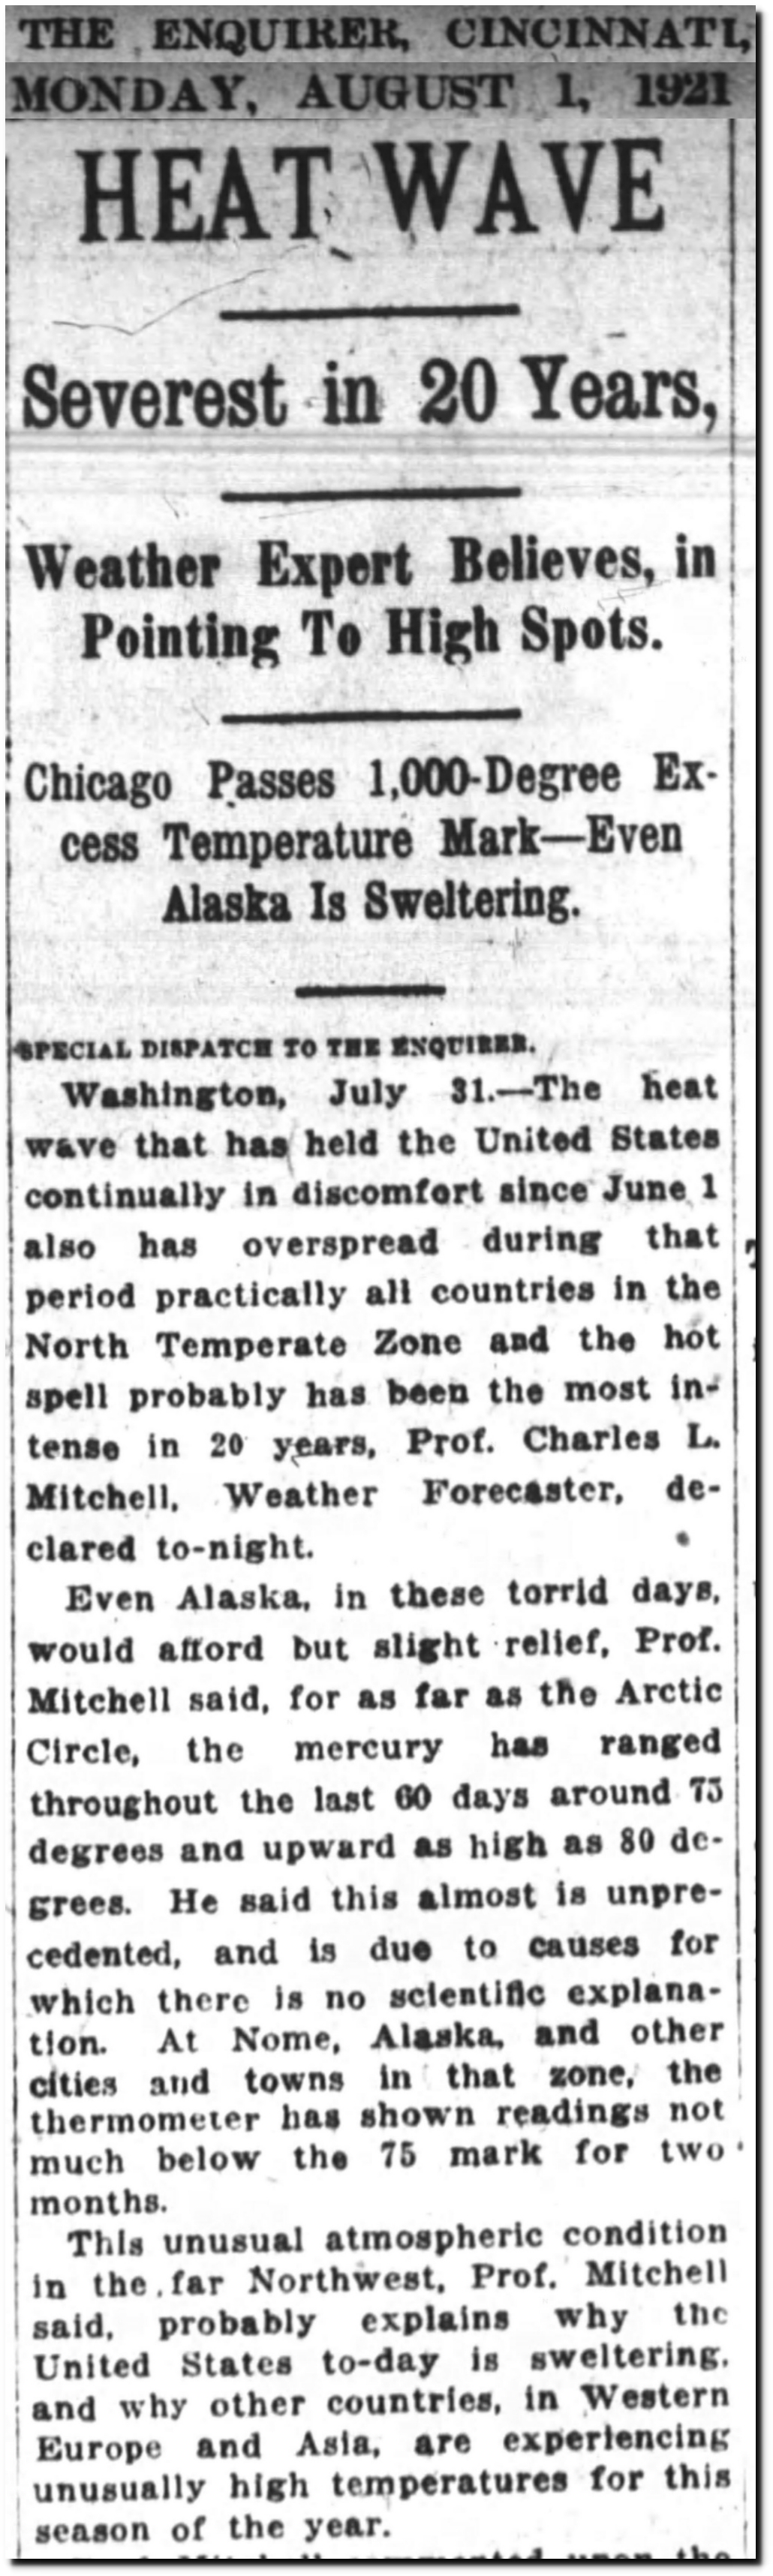
Alaska had an unprecedented heatwave in 1921.
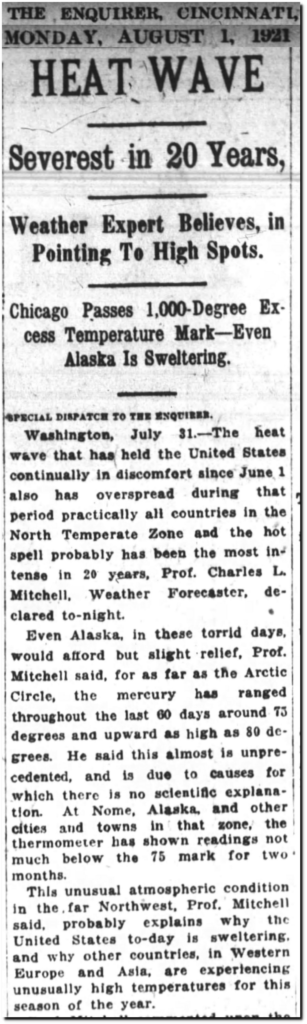
01 Aug 1921, Page 4 – The Cincinnati Enquirer at Newspapers.com
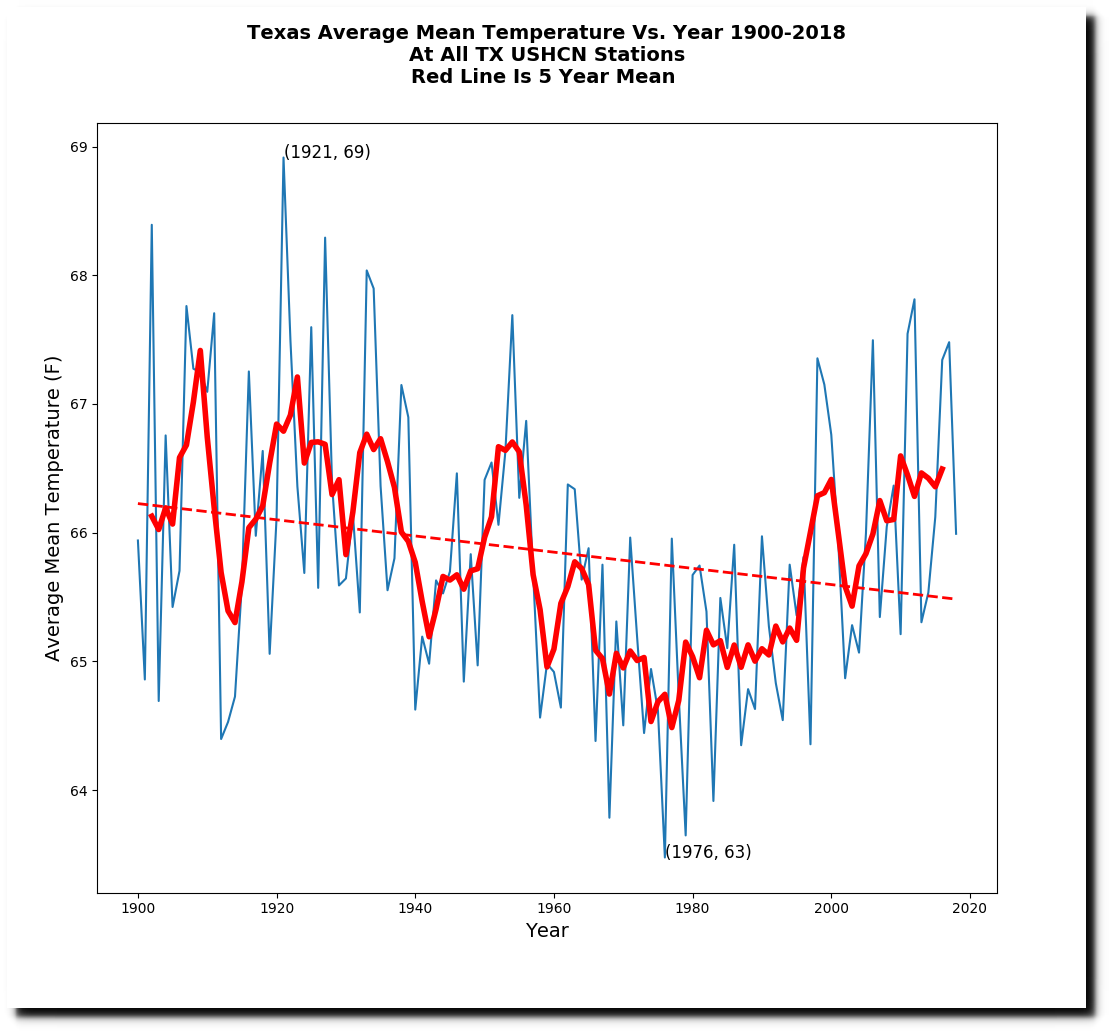
It was the hottest year on record in Texas.
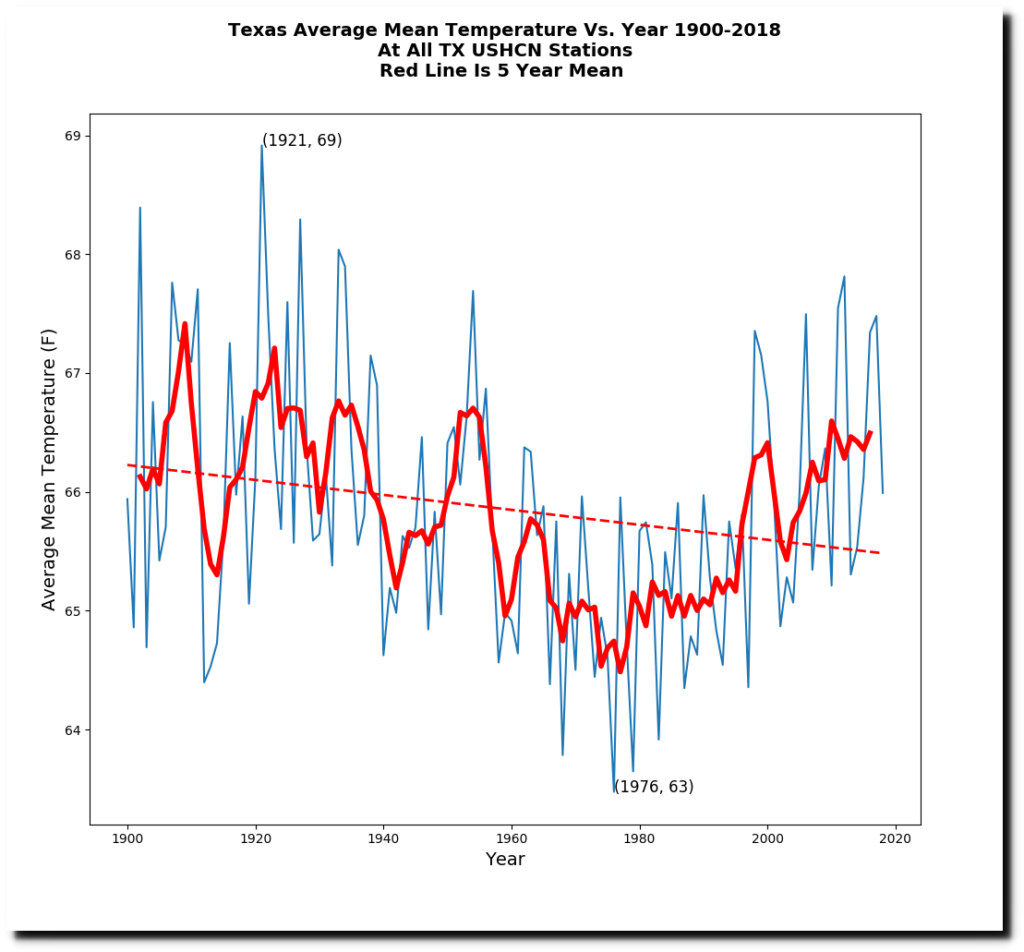
NOAA used to show that 1921 was the hottest year in Texas,
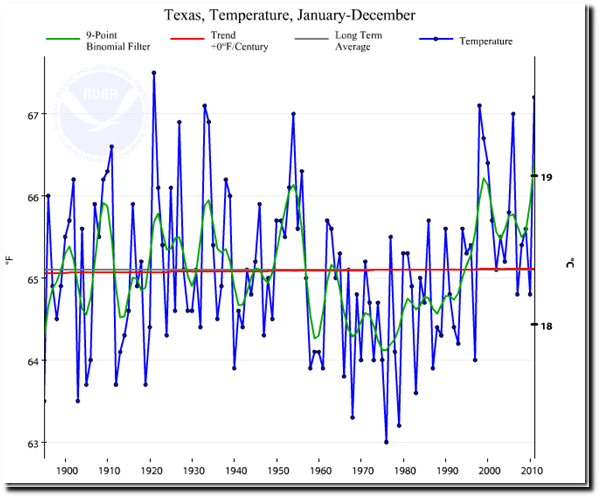
Climate scientists who have been claiming Texas is warming are totally wrong. | Watts Up With That?
But they have since altered the data to cool 1921 considerably.
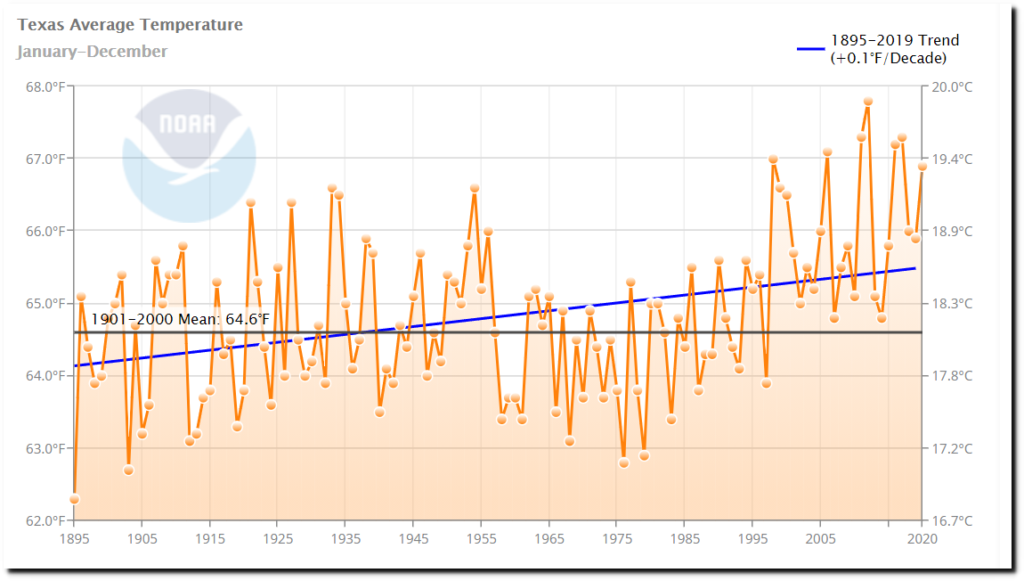
Climate at a Glance | National Centers for Environmental Information (NCEI)
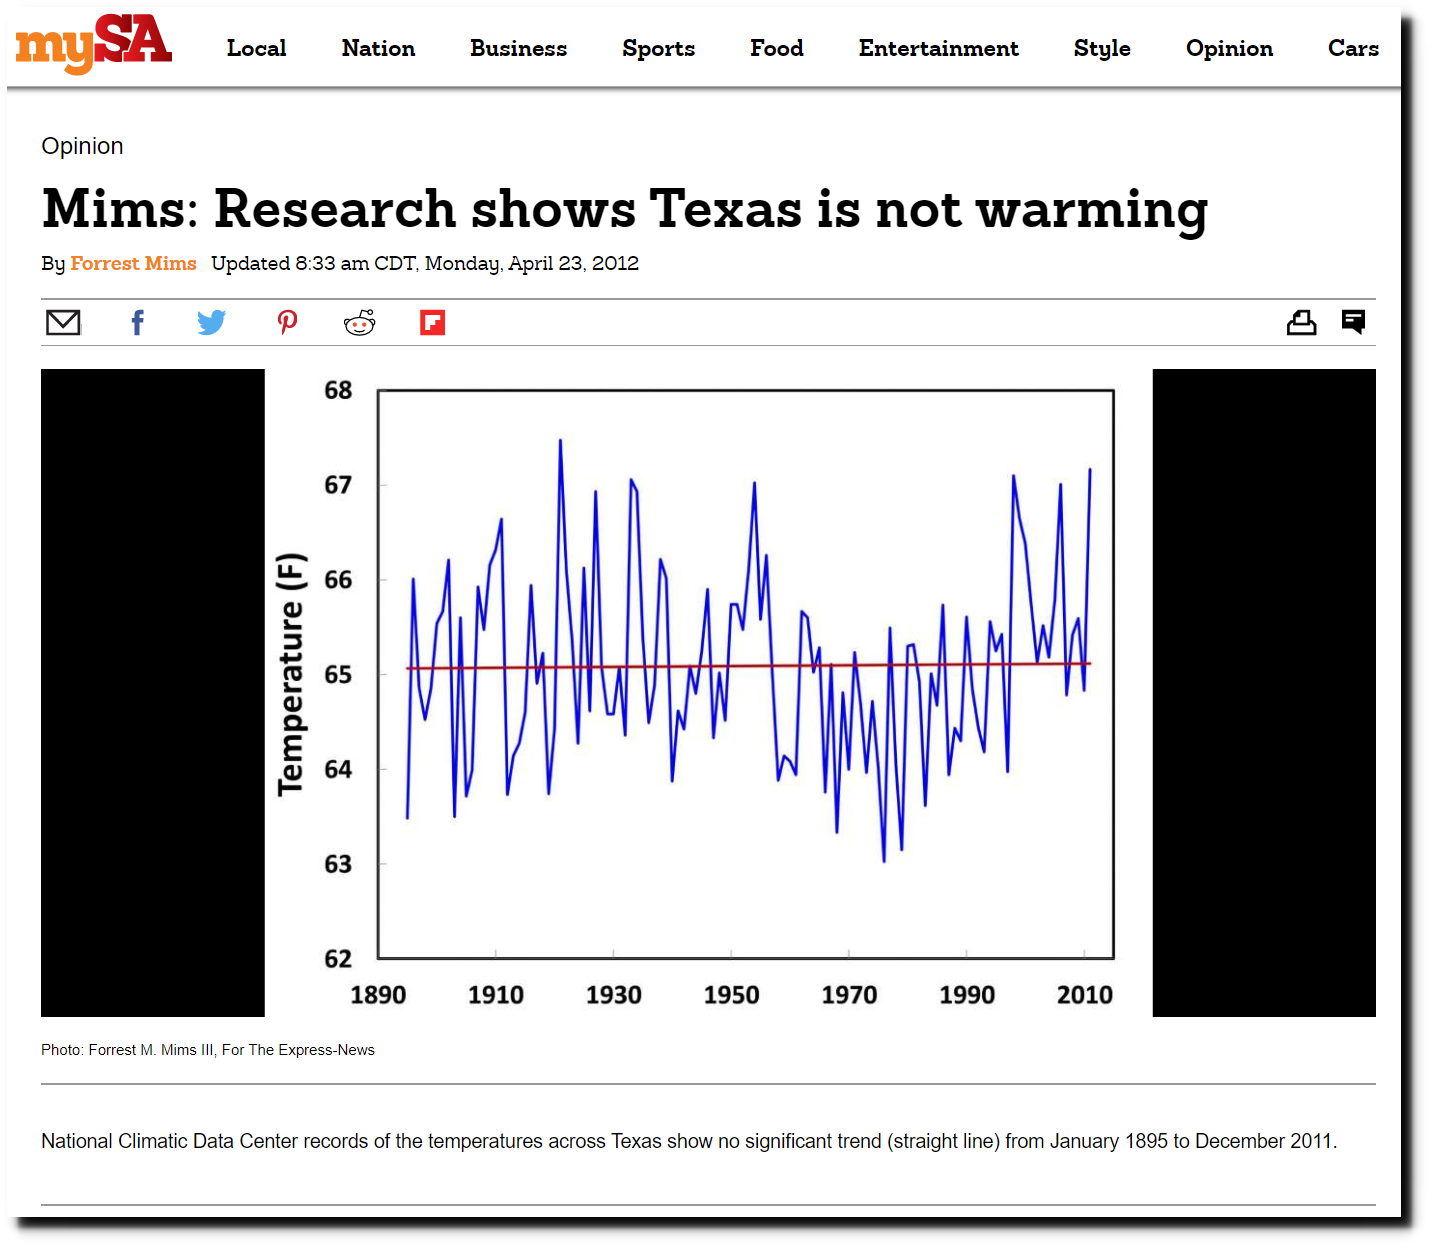
In 2012, the San Antonio Express News said Texas is not warming, based on NCDC data.

Mims: Research shows Texas is not warming – San Antonio Express-News
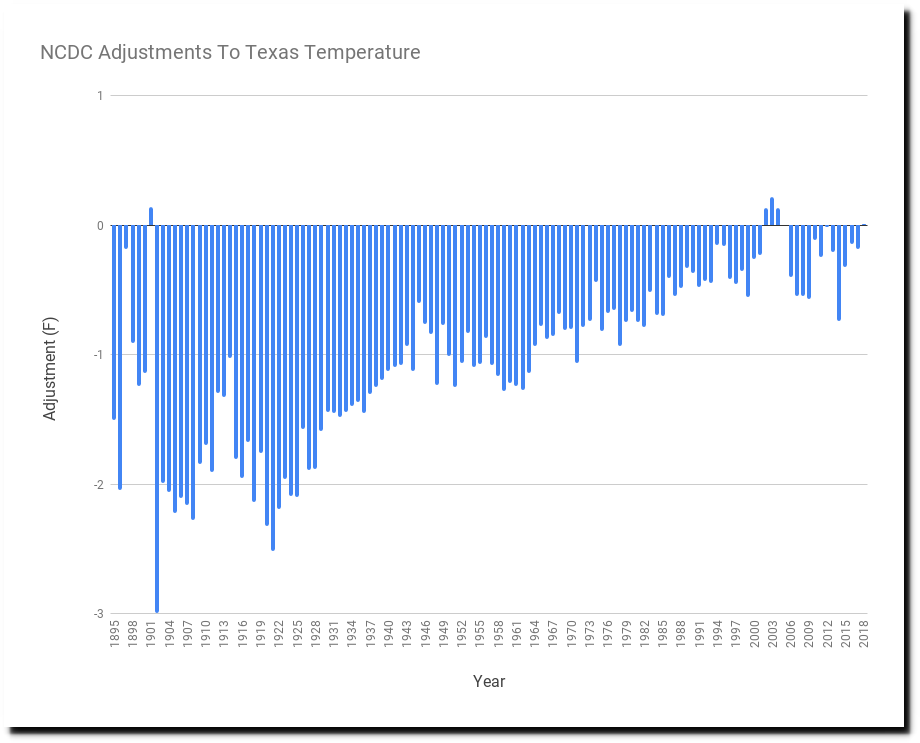
This graph shows how NOAA tempers with Texas temperature data.
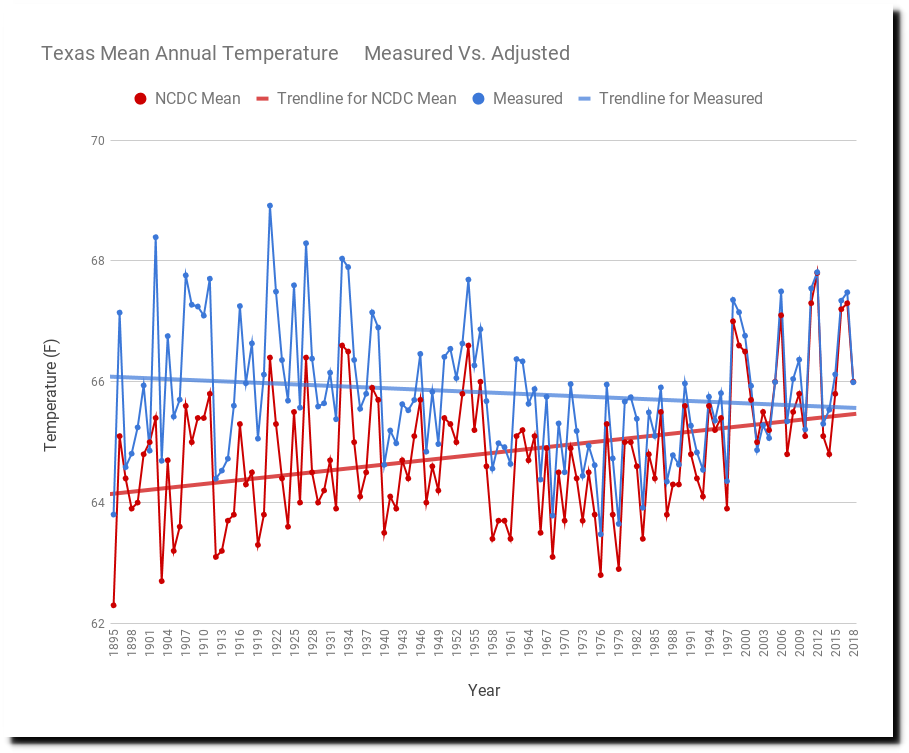
Spreadsheet Data
This graph shows the adjustments, older temperatures have been massively cooled. Temperatures from 1921 have been cooled more than two degrees via data tampering.
1921 was a persistently hot year.
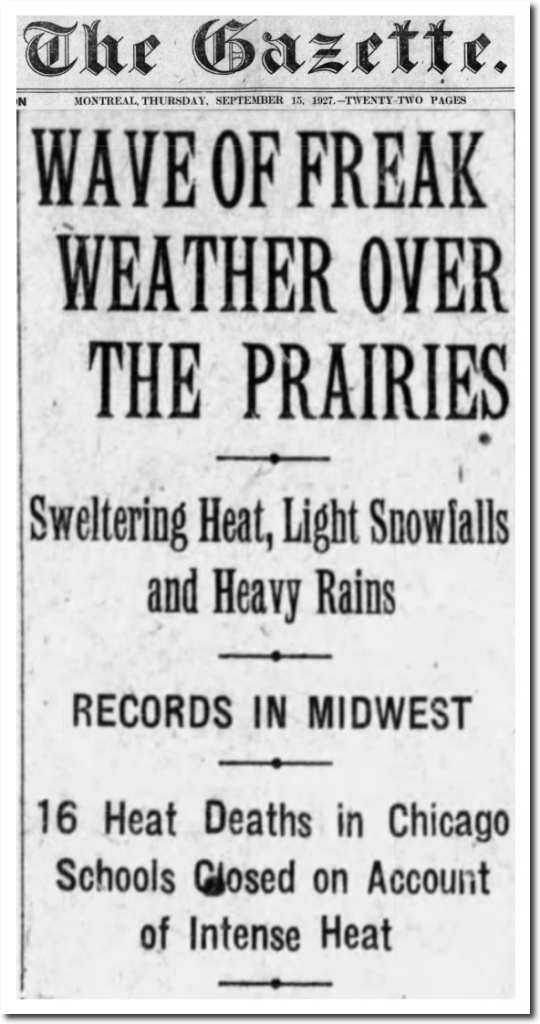
15 Sep 1927, 1 – The Gazette at Newspapers.com
Europe had unprecedented heatwaves.
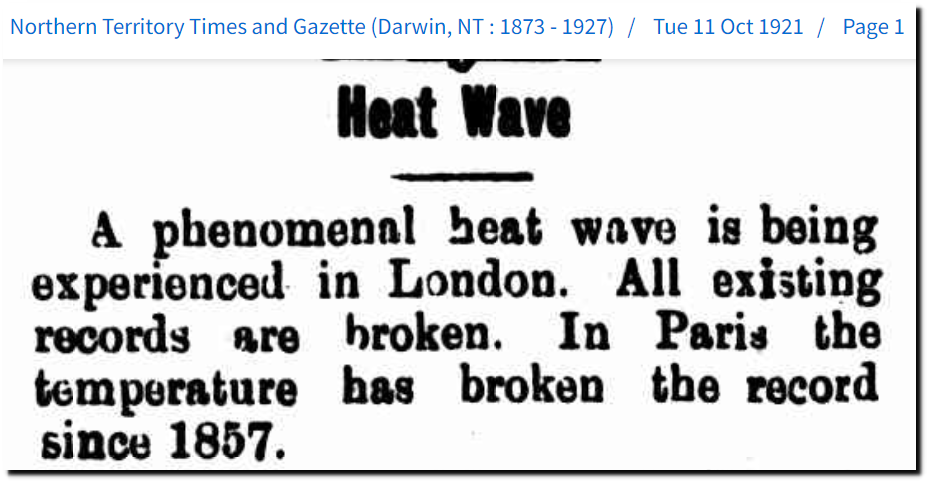
11 Oct 1921 – Heat Wave – Trove
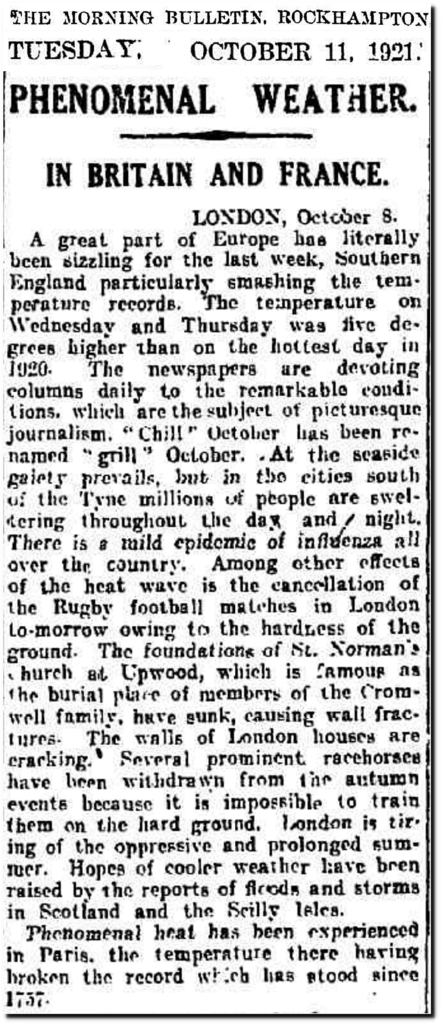 11 Oct 1921 – PHENOMENAL WEATHER. – Trove
The year was not only hot, but full of natural disasters.
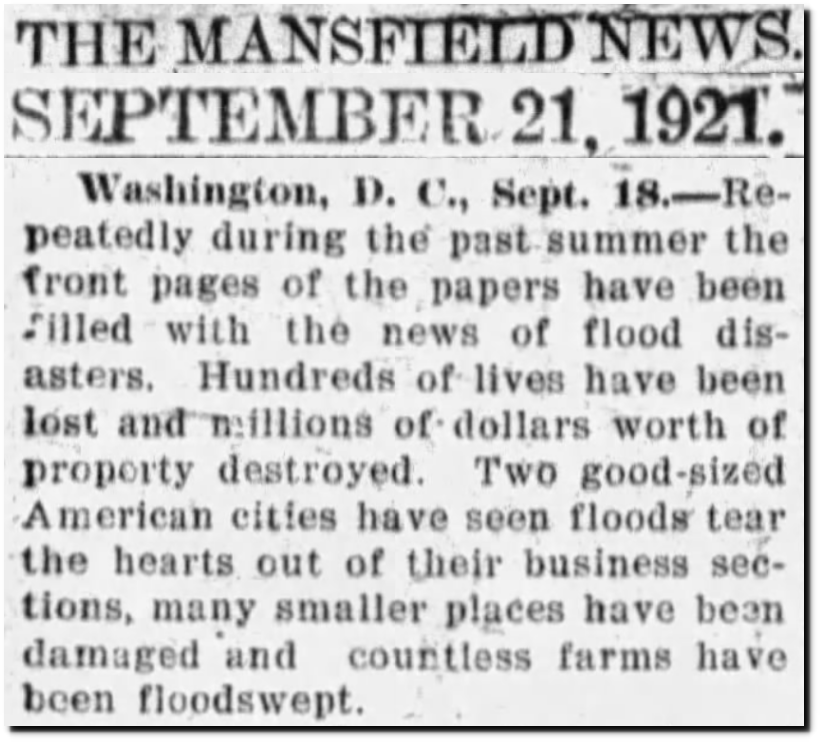
21 Sep 1921, 3 – News-Journal at Newspapers.com
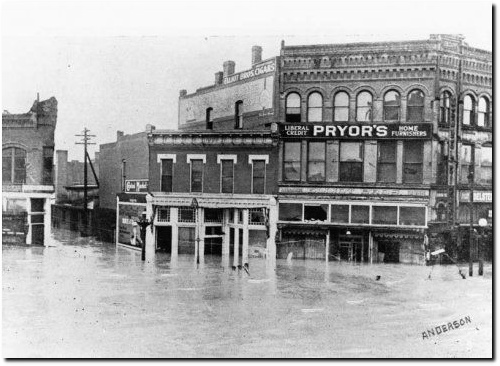
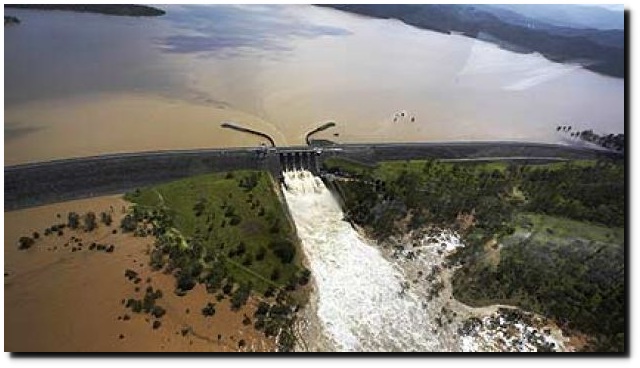
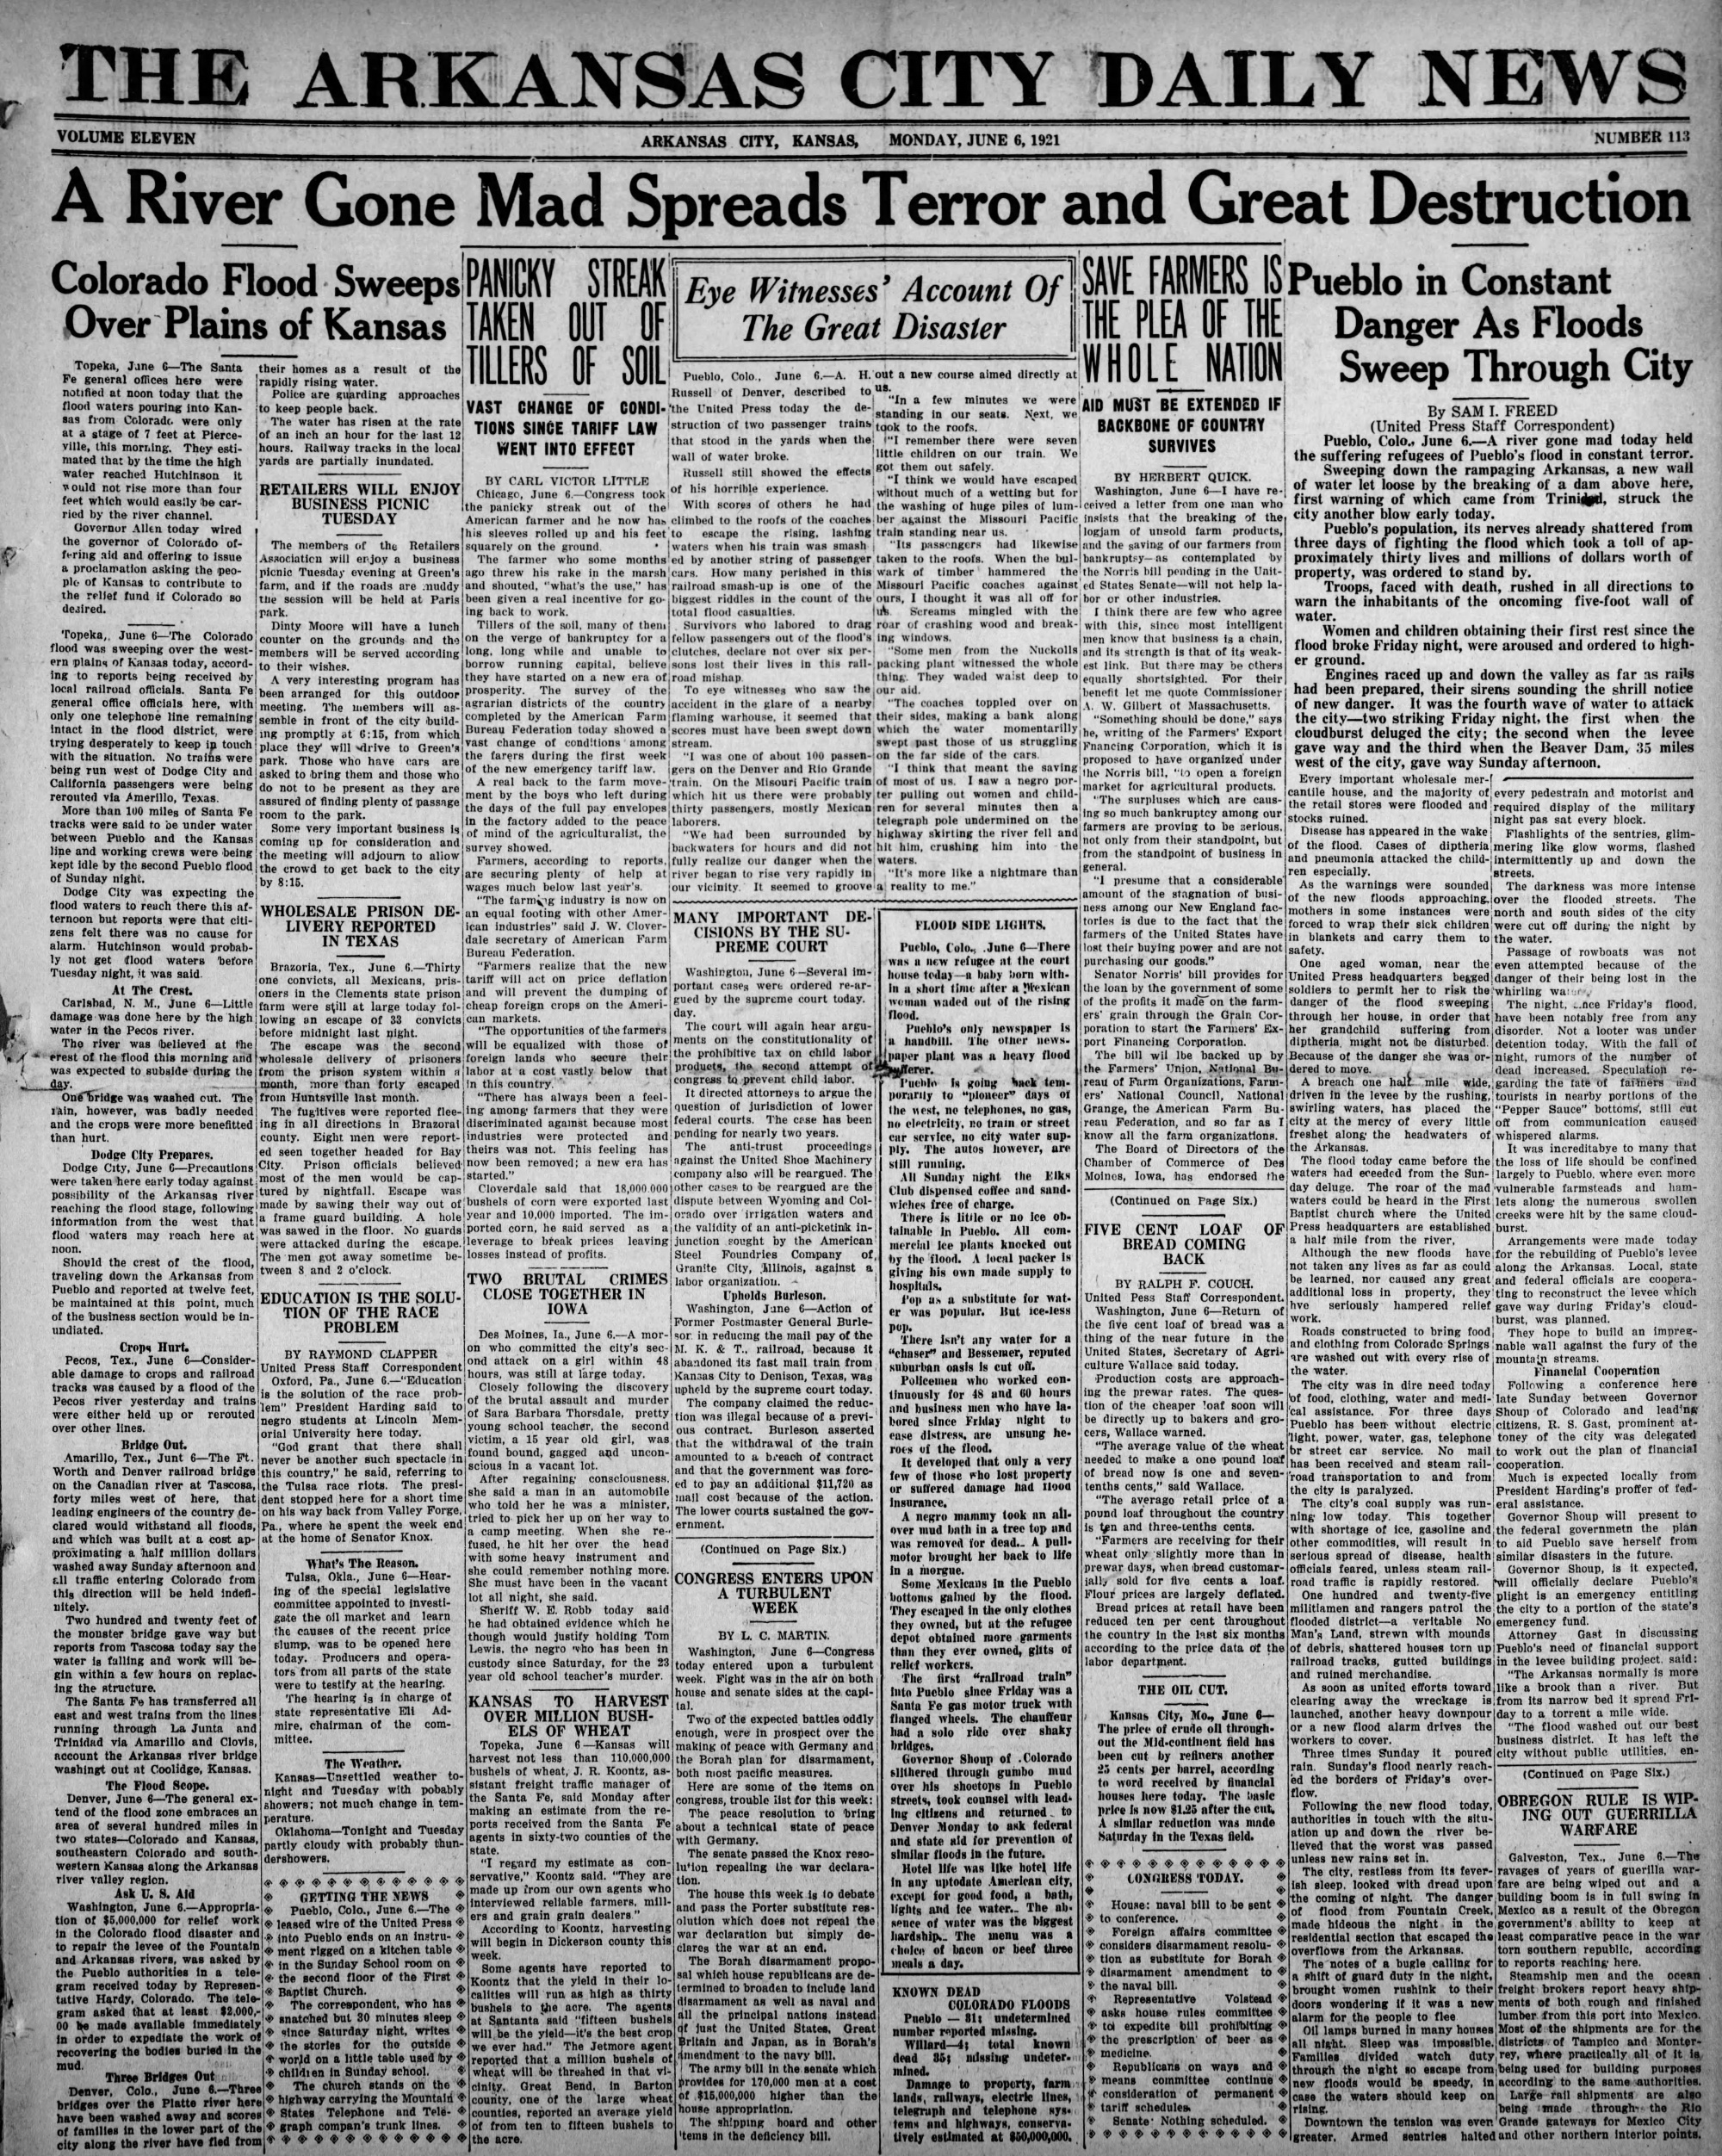
Pueblo, Colorado was largely wiped out by a flood during June, 1921. Much of Kansas suffered damage, and there was flooding on the Pecos River in New Mexico and Texas.

06 Jun 1921, 1 – The Arkansas City Daily News at Newspapers.com
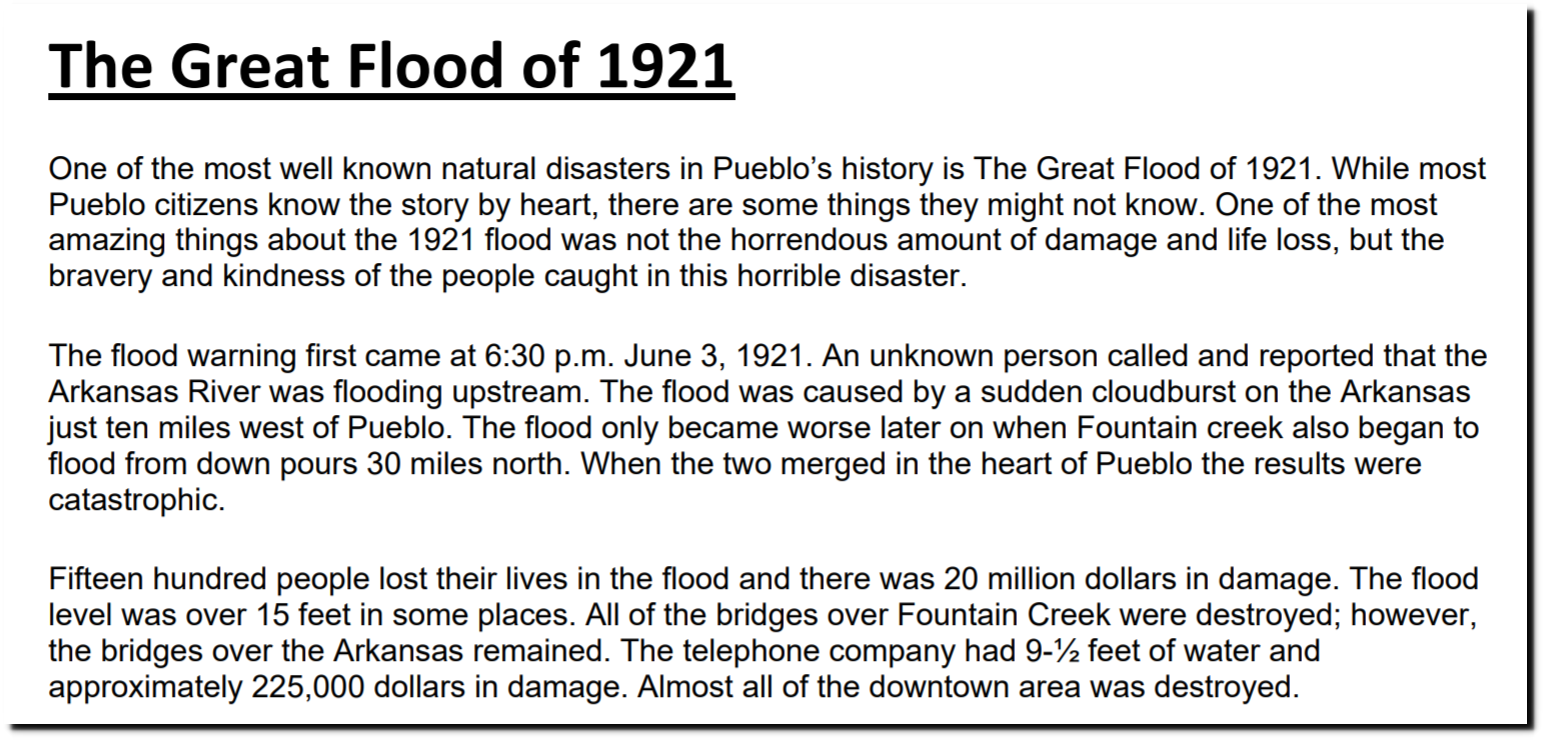
It is estimated that 1,500 people in Pueblo, Colorado died during that flood.

Microsoft Word – Document1
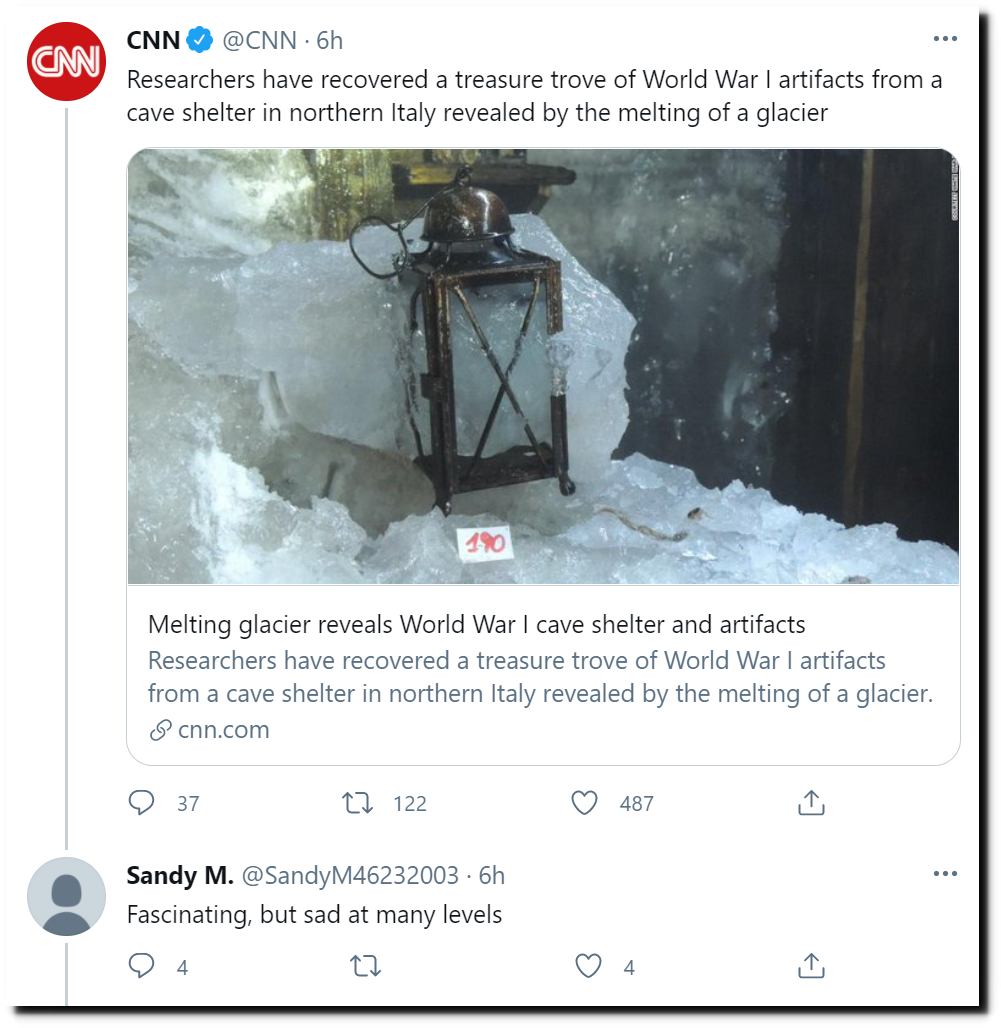
In 1921, the Arctic was very warm and glaciers were rapidly disappearing.
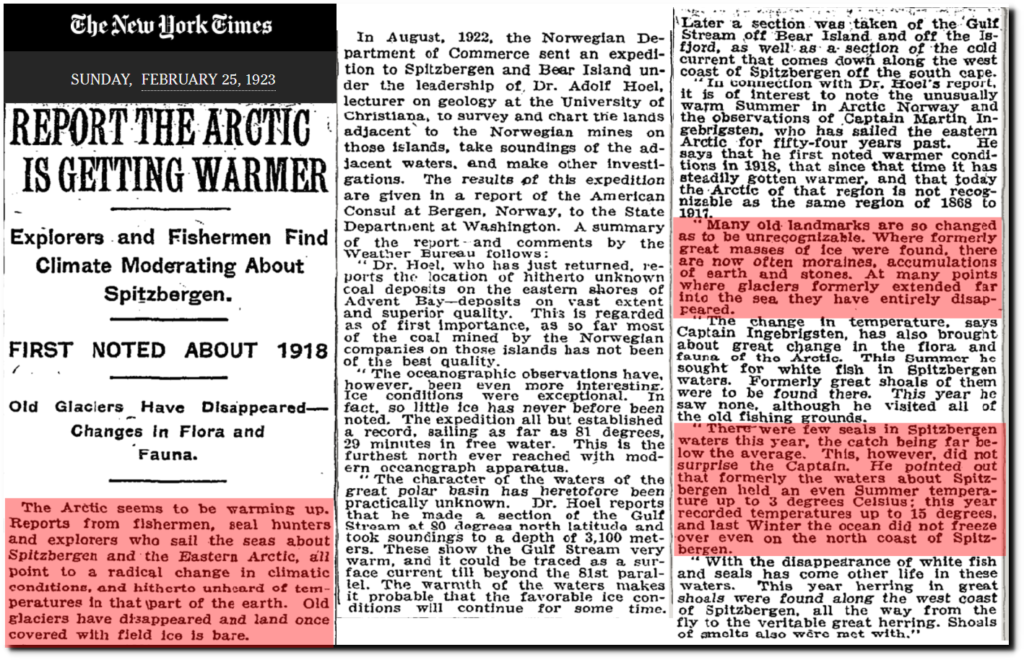
TimesMachine: February 25, 1923 – NYTimes.com
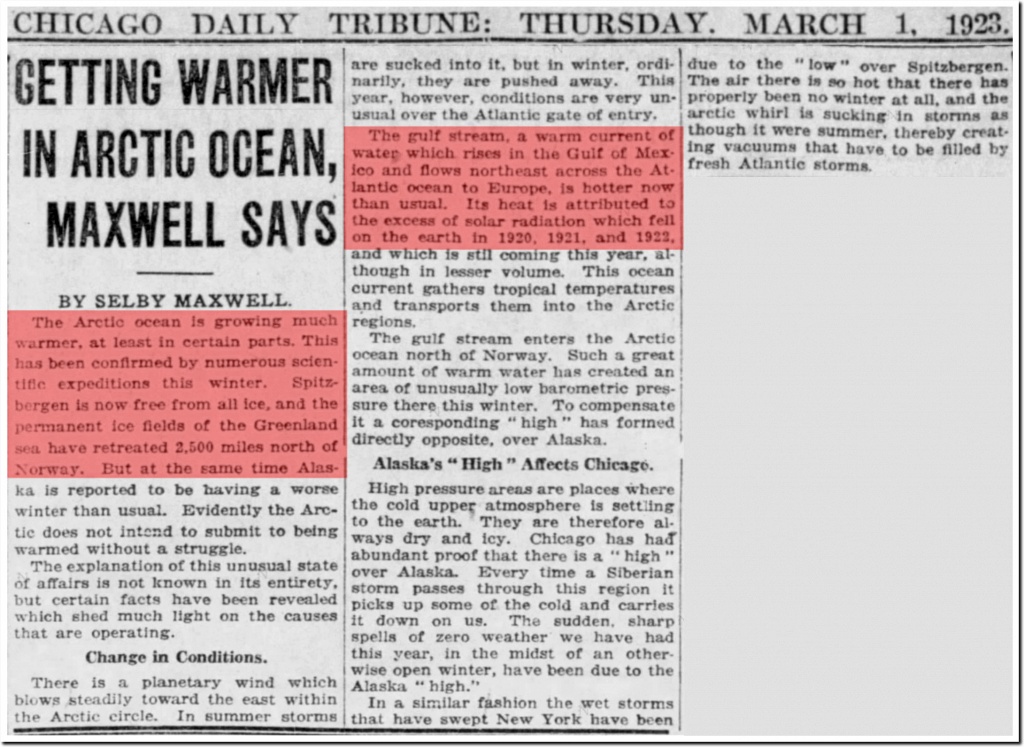
01 Mar 1923, 4 – Chicago Tribune at Newspapers.com
In 1922, Stefansson reported 100 degree temperatures in the Arctic.
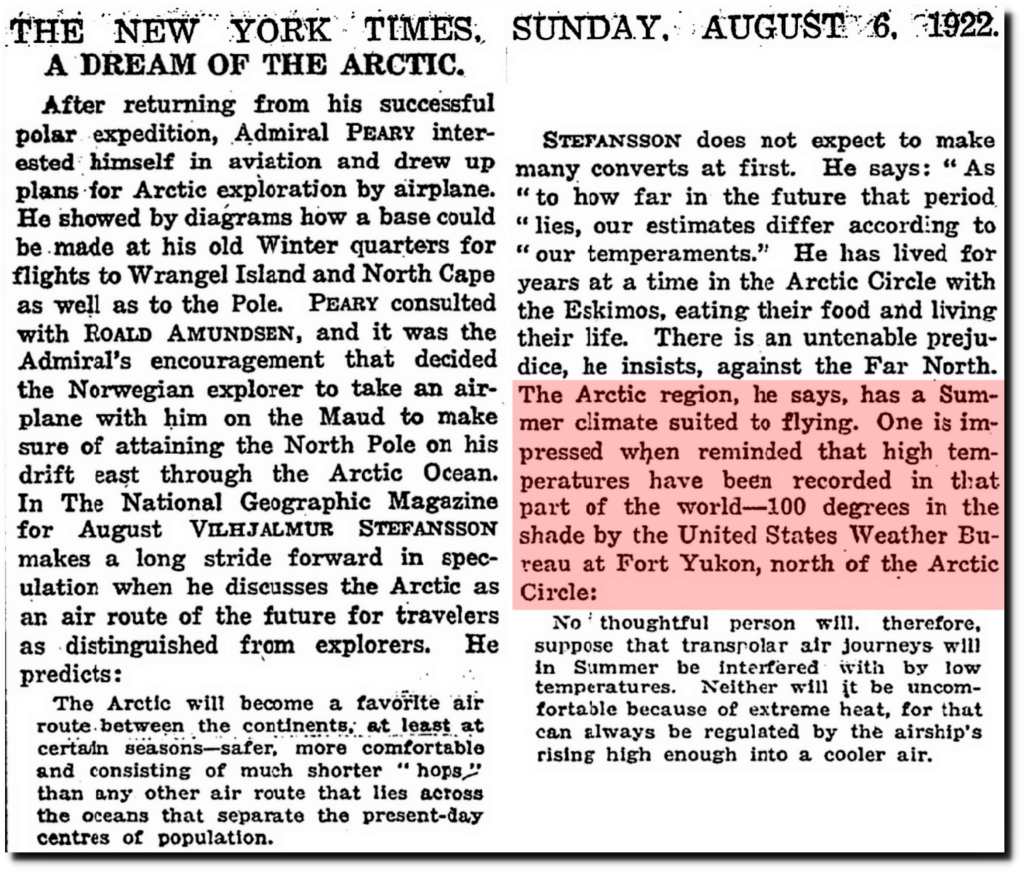
TimesMachine: August 6, 1922 – NYTimes.com
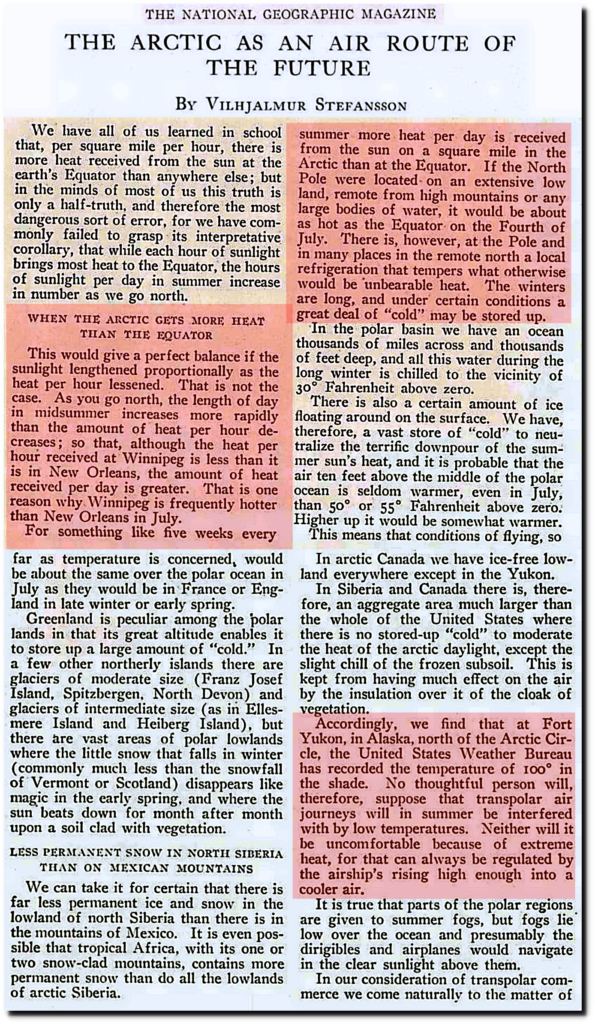
National Geographic Magazine Archive
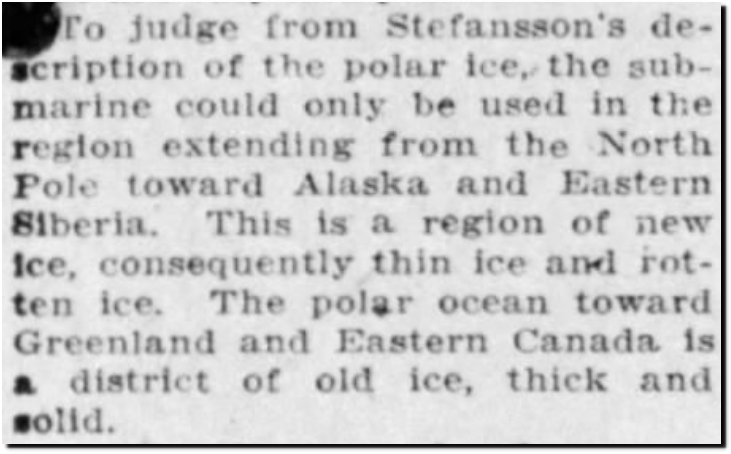
The ice between Alaska and the North Pole was thin, rotten new ice.
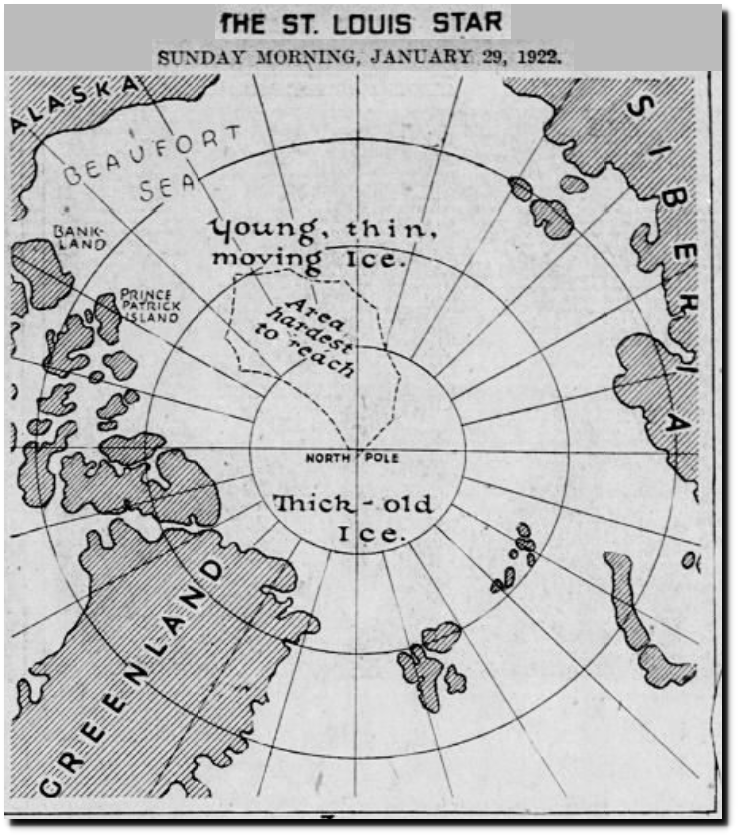
29 Jan 1922, Page 35 – The St. Louis Star and Times at Newspapers.com
Much of the world was experiencing exceptional heat, including Alaska.
01 Aug 1921, Page 4 – The Cincinnati Enquirer at Newspapers.com
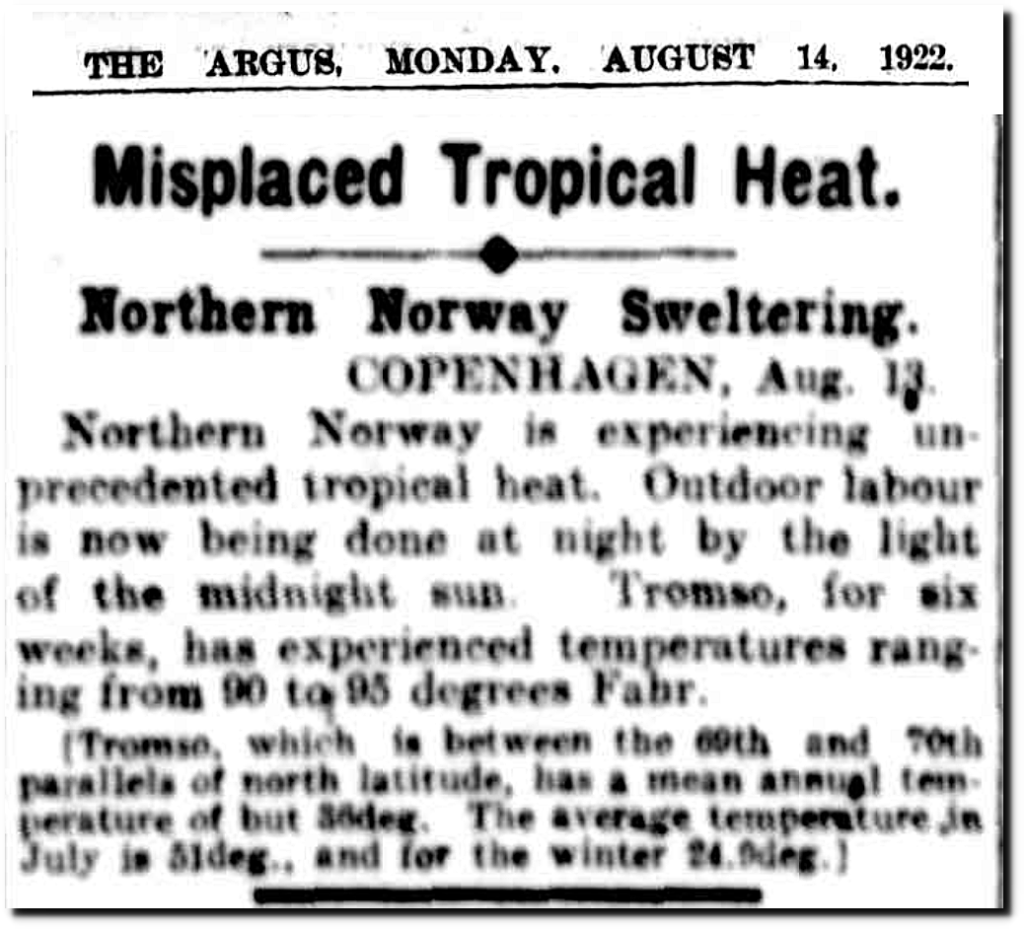 14 Aug 1922 – Misplaced Tropical Heat. – Trove

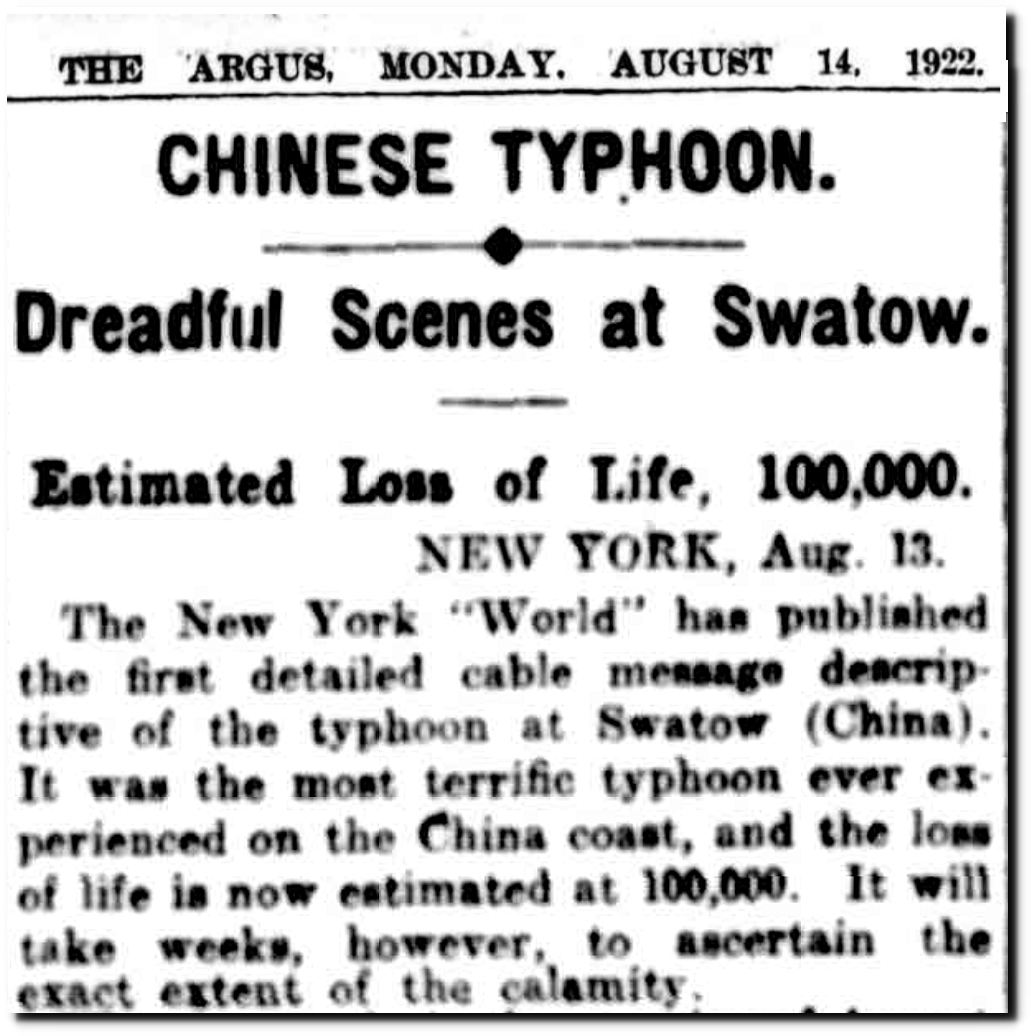
14 Aug 1922 – CHINESE TYPHOON. – Trove
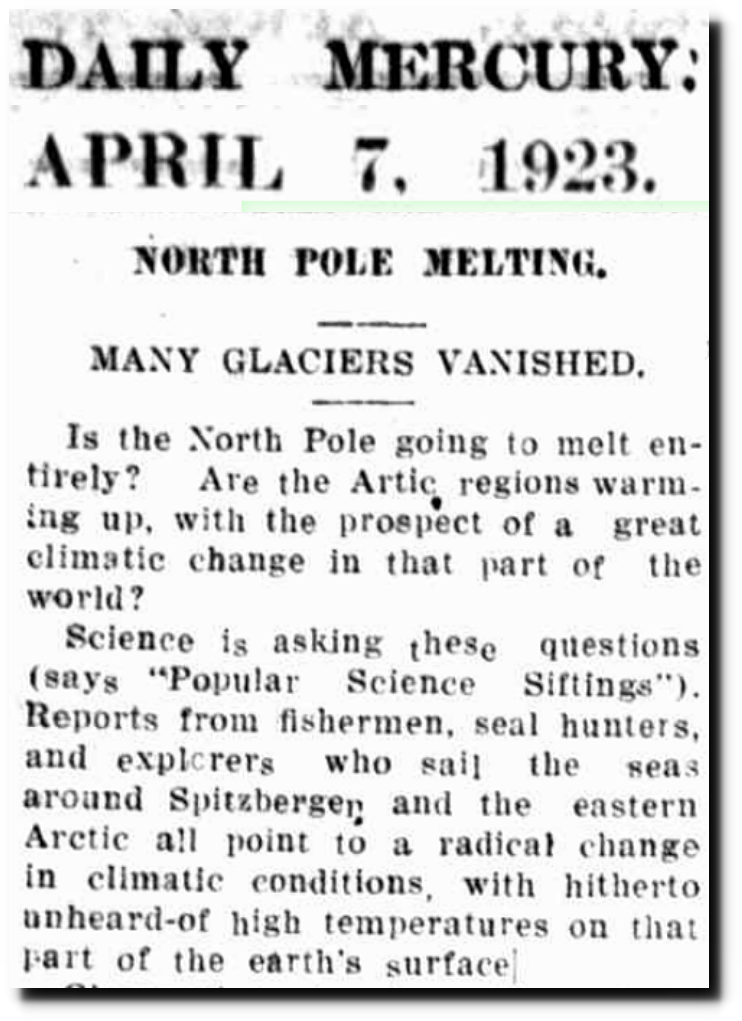
07 Apr 1923 – NORTH POLE MELTING. – Trove
Glaciers in Glacier National Park were forecast to disappear before 1950.
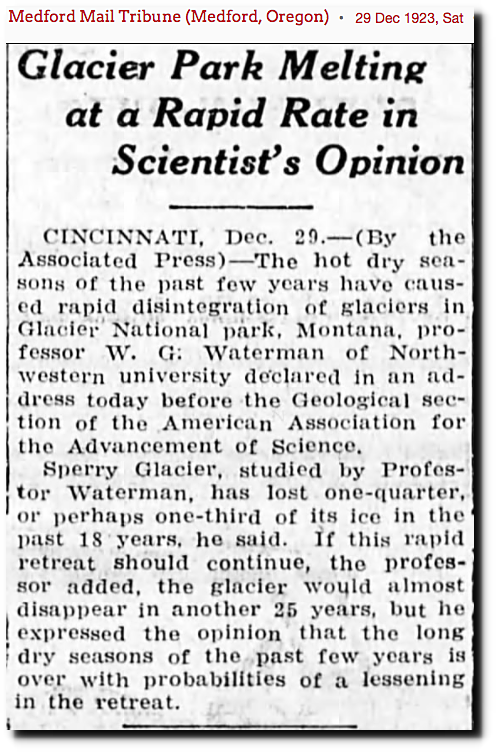
29 Dec 1923, Page 5 – at Newspapers.com
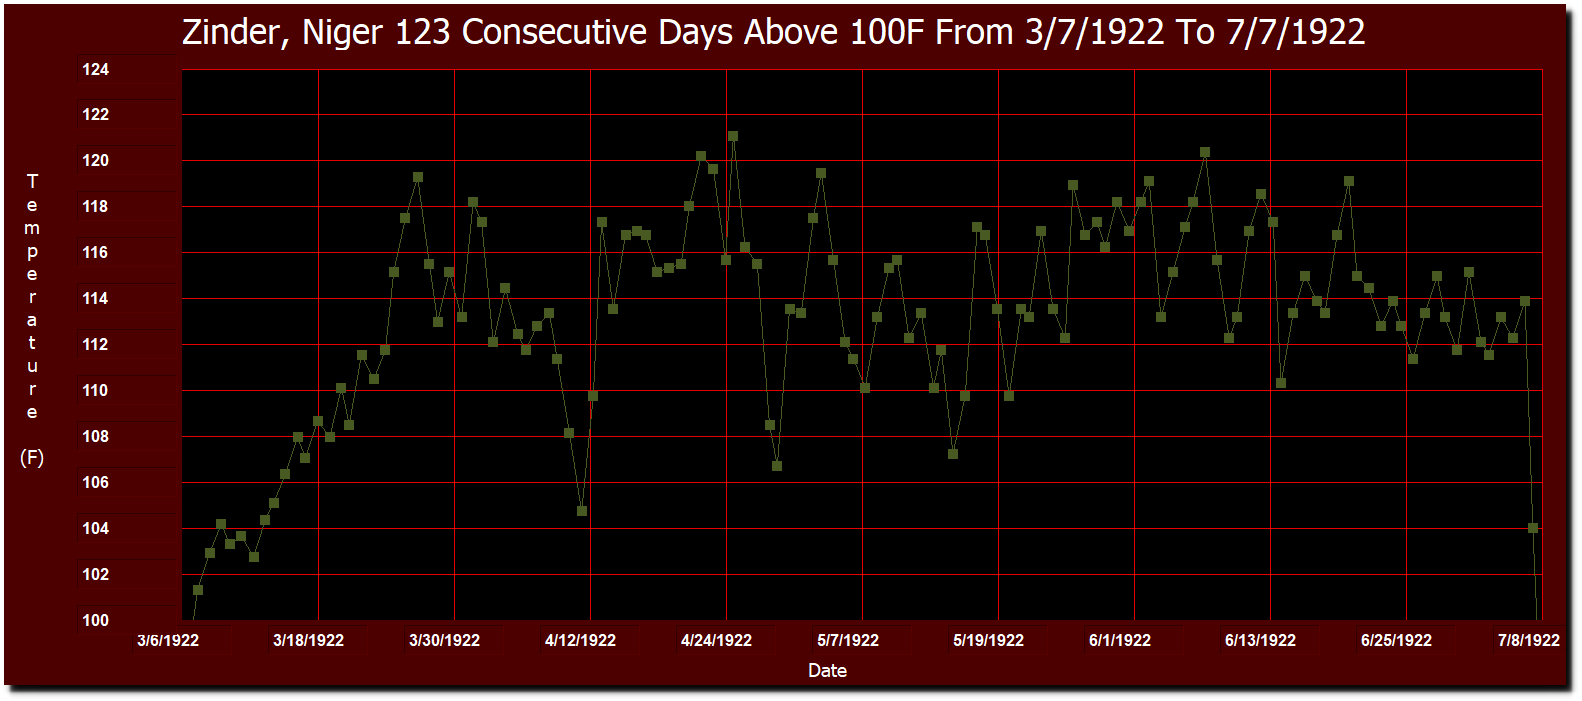
There is only one long-term GHCN station in the interior of Africa. It is located at Zinder, Niger. The record heatwave there was 123 consecutive days over 100F from March 7 to July 7, 1922 – peaking at 121F on April 22. Average maximum temperature during that stretch was 113F.

BOM used to have this web page up showing the world record heatwave of 1923-1924 at Marble Bar, West Australia.
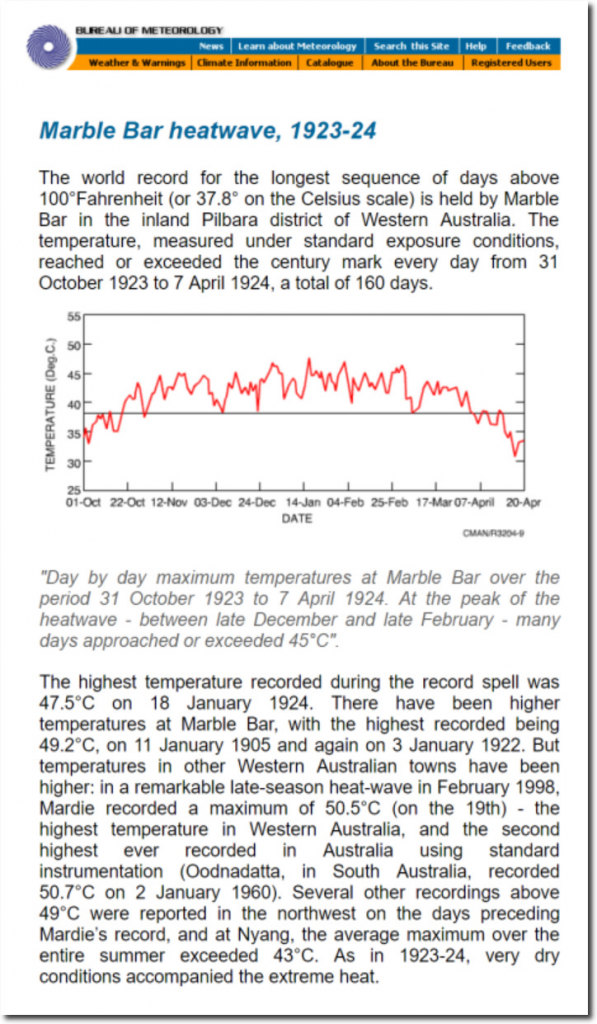
BOM – Australian Climate Extremes
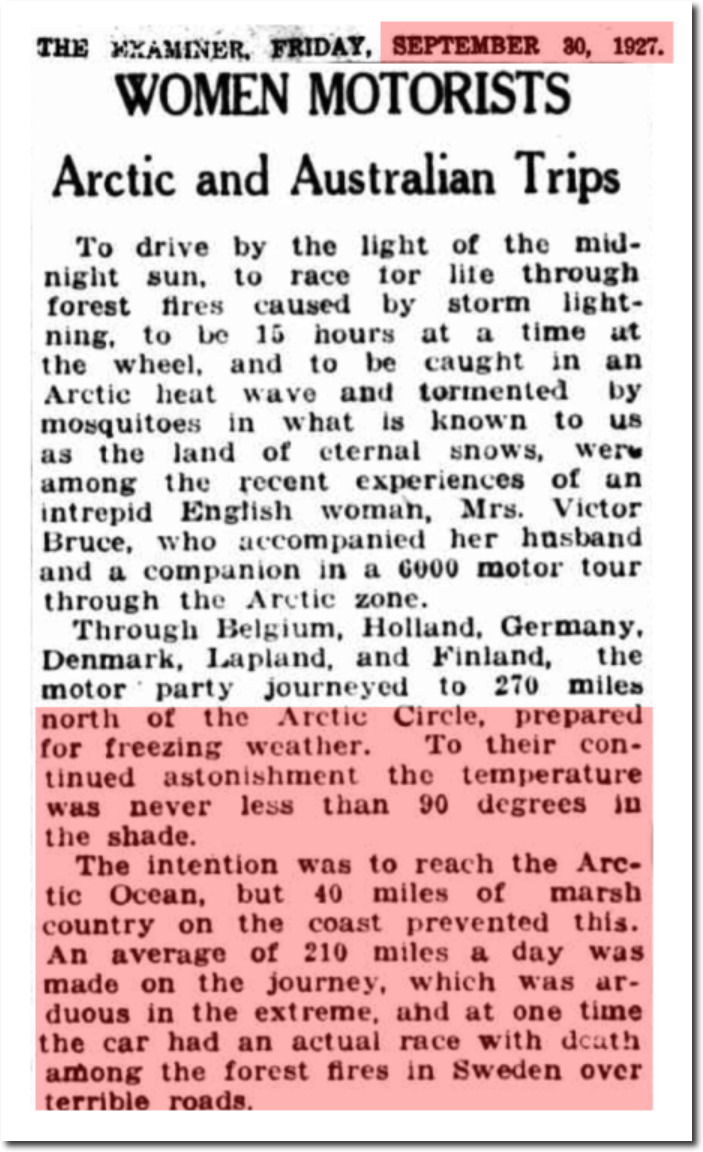
 30 Sep 1927 – WOMEN MOTORISTS – Trove

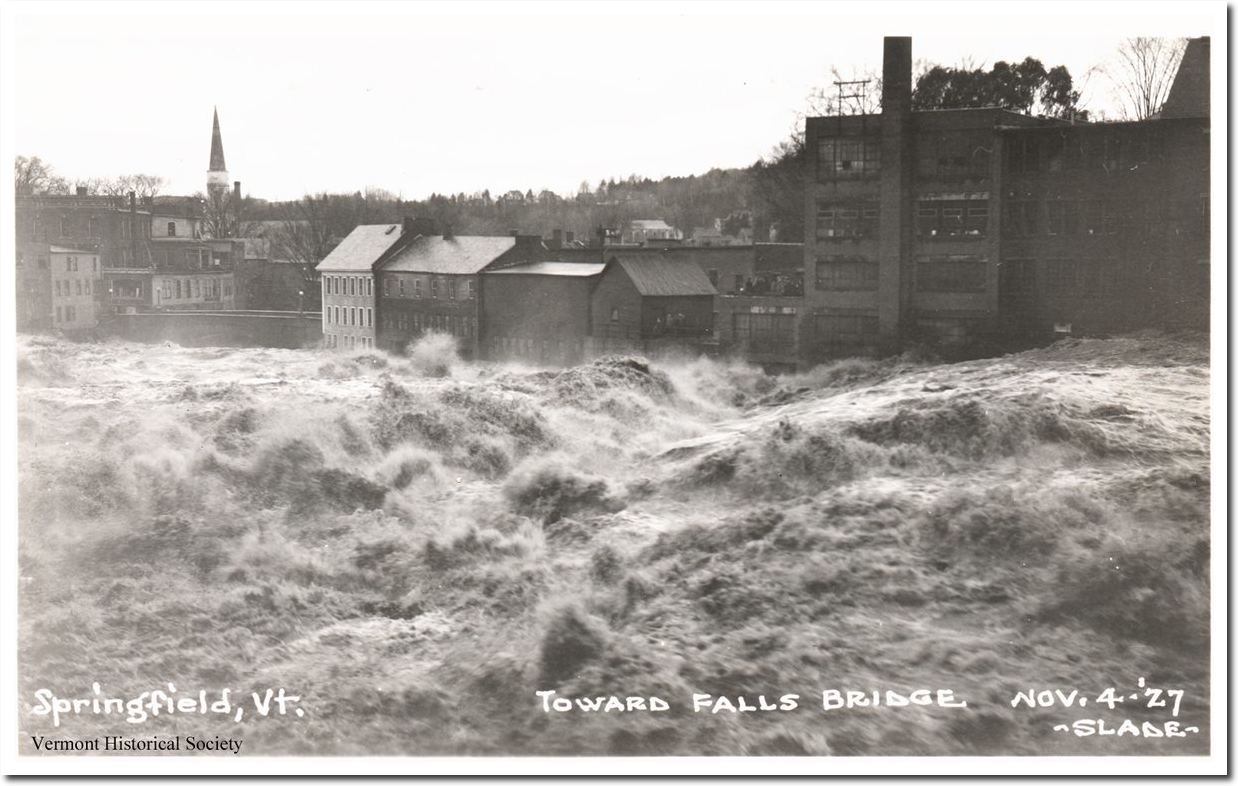
1927 brought the worst floods in US history. The Mississippi River was flooded for more than six months, forcing hundreds of thousands of people to abandon their homes permanently. Vermont’s worst flood on record occurred in November, 1927. The Red Cross described 1927 as the worst year in history, with 111 disasters – including 29 tornadoes, 24 floods, 9 hurricanes and 23 fires.
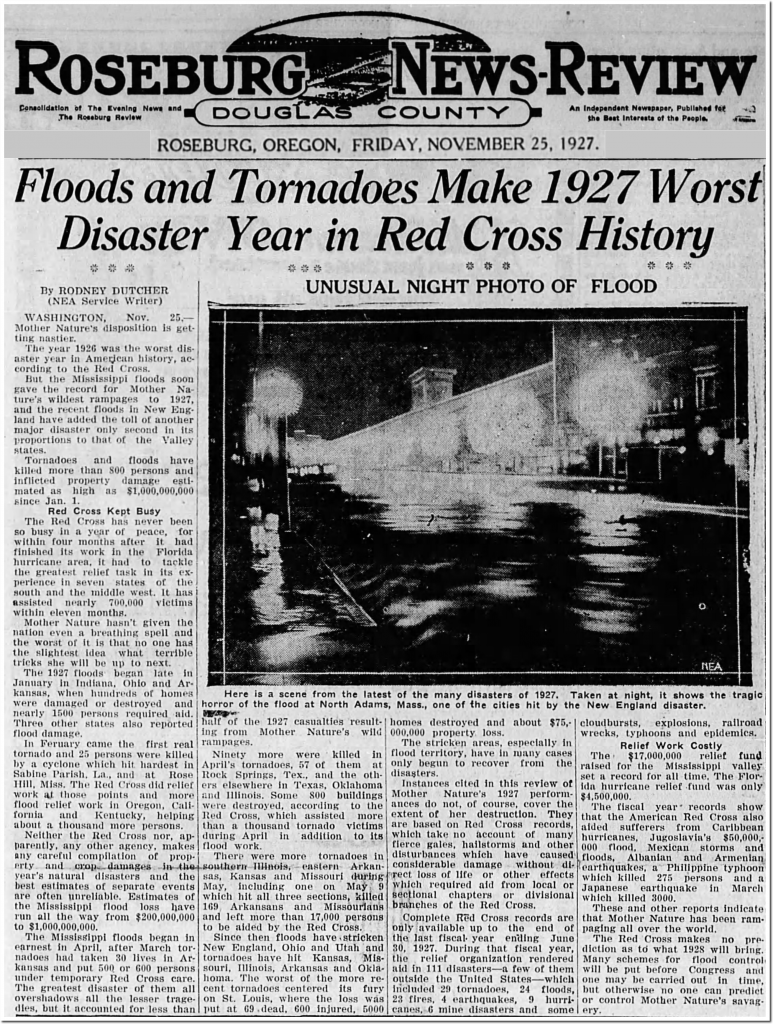
25 Nov 1927, Page 7 – The News-Review at Newspapers.com
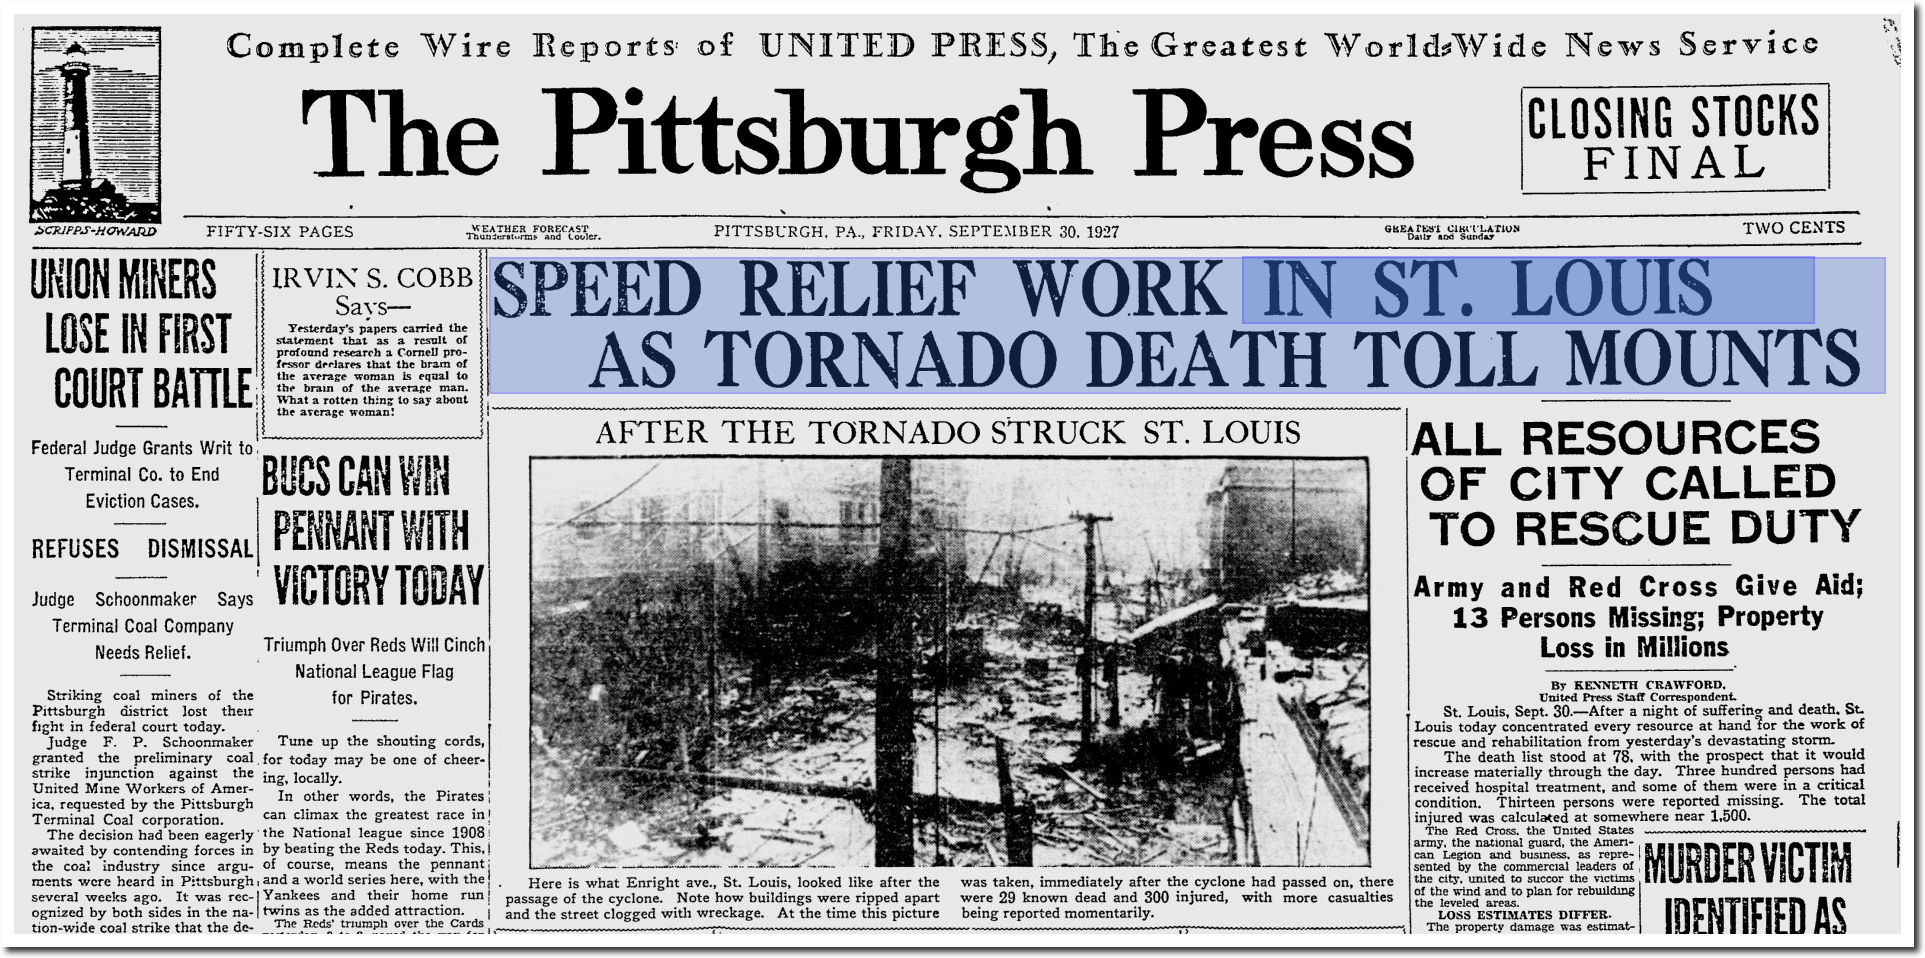
St. Louis was destroyed by a tornado.
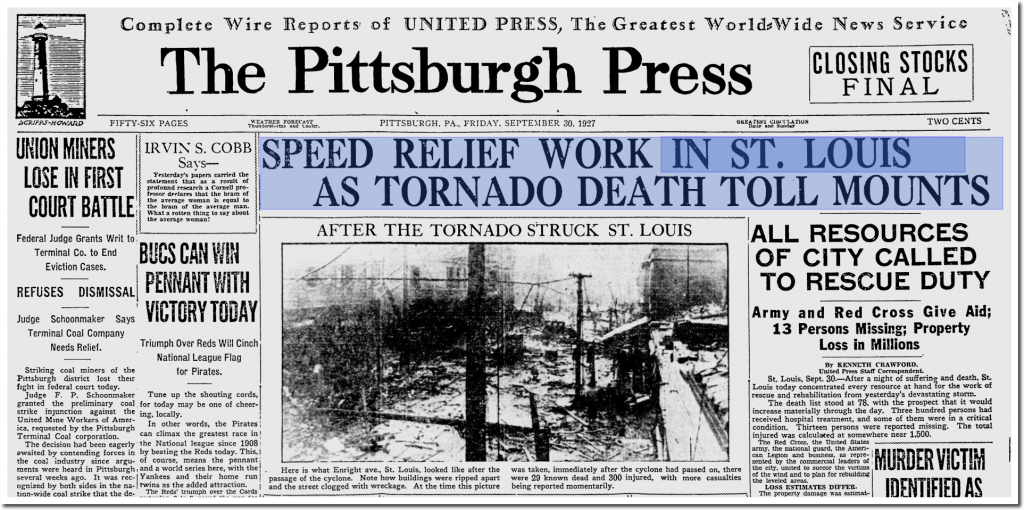
The Pittsburgh Press – Google News Archive Search
November flooding wiped out more than 1,000 bridges in Vermont, and drowned the Lieutenant Governor.

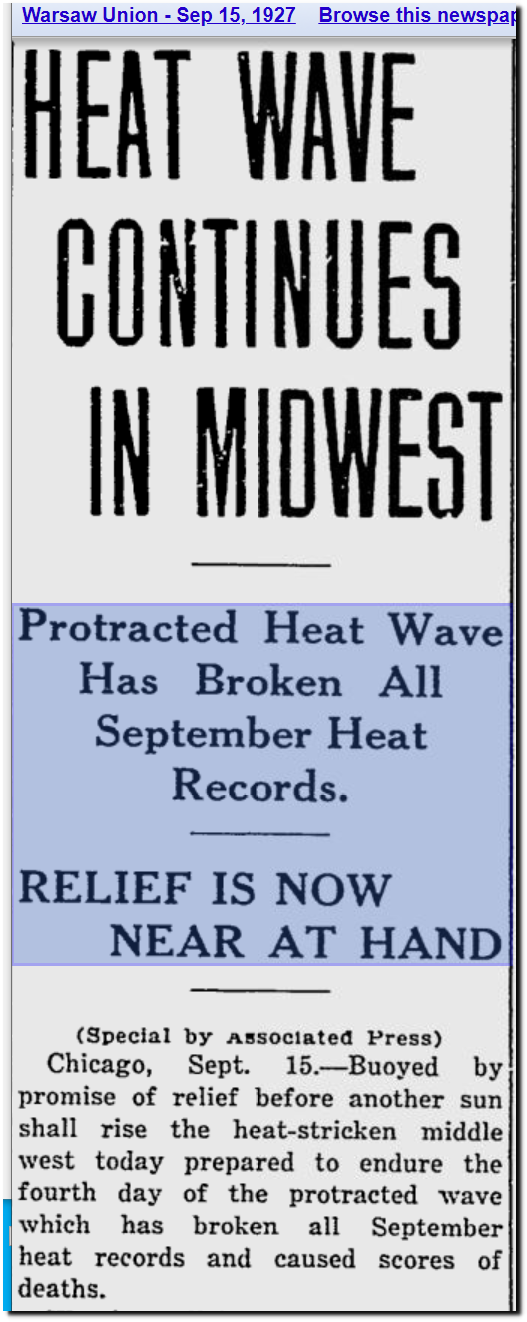
15 Sep 1927, 1 – The Gazette at Newspapers.com
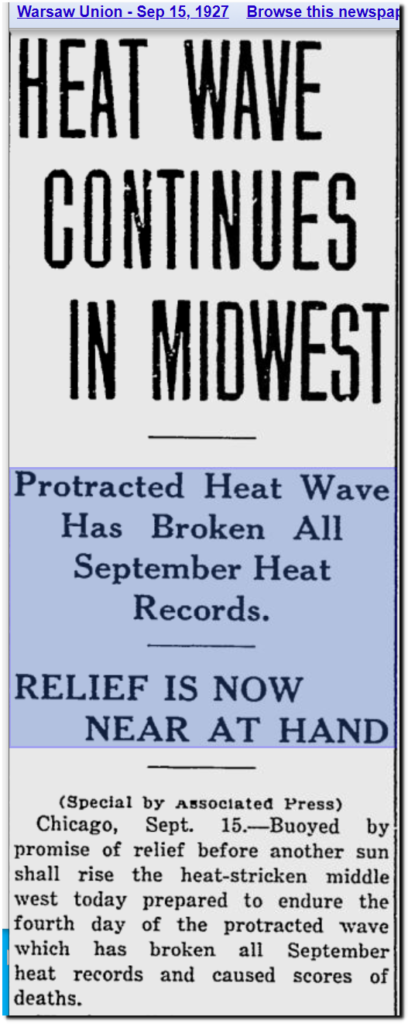
Warsaw Union – Google News Archive Search
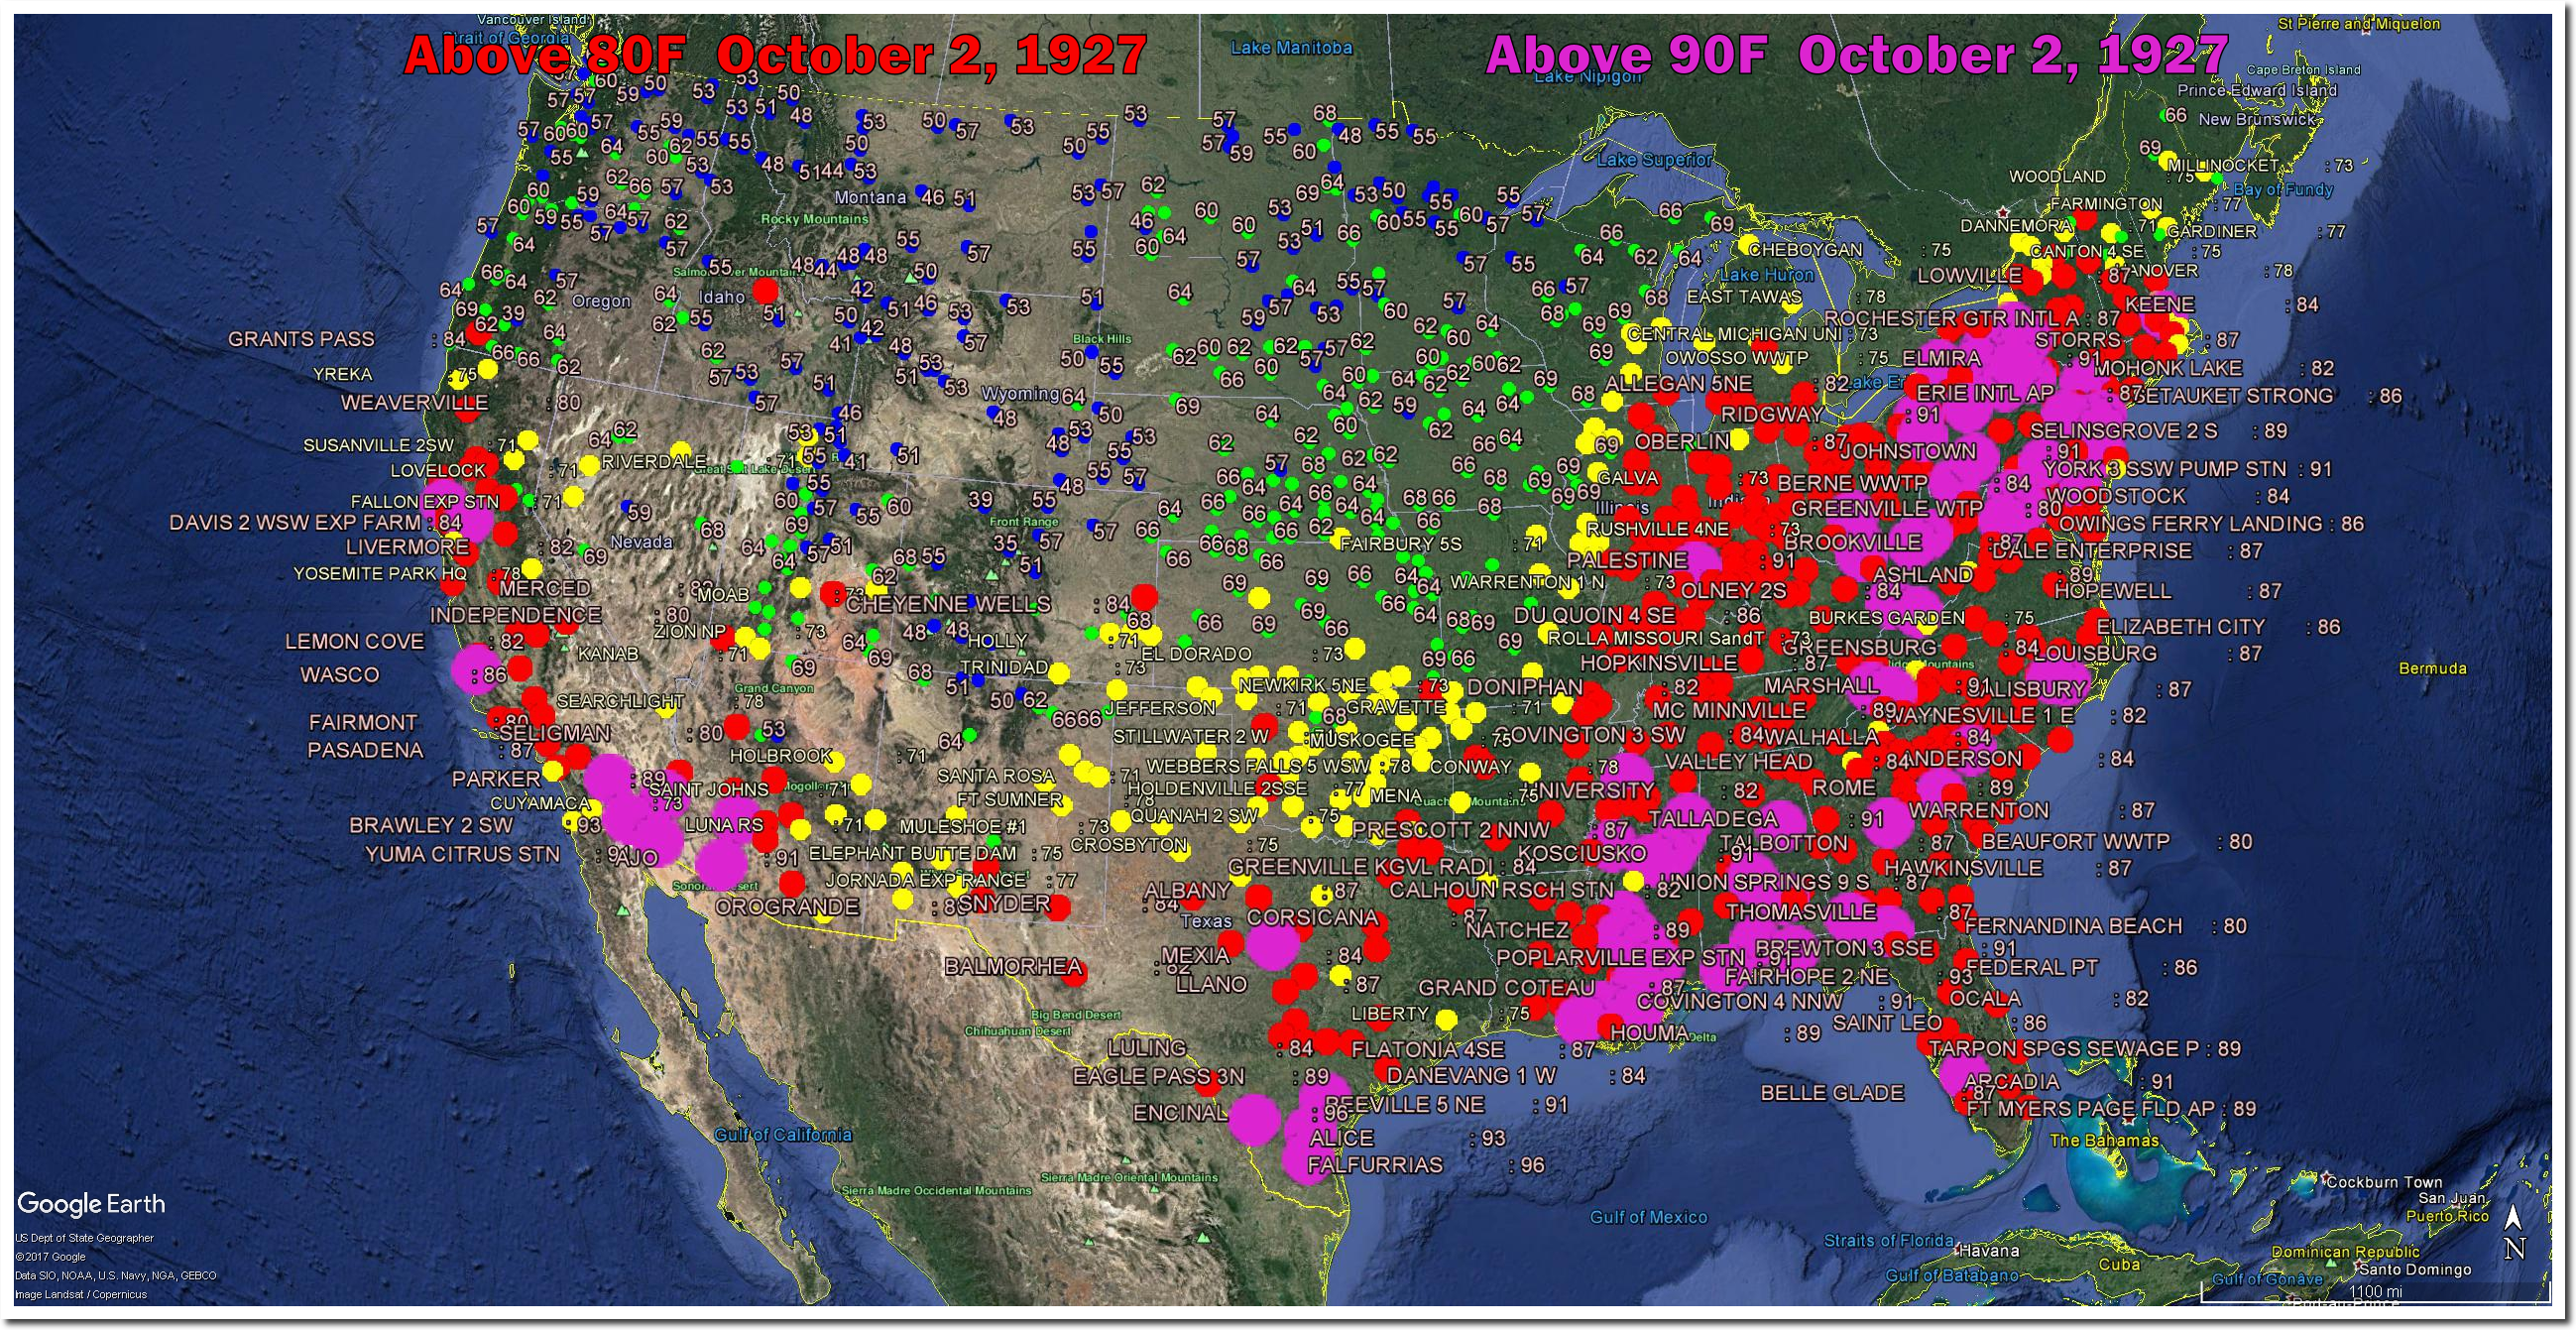
On October 2, 1927, temperatures in upstate New York reached 99 degrees.

And if all that wasn’t bad enough, children were happily sunbathing near the North Pole.
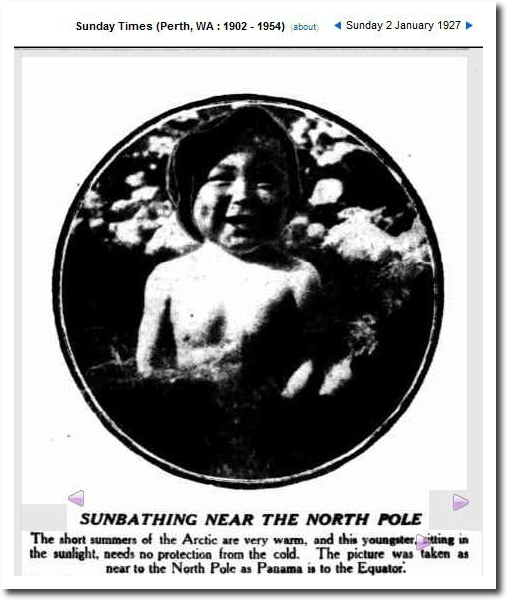
02 Jan 1927 – SUNBATHING NEAR THE NORTH POLE – Trove
NASA wants people to believe that the 1920s were cold and that the climate was stable and pleasant – but the historical record shows that their claims are not true. They also want people to believe that independent studies from NOAA and CRU back their work up. But when Senator Malcolm Roberts queried NASA about obviously fraudulent temperature adjustments in the Arctic, NASA’s Gavin Schmidt pointed the finger at NOAA and said he gets his data from them.
NASA chief slaps down climate sceptic senator Malcolm Roberts: ‘You hold a number of misconceptions’
robertsnasags.pdf
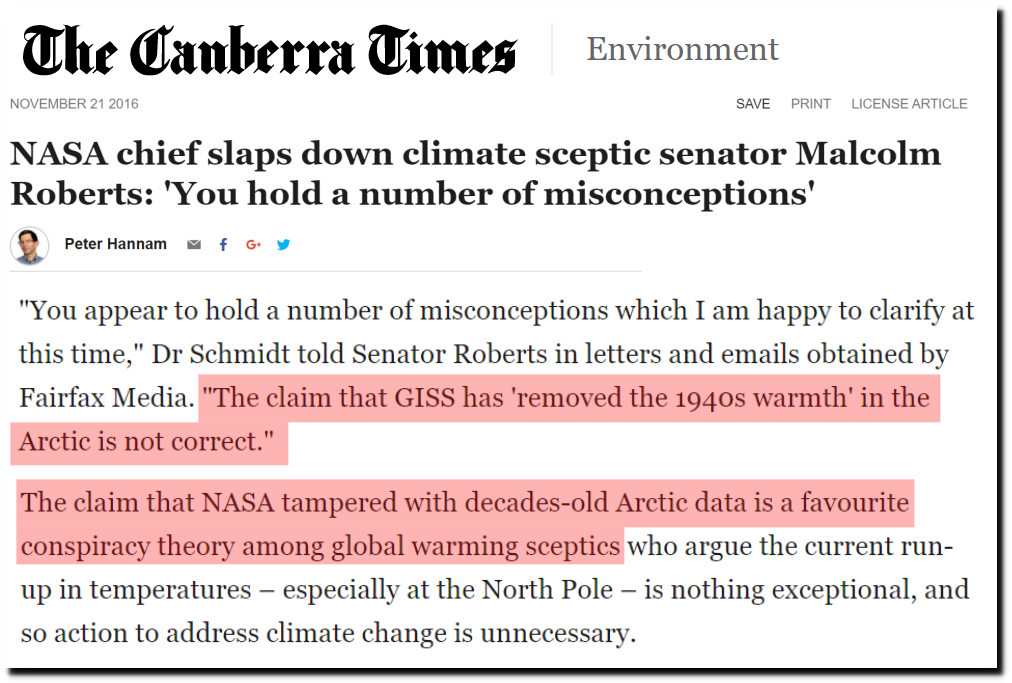
NASA is constantly altering temperature data. This is the raw temperature data from Reykjavik, Iceland.
V2 Measured
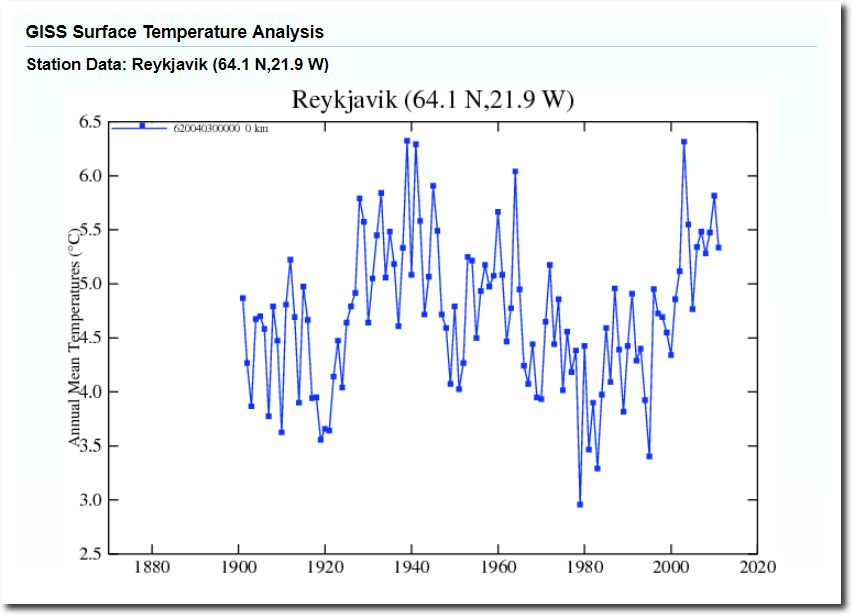
And this is how NASA altered the data in 2018. They have since changed this graph again. Peter Hannam called what NASA was doing in plain site “conspiracy theory.”
V2 Adjusted
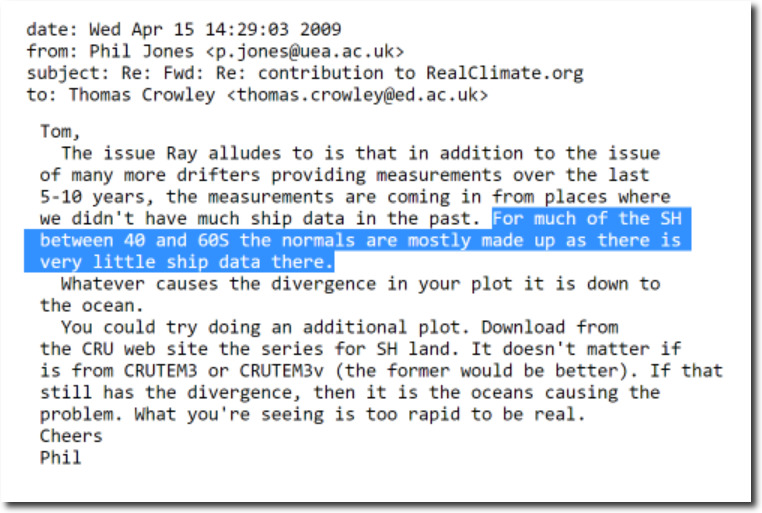
There is nothing independent about the data sets. This climategate email shows that different government agencies openly colluded to tamper with the temperature record and remove the warmth in the first half of the century.

di2.nu/foia/1254108338.txt
And they also fabricate data.
di2.nu/foia/foia2011/mail/2729.txt
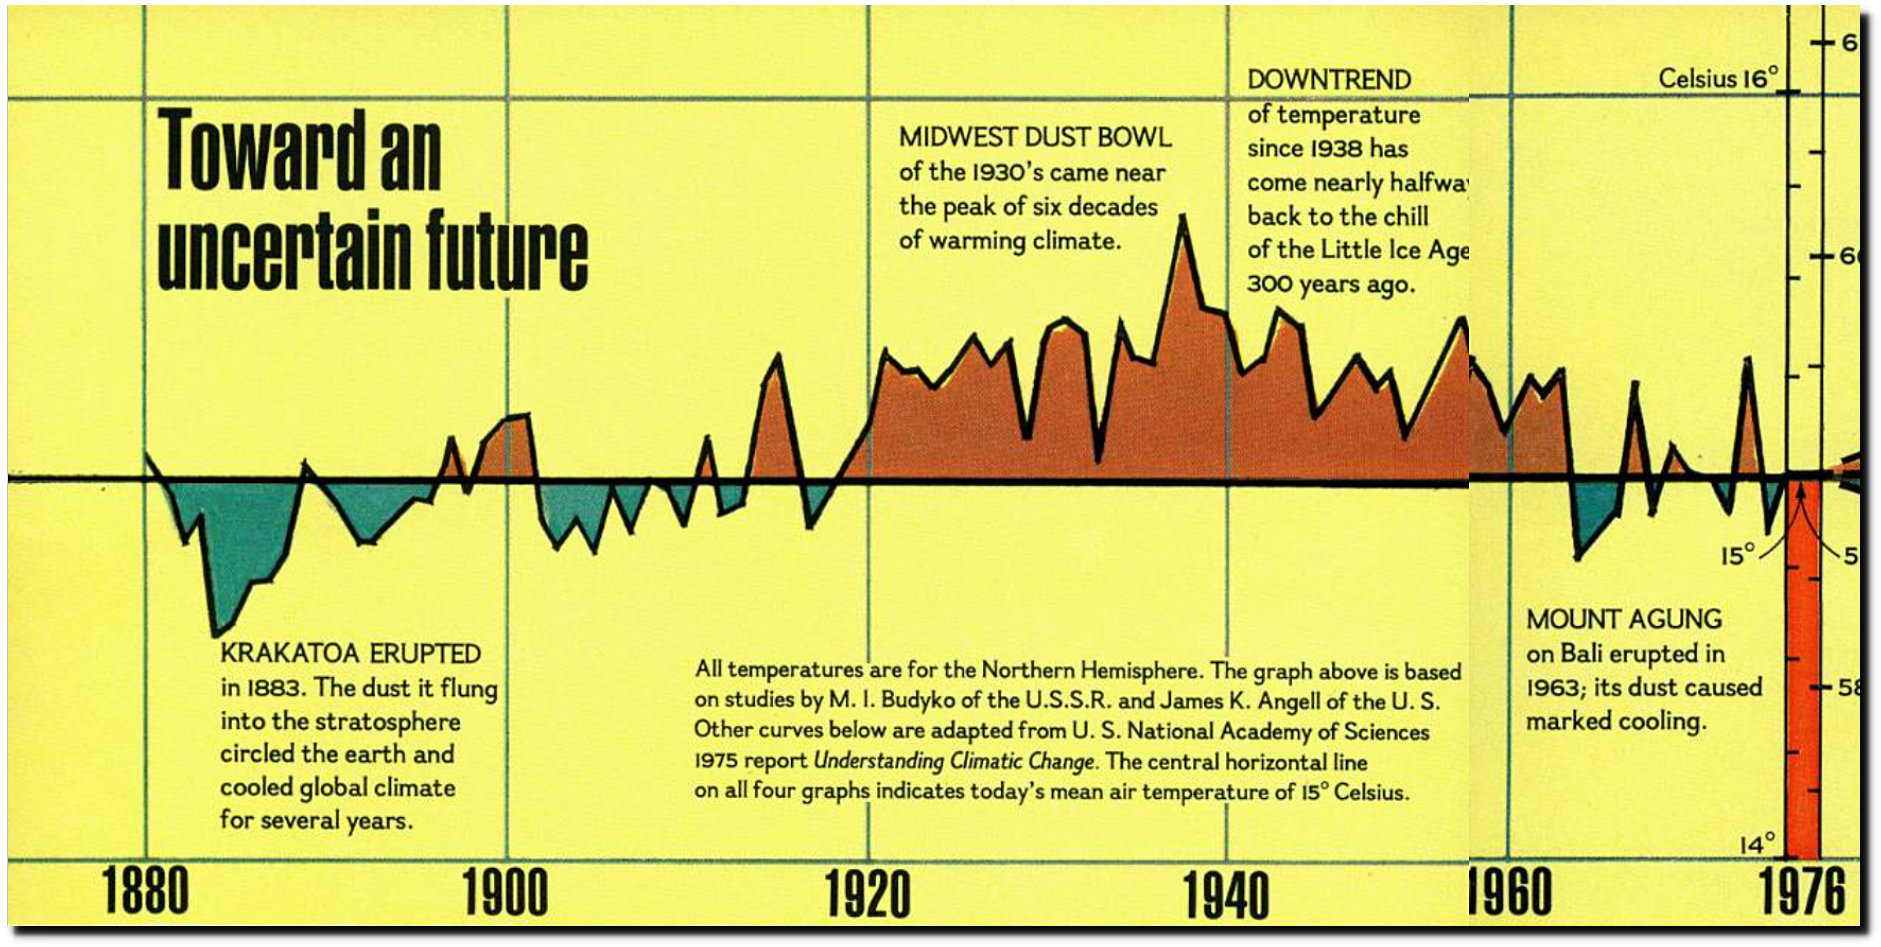
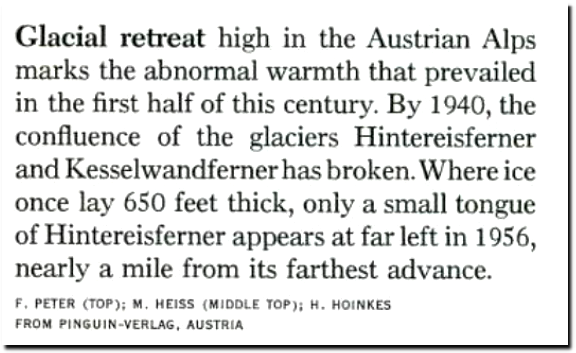
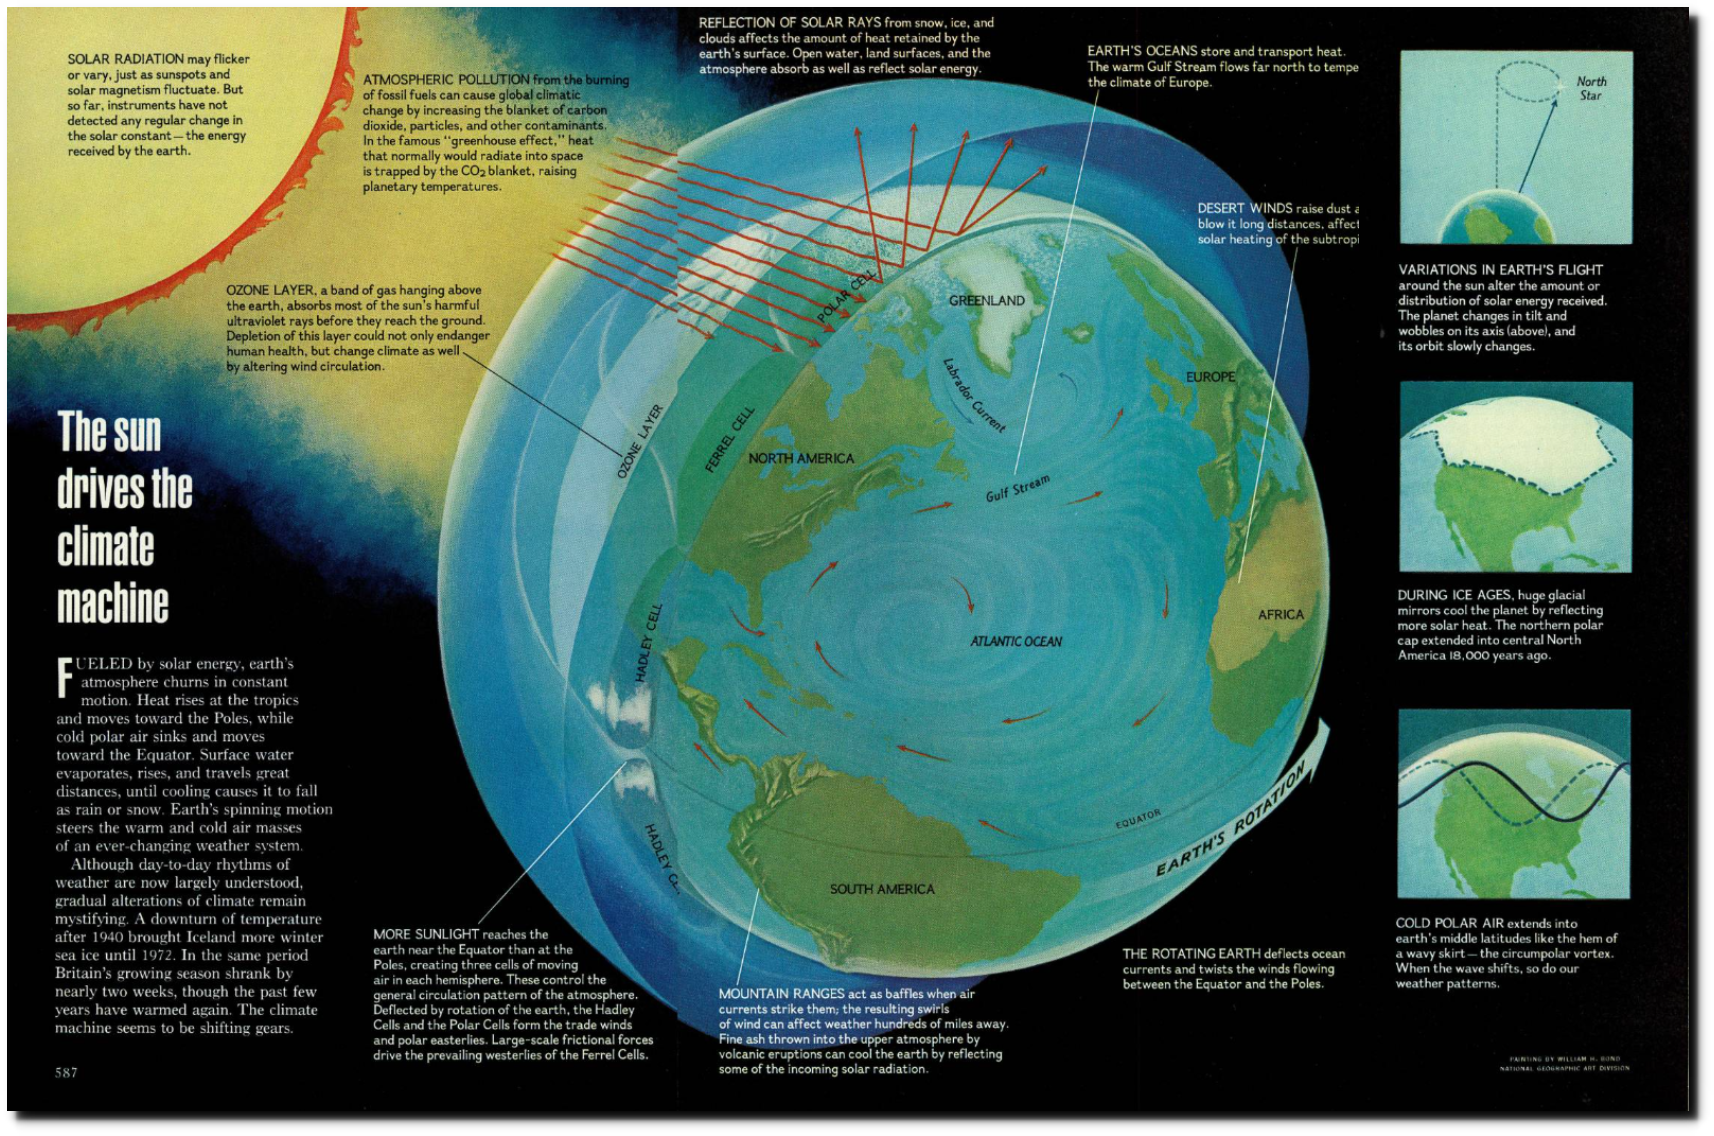
In the November, 1976 issue of National Geographic they showed that Earth was very warm from 1920 until the early 1960s.

National Geographic Magazine Archive
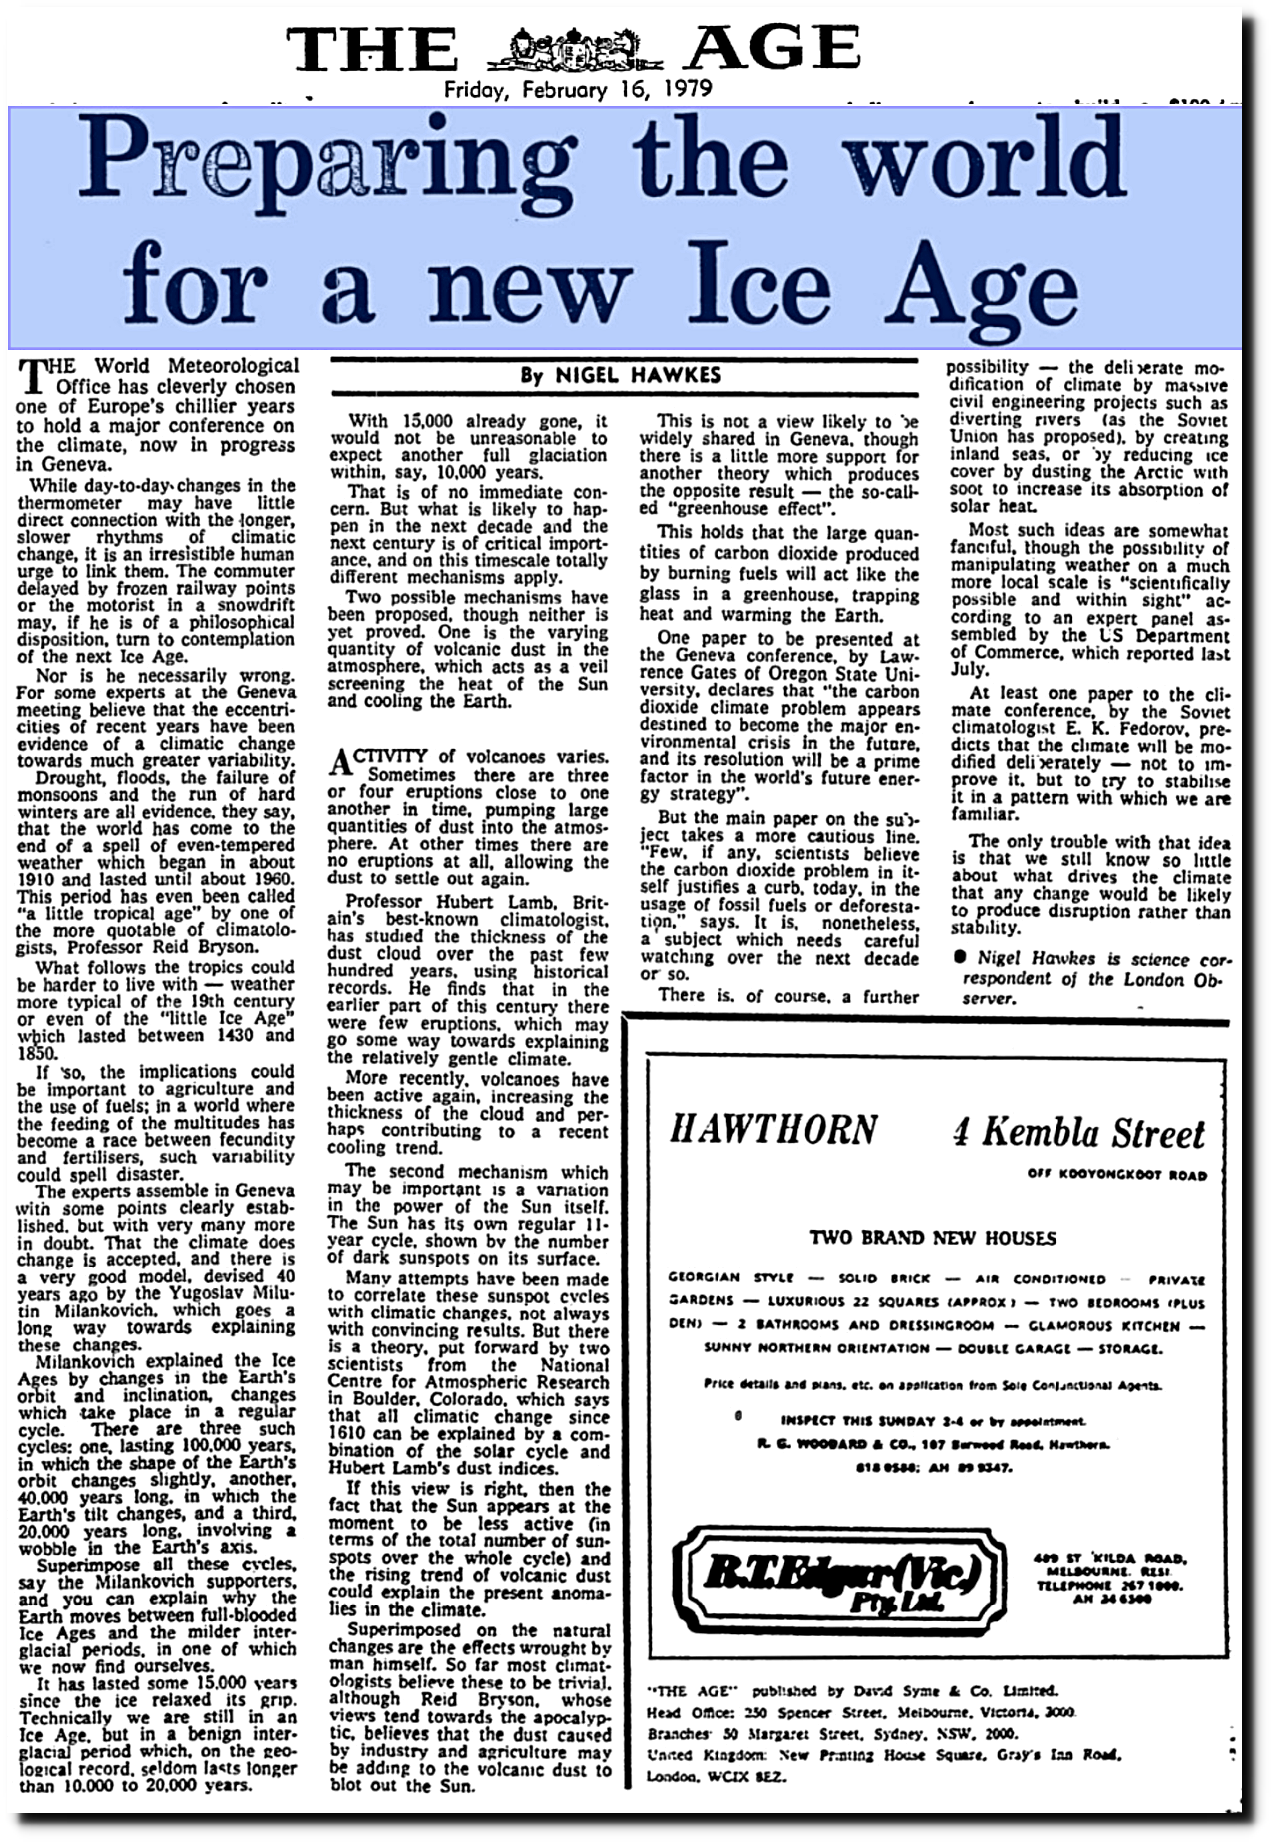
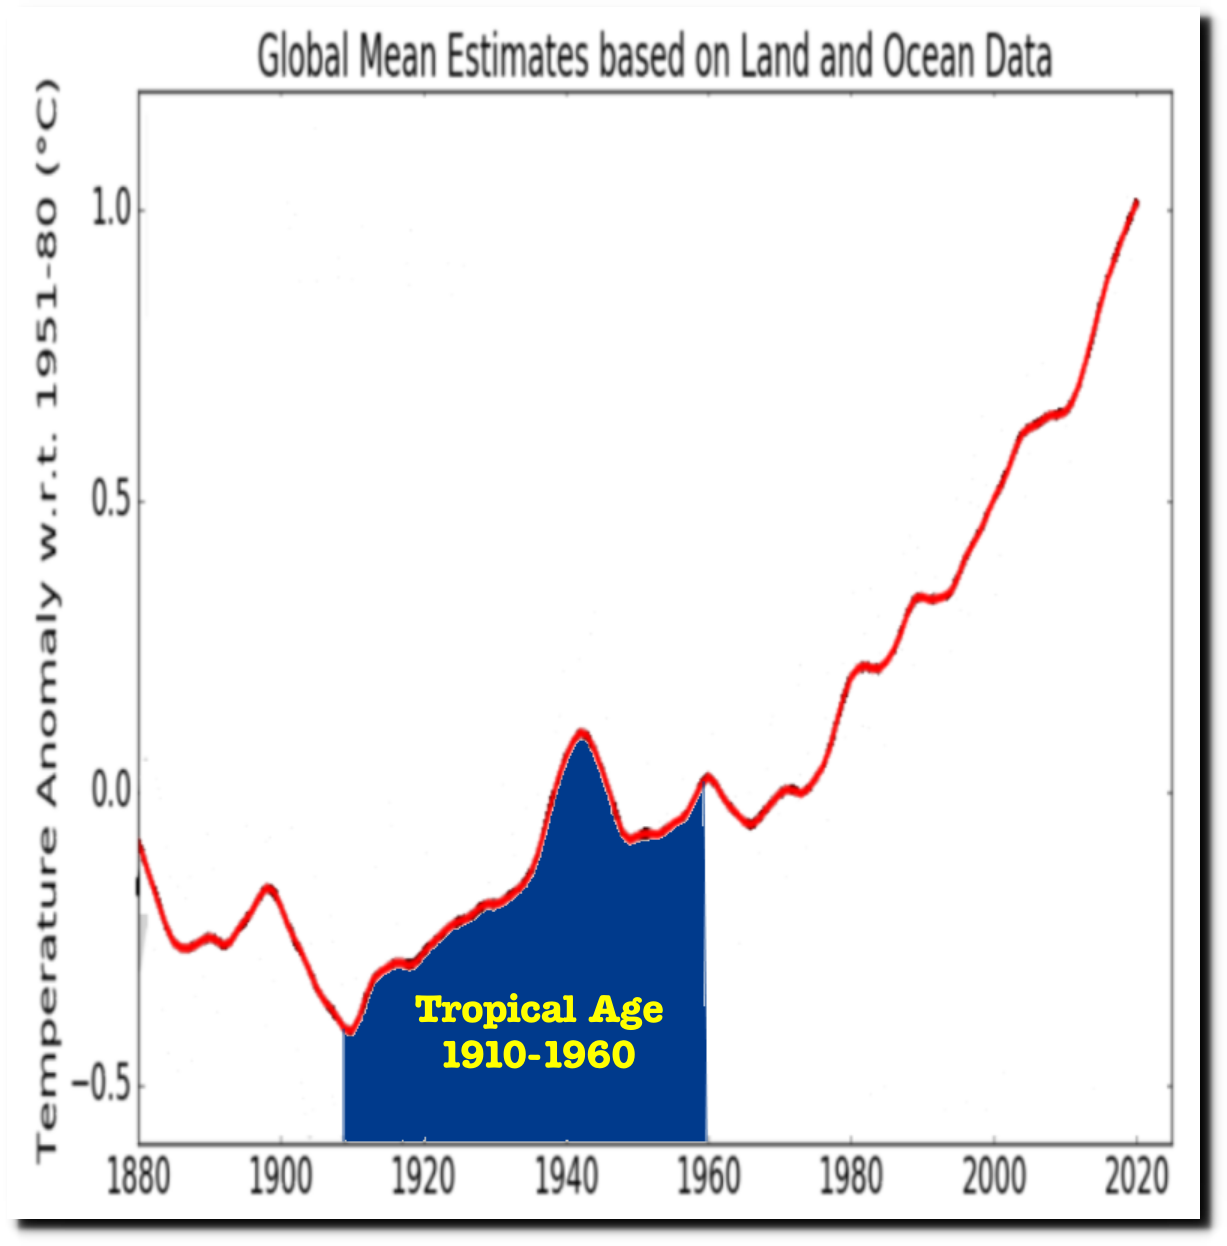
In 1979, climatologists described the warm period from 1910-1960 as the “tropical age” – and said the extreme weather of the previous two decades was caused by global cooling.
“Drought, floods, the failure of monsoons and the run of hard winters are all evidence. they say, that the world has come to the end of a spell of even-tempered weather which began in about 1910 and lasted until about 1960. This period has even been called “a little tropical age” by one of the more quotable of climatologists. Professor Reid Bryson. What follows the tropics could be harder to live with — weather more typical of the 19th century or even of the “little Ice Age “which lasted between 1430 and 1850”
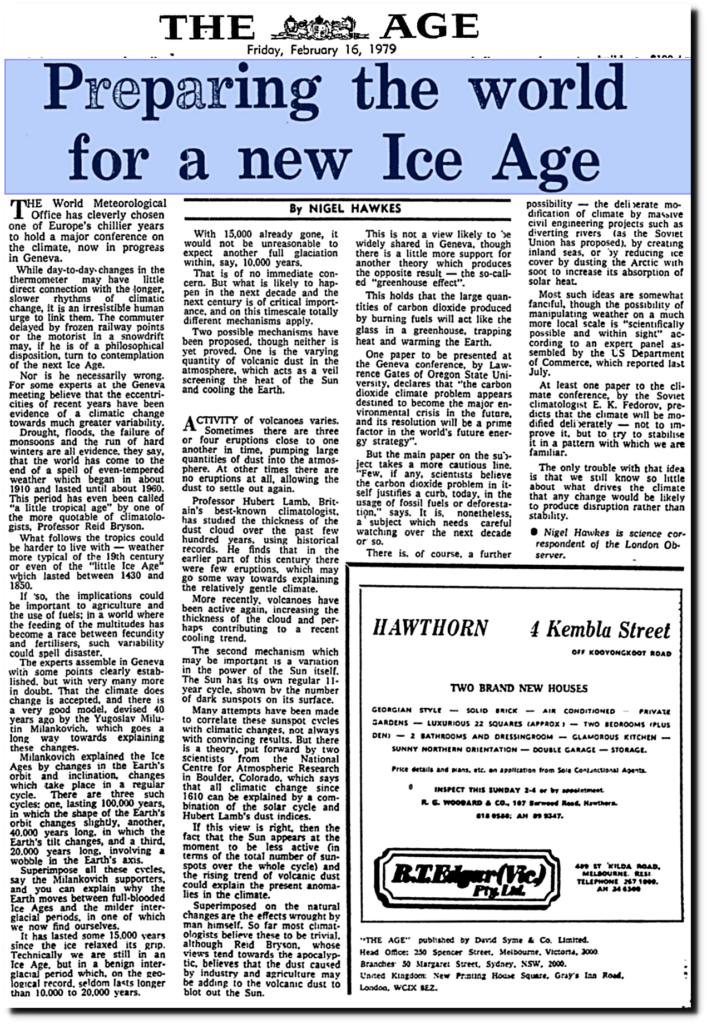
The Age – Google News Archive Search
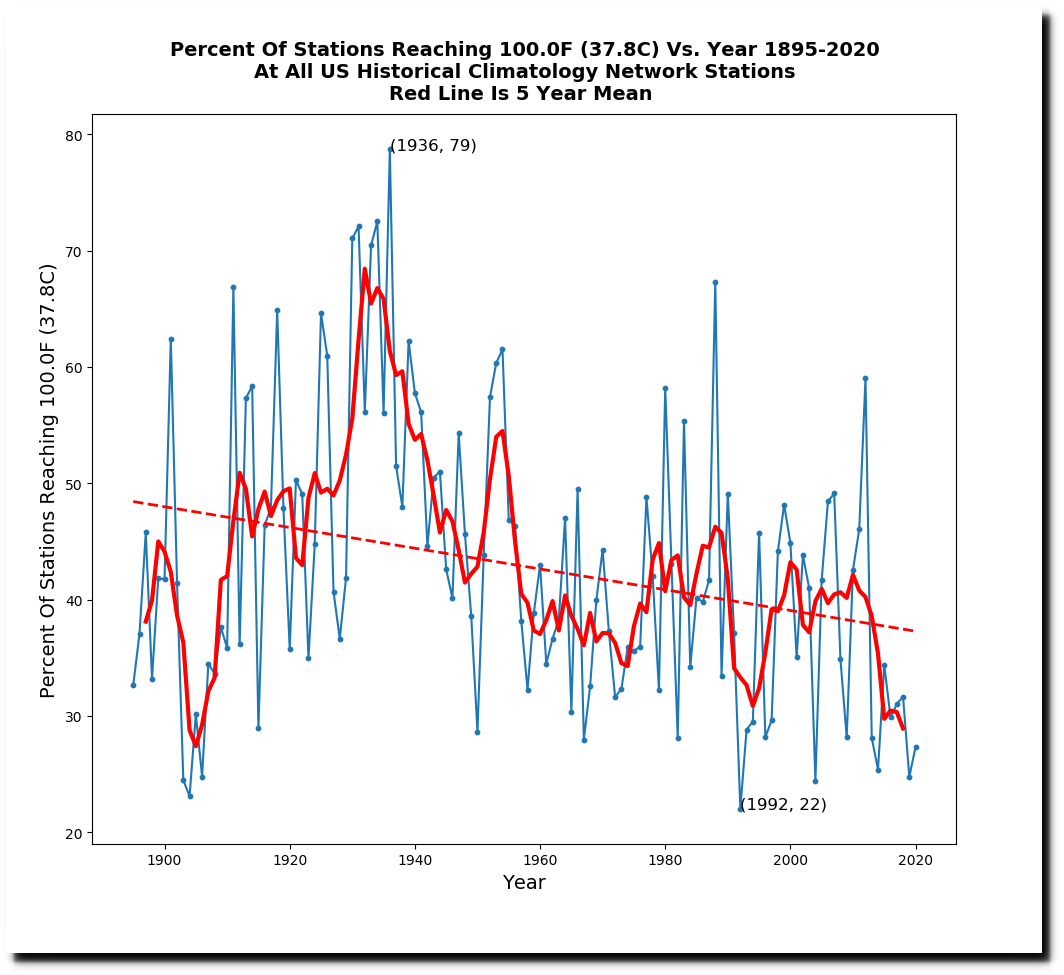
The warm period from 1910 to 1960 can be seen very clearly in this graph. During that time, about half of the US would reach 100F (38C) sometime during the year. But over the past 60 years that number has been closer to 40 percent – with the last decade being close to a record low.

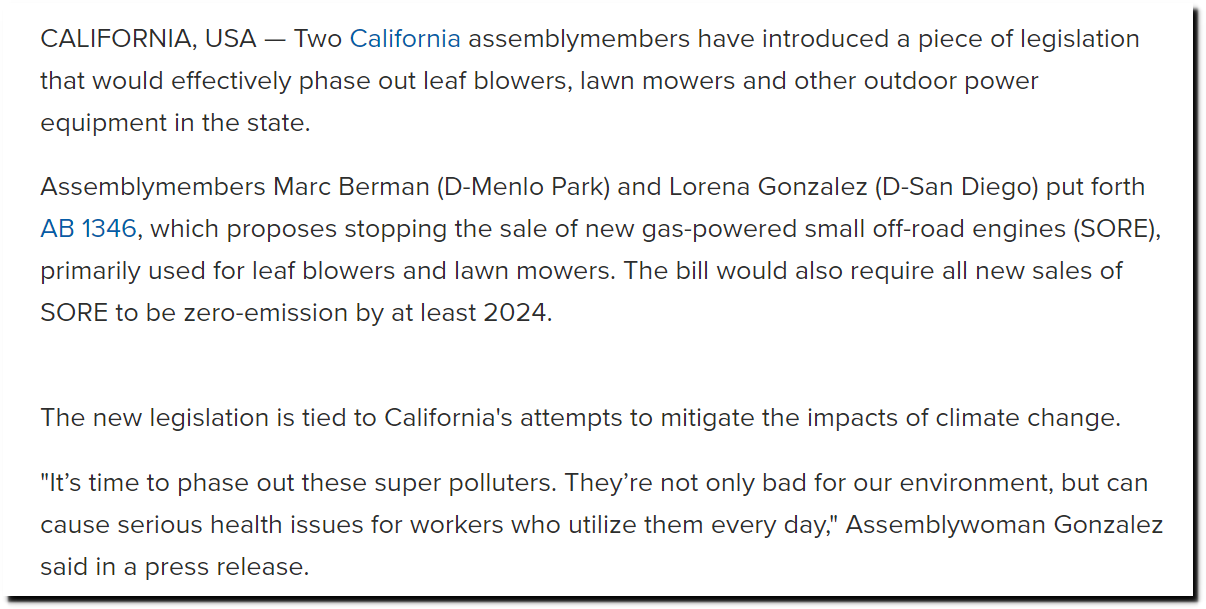
The bottom line is that NASA and NOAA temperature graphs are not even remotely credible and they are colluding to alter the data. Their propaganda has been effective, driving world leaders to complete madness.
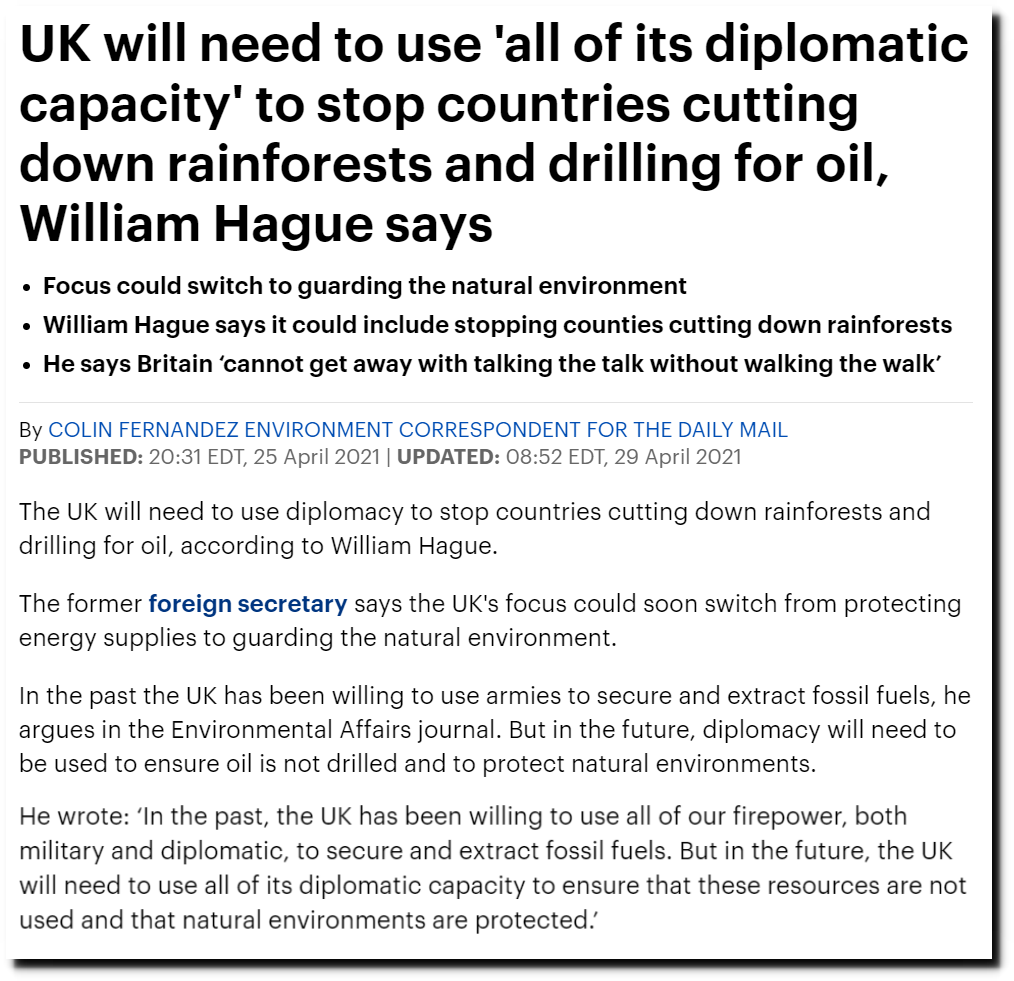
The UK will need to use diplomacy to stop countries cutting down rainforests, William Hague says | Daily Mail Online


