
Disrupting the Borg is expensive and time consuming!

Google Search
-
Recent Posts
- Analyzing The Western Water Crisis
- Gaslighting 1924
- “Why Do You Resist?”
- Climate Attribution Model
- Fact Checking NASA
- Fact Checking Grok
- Fact Checking The New York Times
- New Visitech Features
- Ice-Free Arctic By 2014
- Debt-Free US Treasury Forecast
- Analyzing Big City Crime (Part 2)
- Analyzing Big City Crime
- UK Migration Caused By Global Warming
- Climate Attribution In Greece
- “Brown: ’50 days to save world'”
- The Catastrophic Influence of Bovine Methane Emissions on Extraterrestrial Climate Patterns
- Posting On X
- Seventeen Years Of Fun
- The Importance Of Good Tools
- Temperature Shifts At Blue Hill, MA
- CO2²
- Time Of Observation Bias
- Climate Scamming For Profit
- Climate Scamming For Profit
- Back To The Future
March 2026 M T W T F S S 1 2 3 4 5 6 7 8 9 10 11 12 13 14 15 16 17 18 19 20 21 22 23 24 25 26 27 28 29 30 31 Recent Comments
- arn on Analyzing The Western Water Crisis
- Bob G on Analyzing The Western Water Crisis
- Bob G on Analyzing The Western Water Crisis
- Bob G on Analyzing The Western Water Crisis
- Hank Phillips on Analyzing The Western Water Crisis
- Hank Phillips on Analyzing The Western Water Crisis
- Hank Phillips on Analyzing The Western Water Crisis
- Hank Phillips on Analyzing The Western Water Crisis
- Bob G on Analyzing The Western Water Crisis
- conrad ziefle on Analyzing The Western Water Crisis
NOAA/BOM Data Tampering Update
Last year tied with 1912 for second coolest year on record in the US.
After data tampering by NOAA, it became the 54th warmest.
Climate at a Glance | National Centers for Environmental Information (NCEI)
Jo Nova reports on BOM doing the same thing in Australia.
Posted in Uncategorized
Leave a comment
Tornado Outbreak Of February 21, 1971
On this date in 1971, a massive tornado outbreak and snowstorm caused hundreds of casualties in the US.
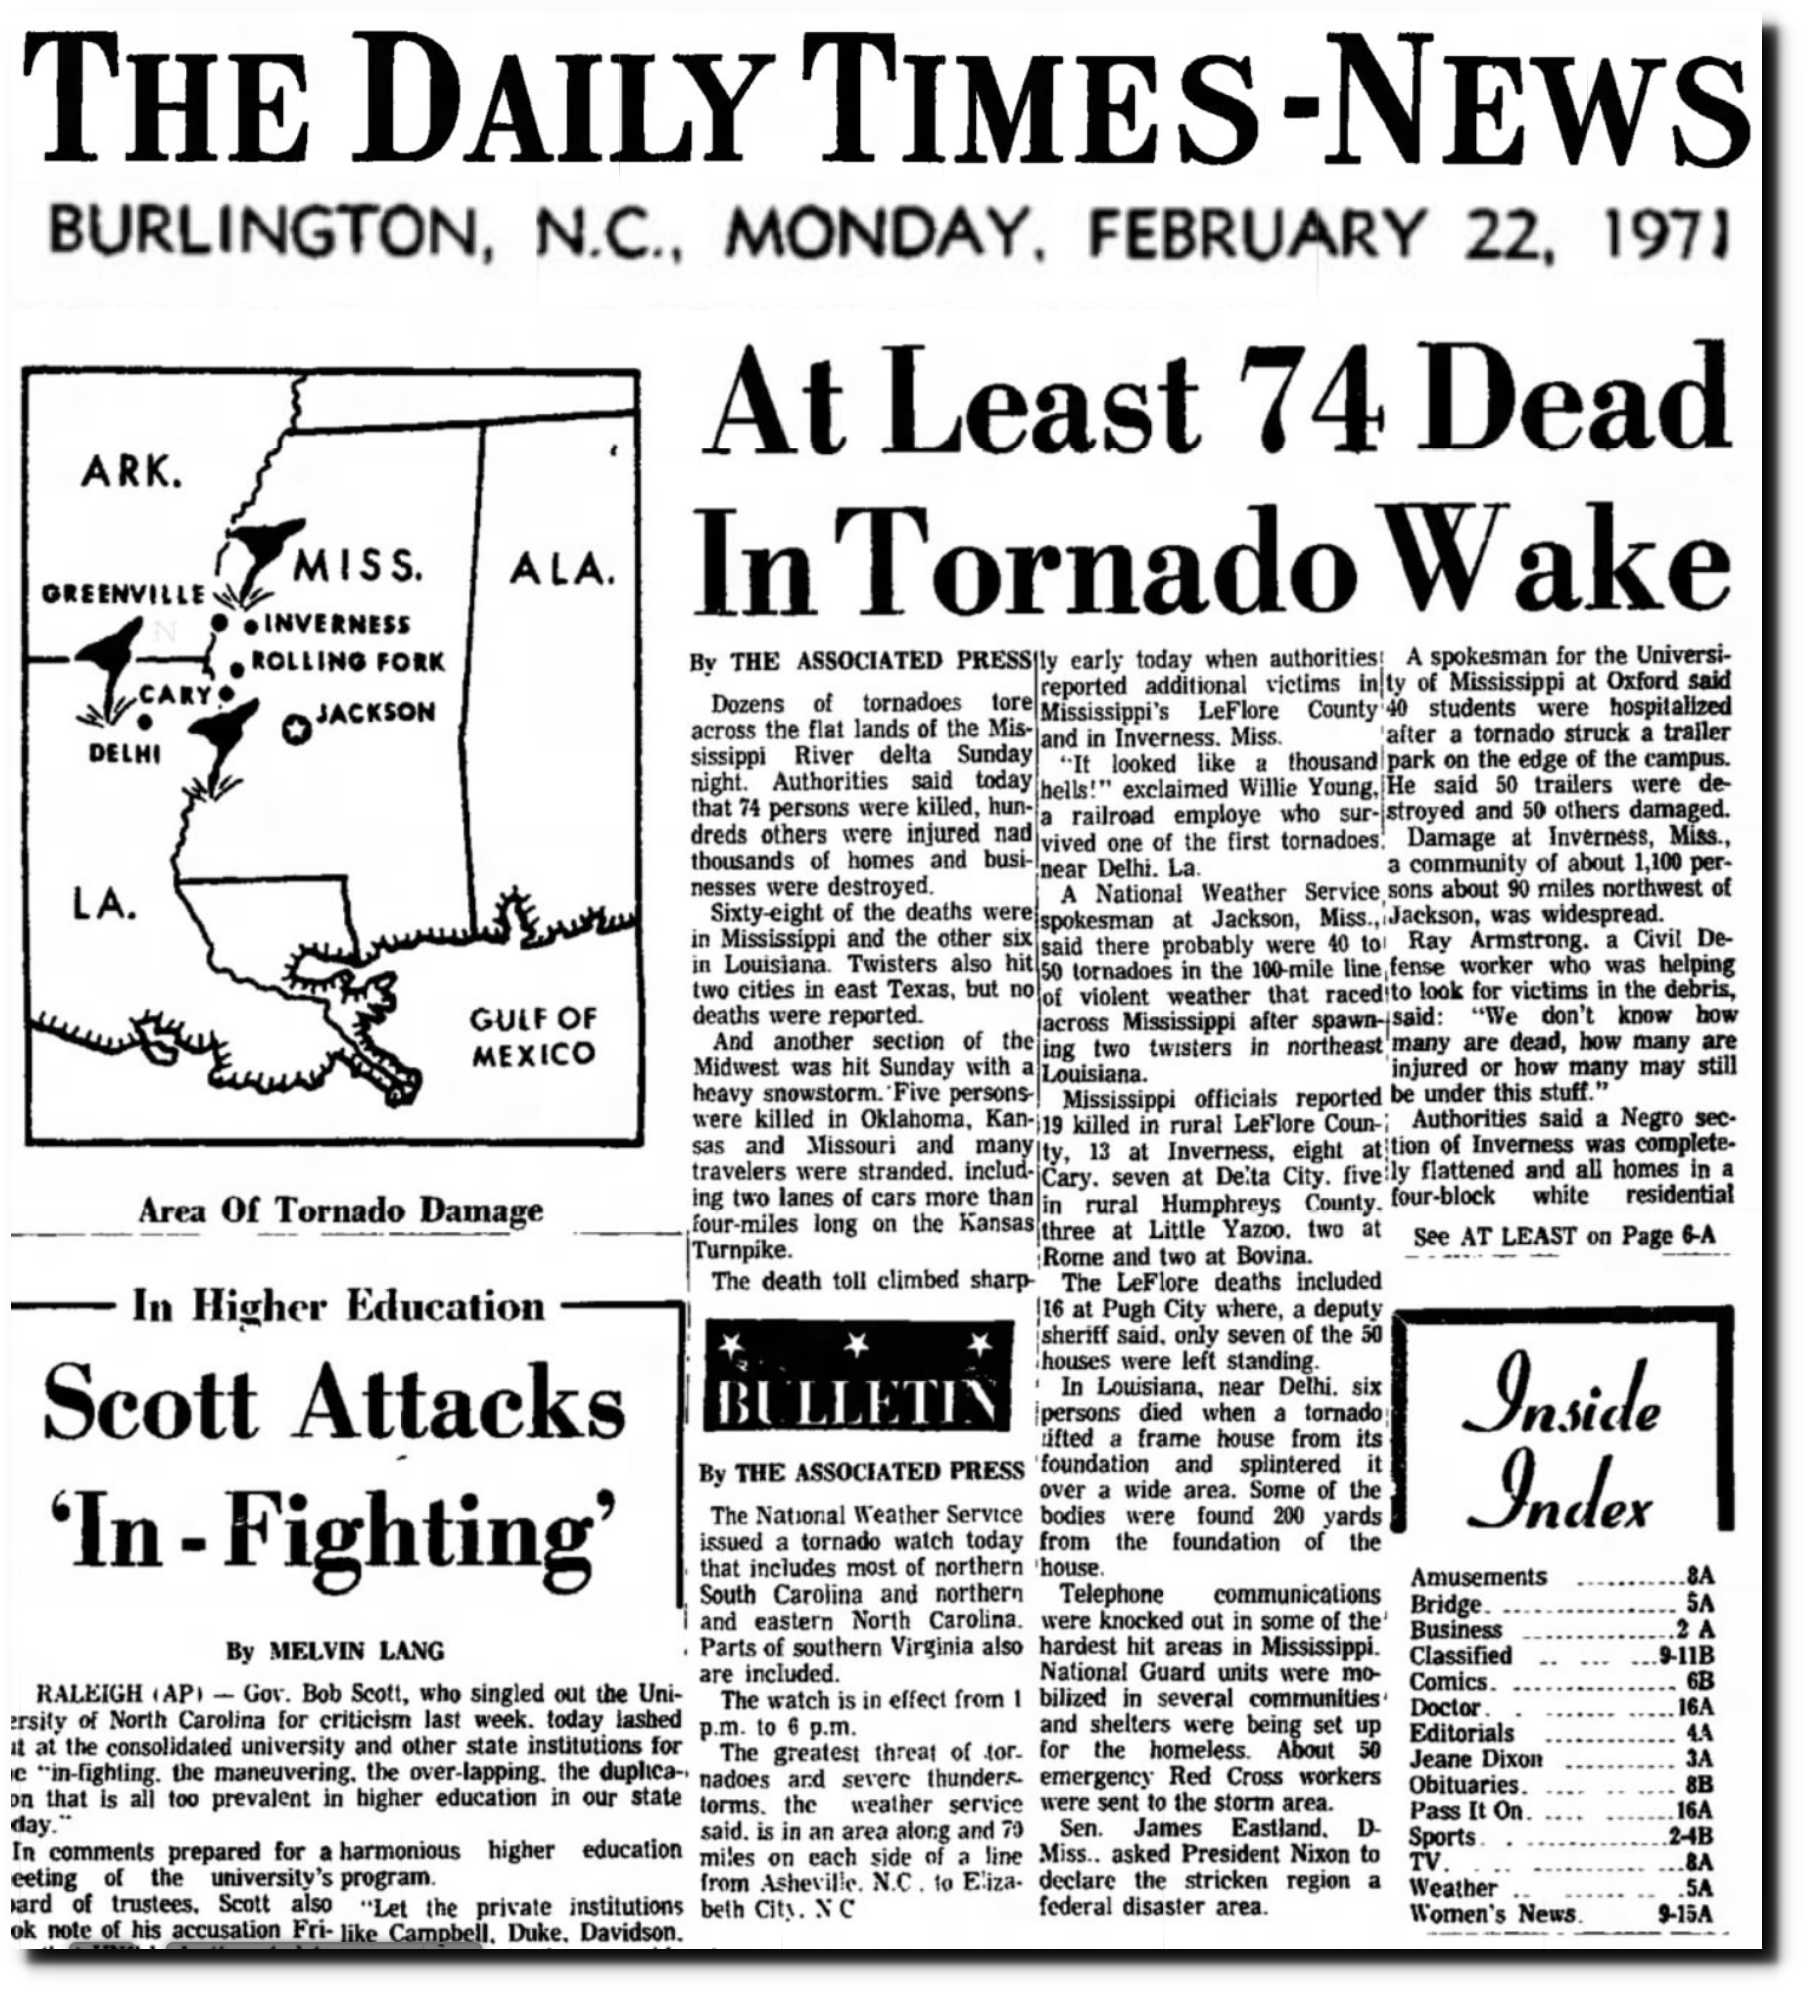
21 Feb 1971, Page 1 – The Daily Times-News at Newspapers.com
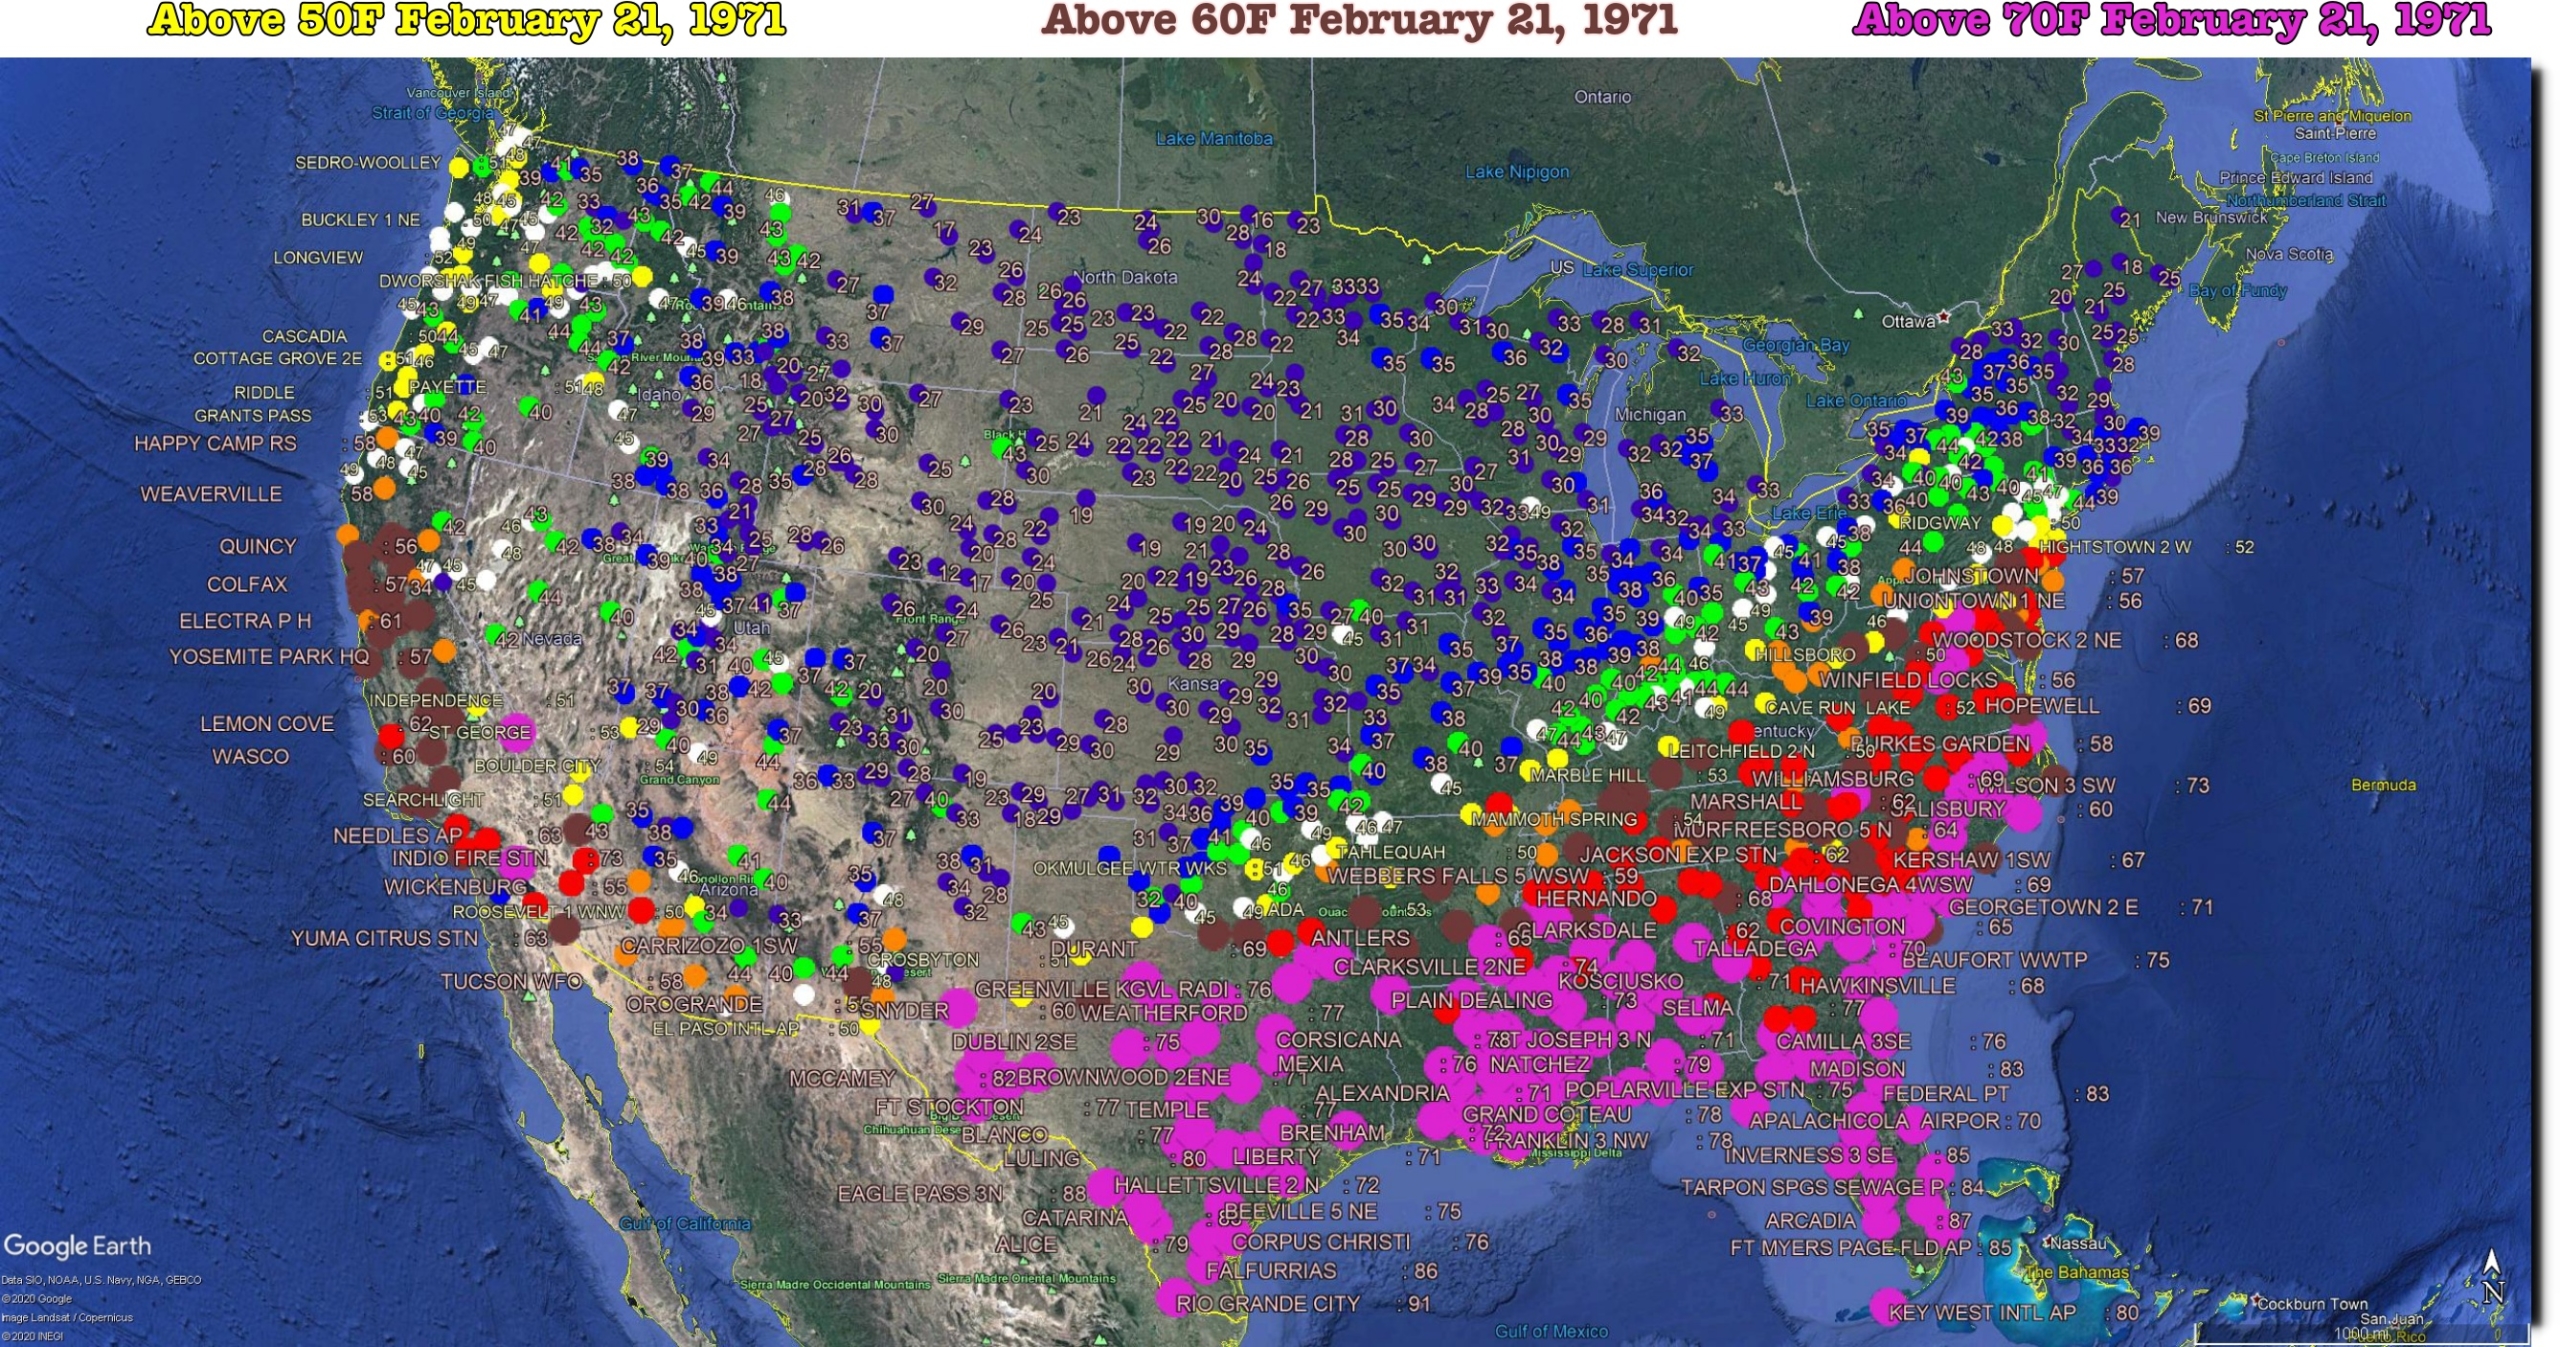
A cold Arctic air mass collided with warm humid air in the south.
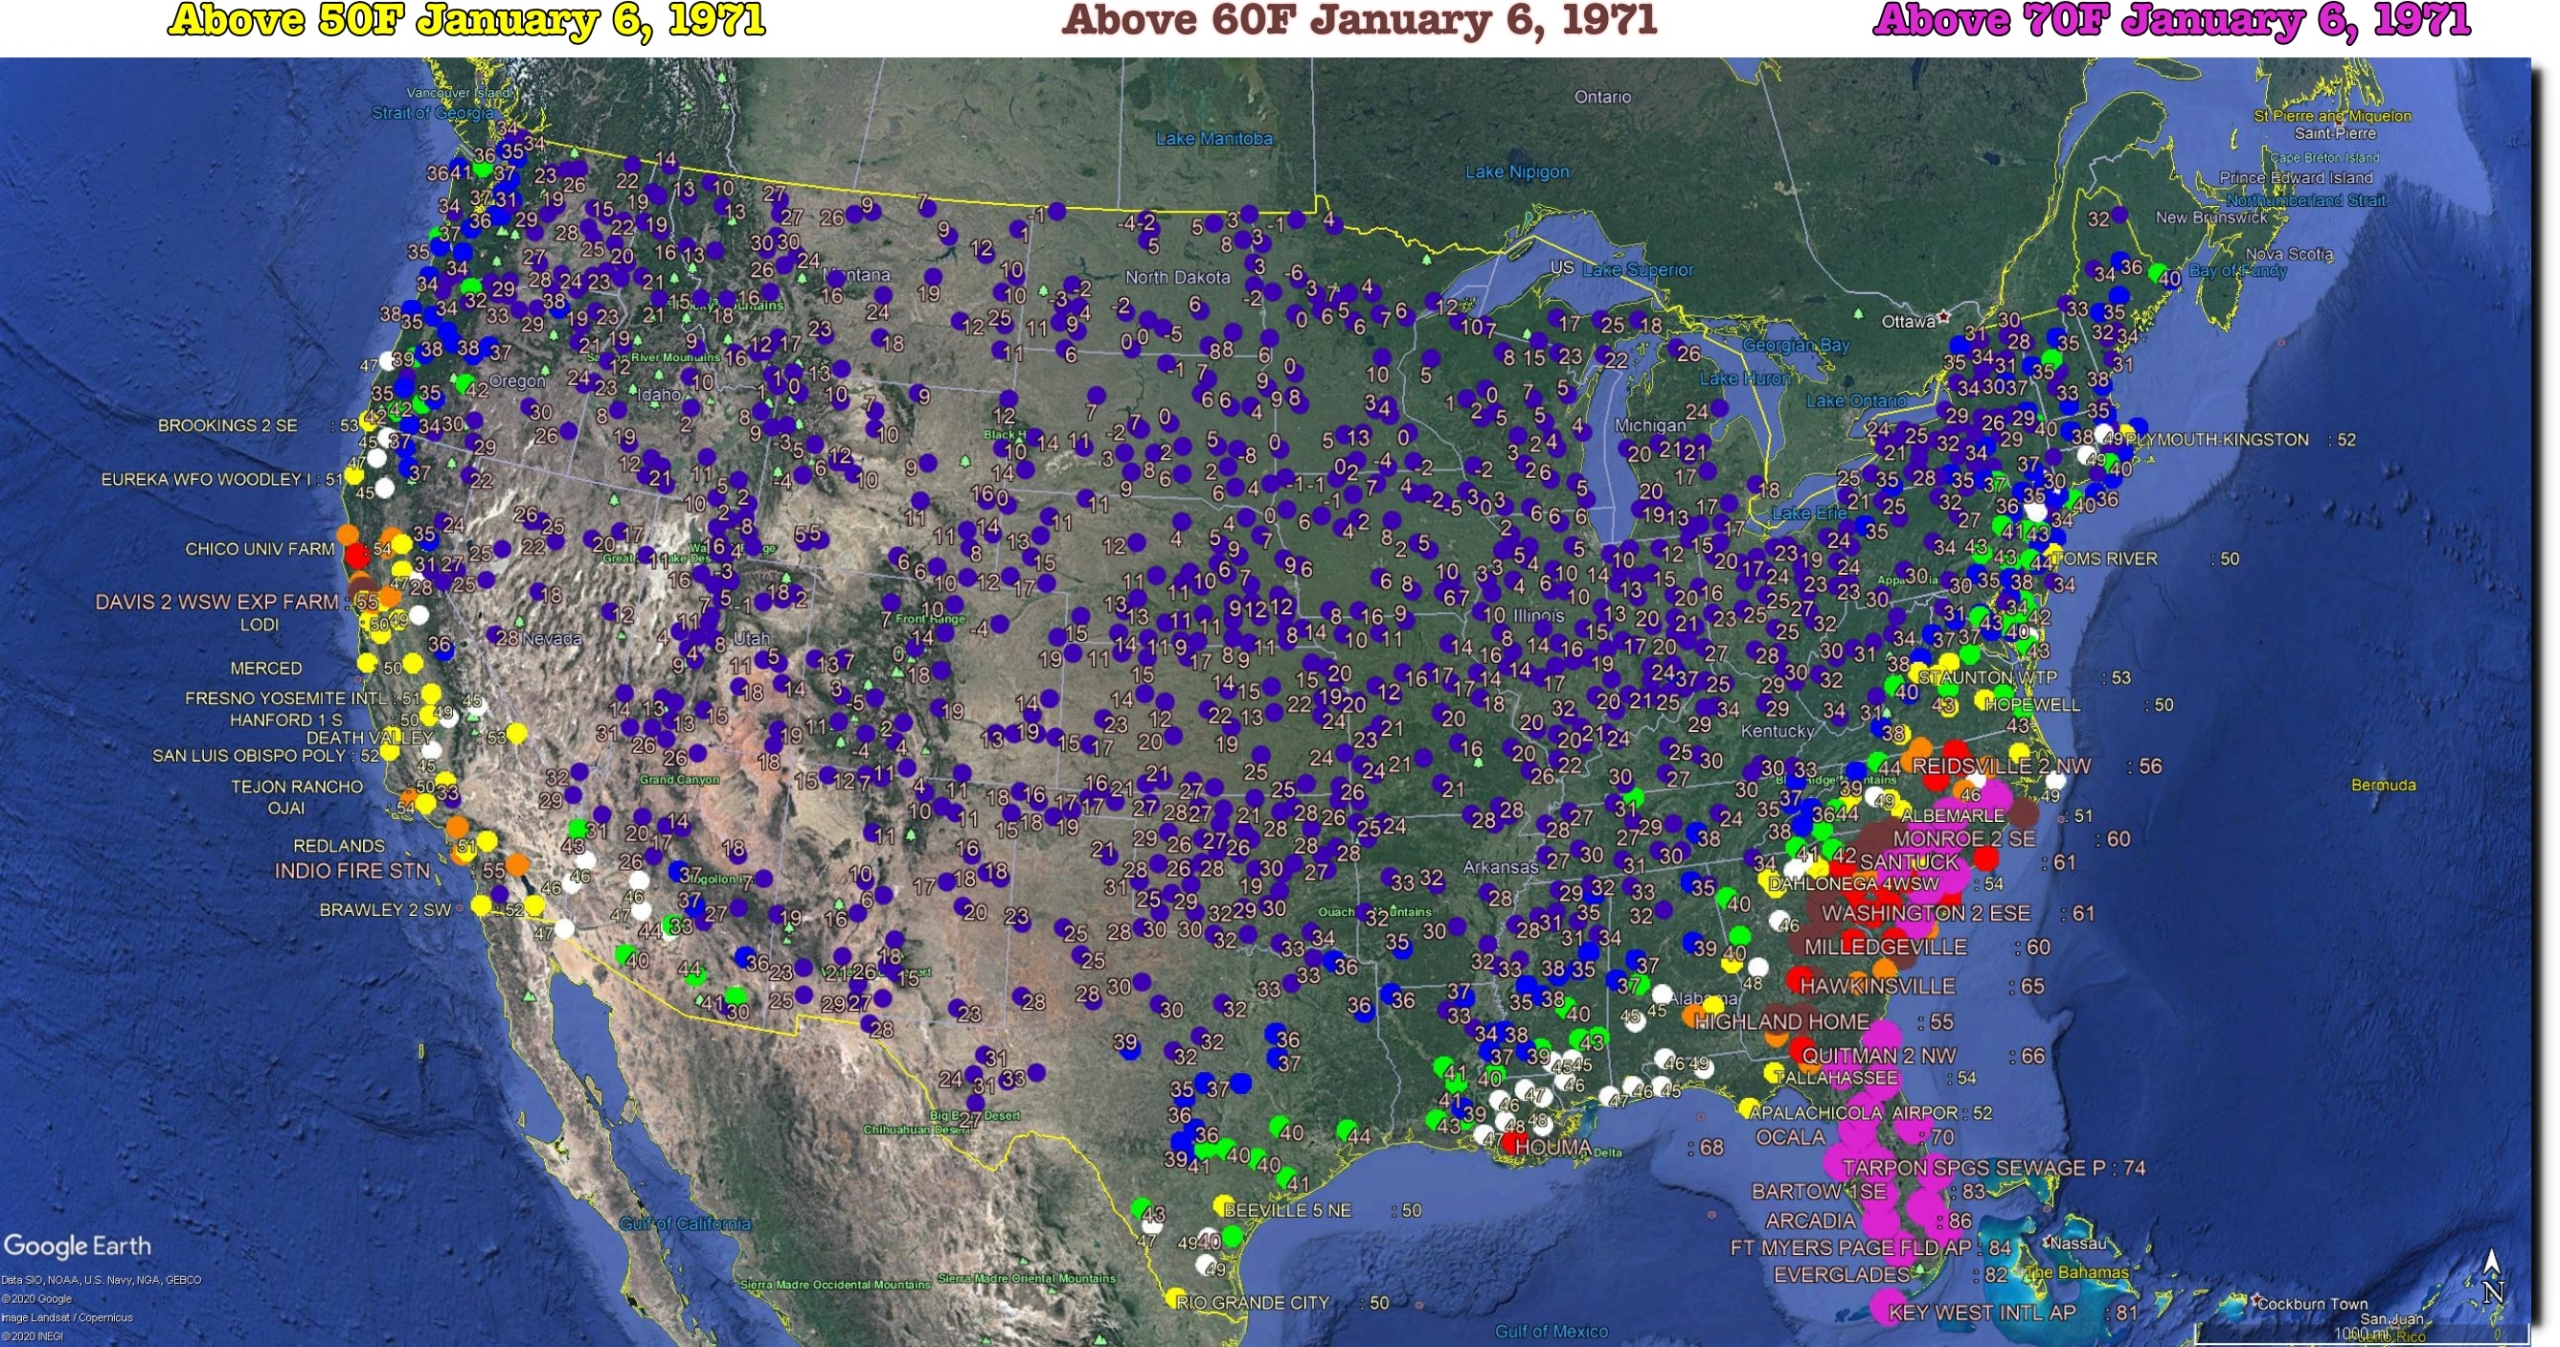
I remember that winter very well. It was extremely cold in New Mexico. Santa Fe was -15F and Albuquerque was -13F. My 9th grade earth science teacher was very excited about the “polar air mass.”

05 Jan 1971, 1 – The Santa Fe New Mexican at Newspapers.com
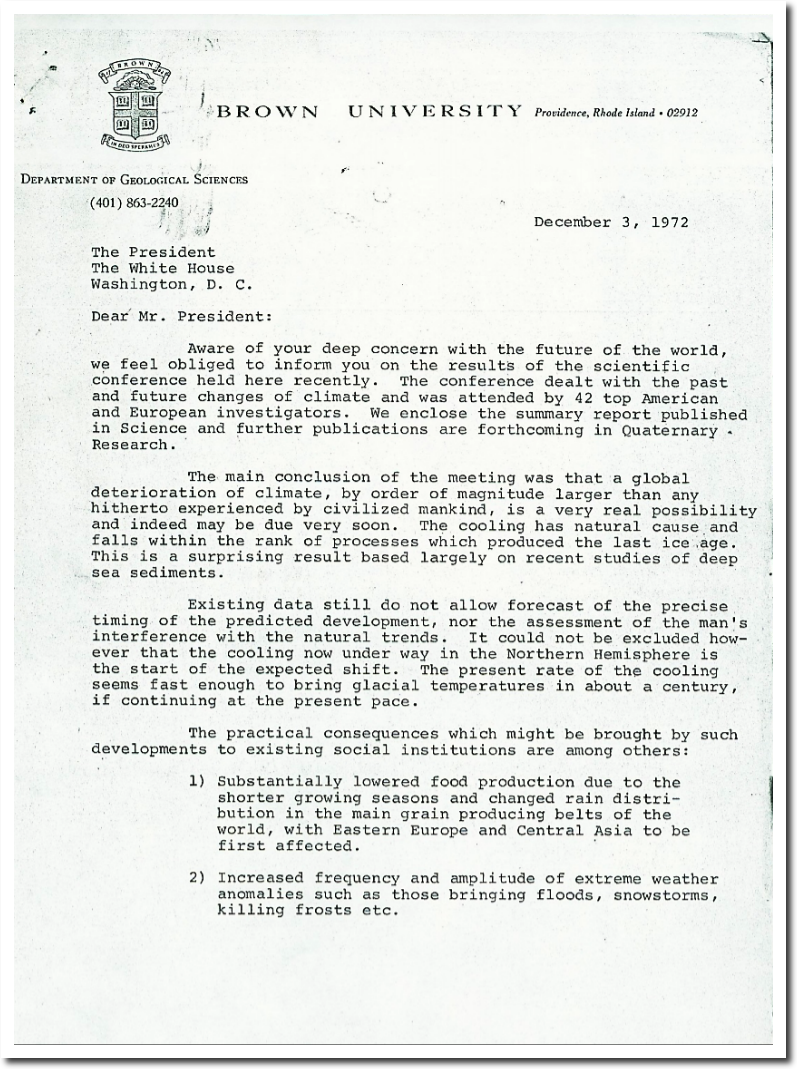
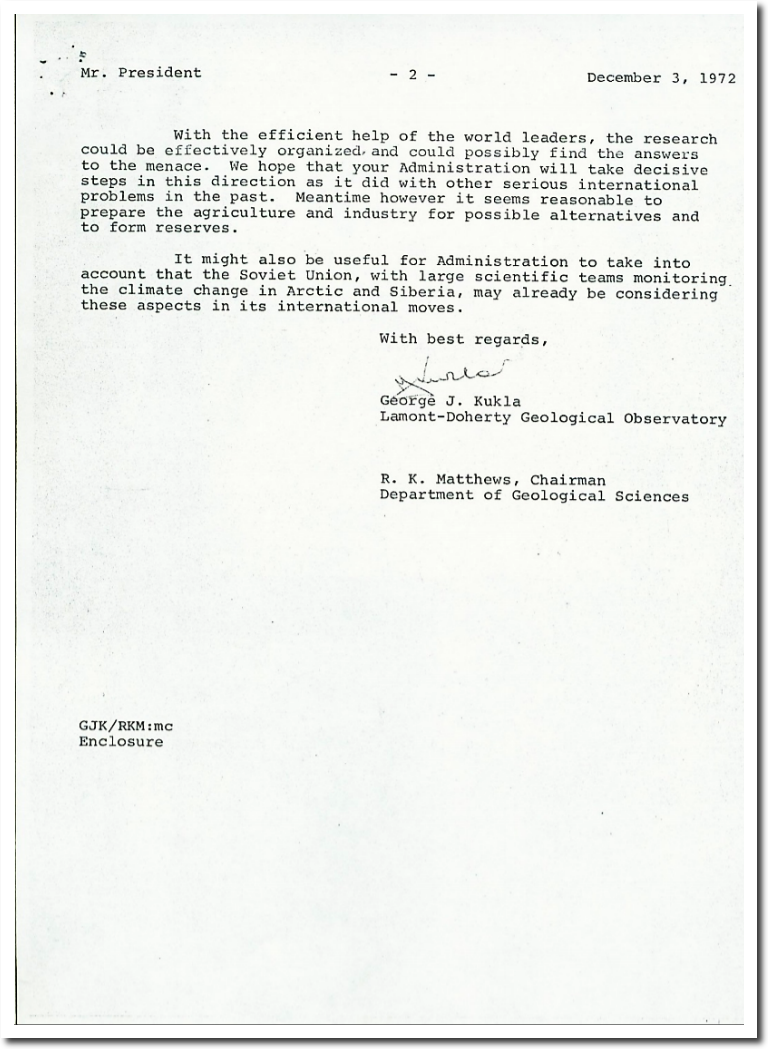
NASA was forecasting a new ice age by the year 2021.
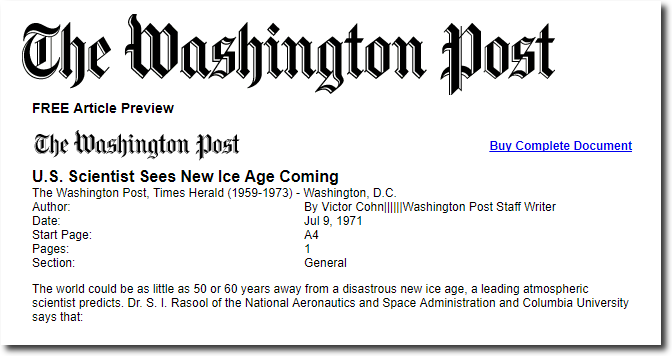
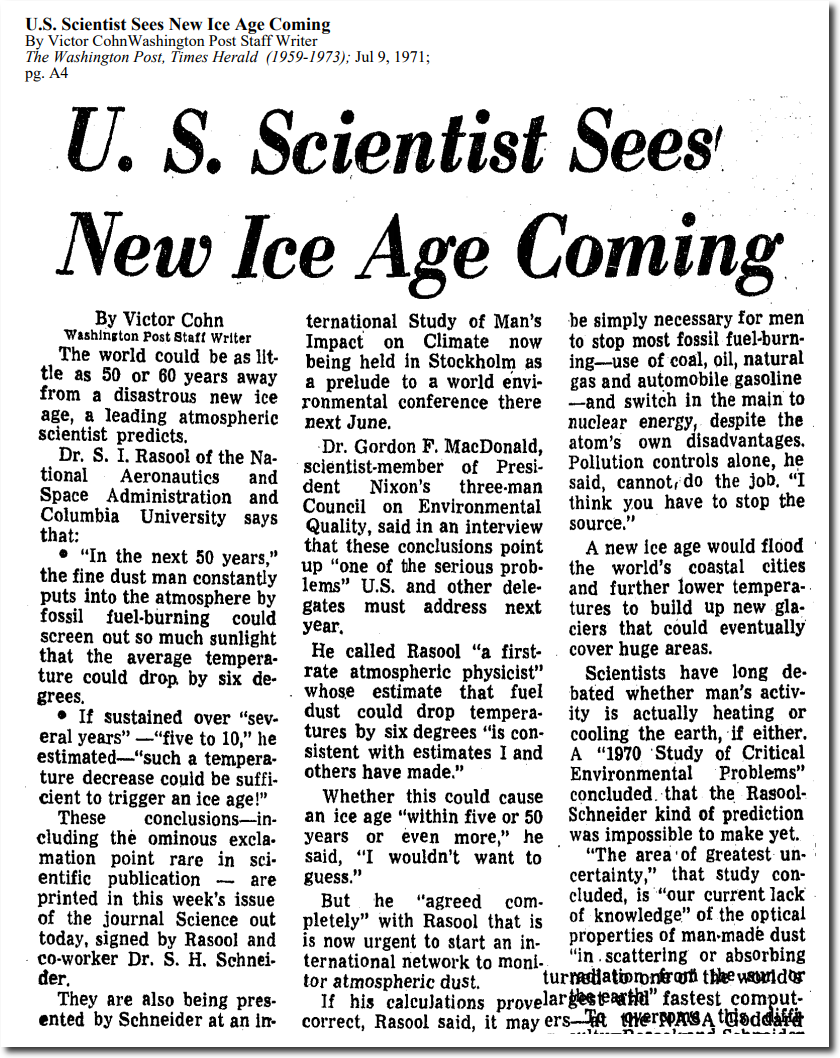
U.S. Scientist Sees New Ice Age Coming
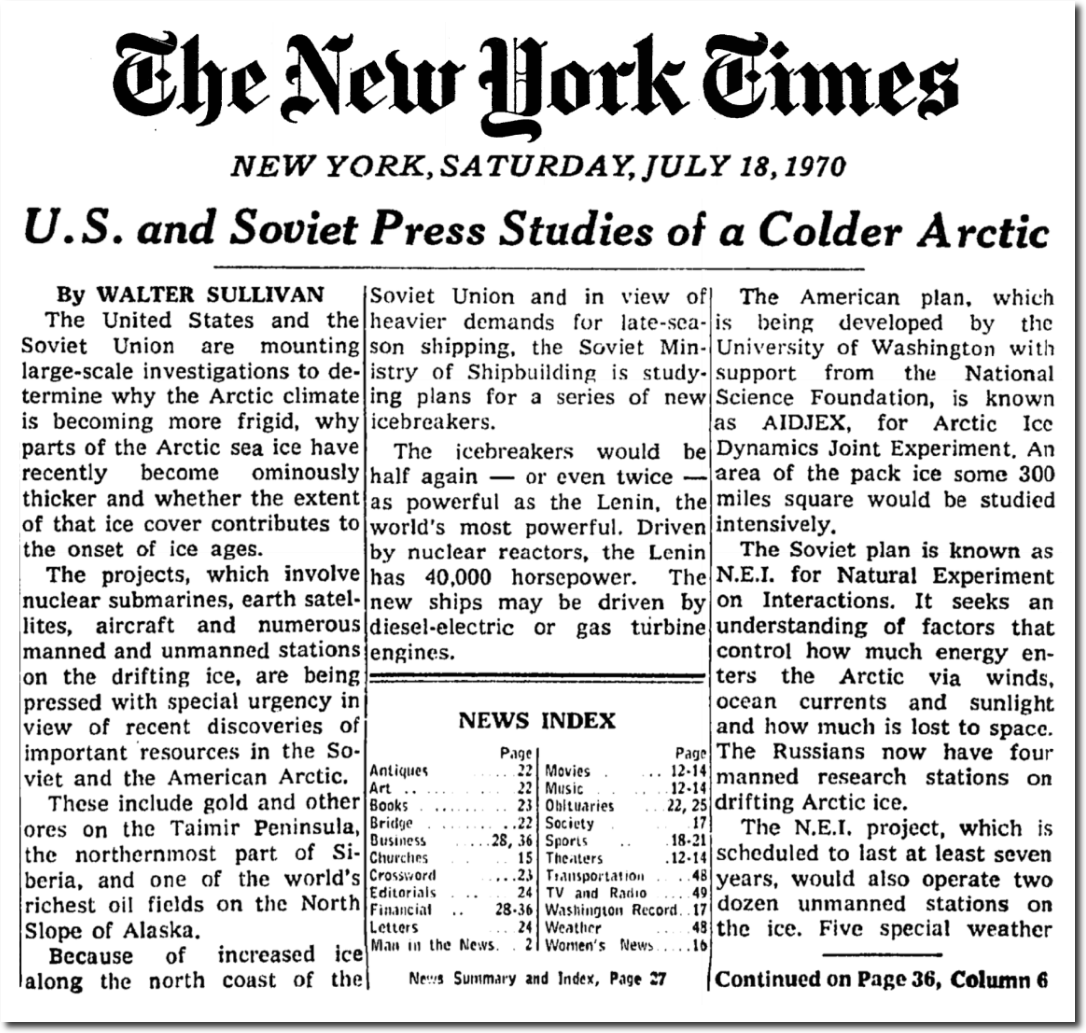
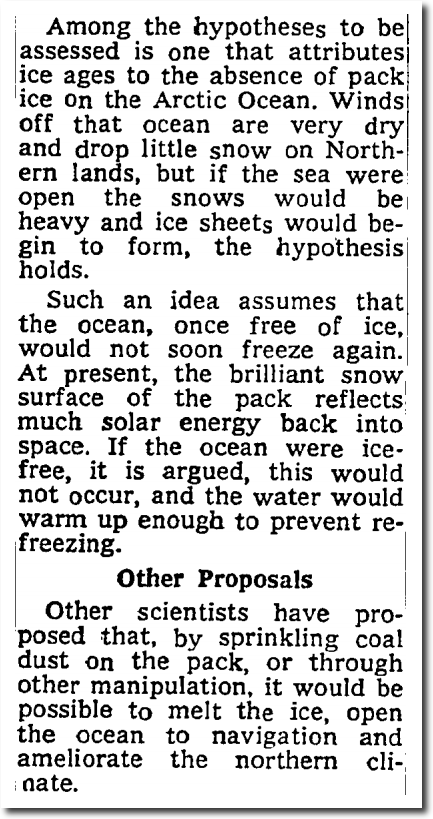
U.S. and Soviet Press Studies of a Colder Arctic – The New York Times
THE ROLE OF NOAA’S CLIMATE PREDICTION CENTER IN
The bad weather of the 1970s was blamed on global cooling and the new ice age. They called it “global climatic upheaval”
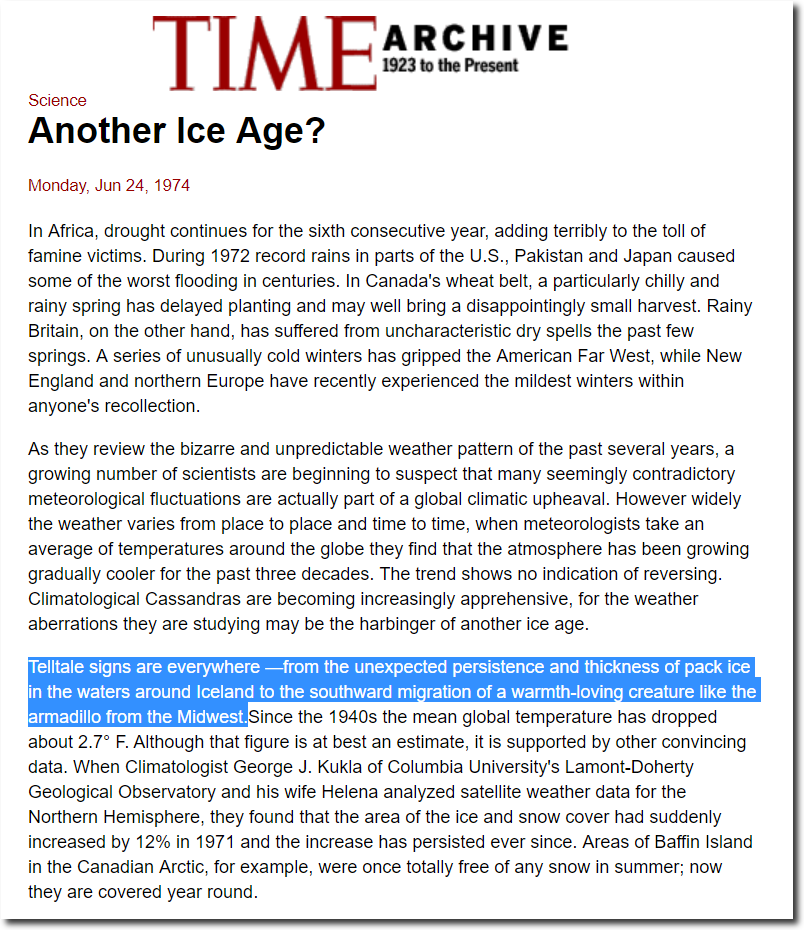
TIME Magazine Archive Article — Another Ice Age? — Jun. 24, 1974
Posted in Uncategorized
Leave a comment
With Fake Data, NOAA Can Accomplish Anything
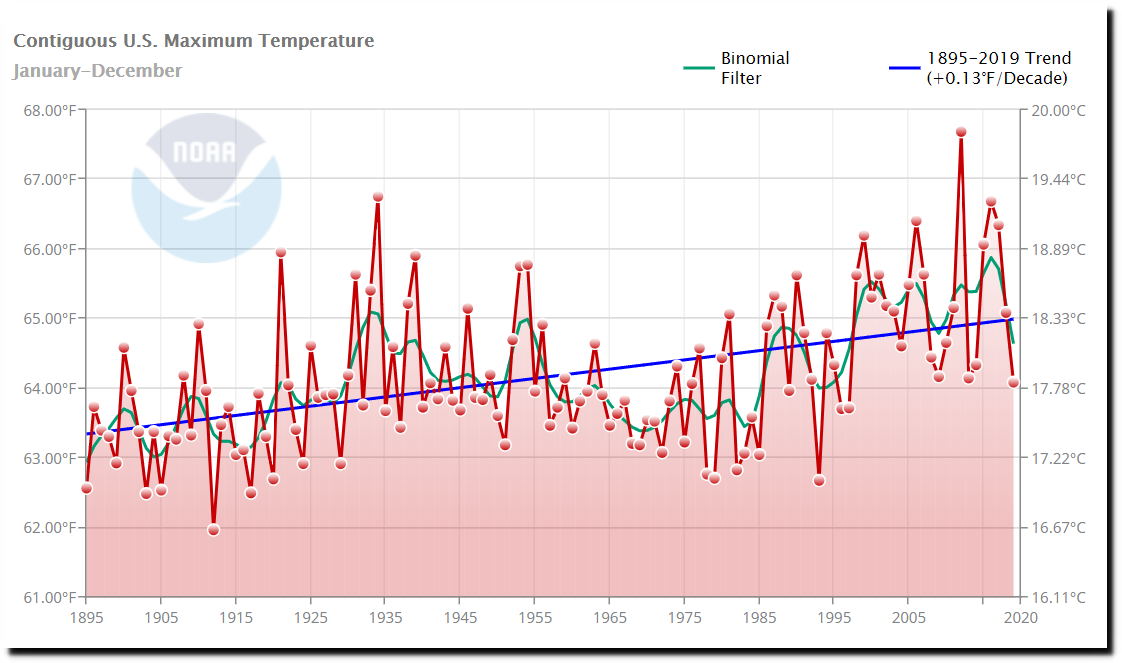
NOAA claims that the area of the US with unusually hot summer afternoon temperatures has increased in the US over the past 50 years to record levels.
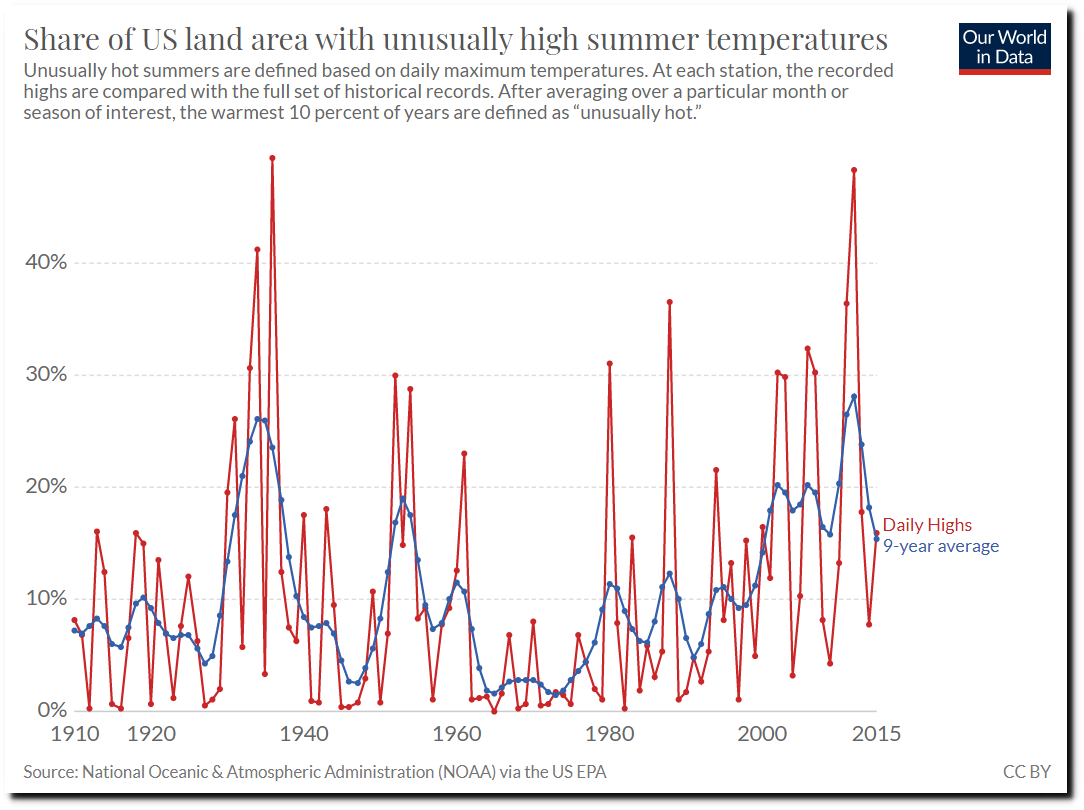
Natural Disasters – Our World in Data
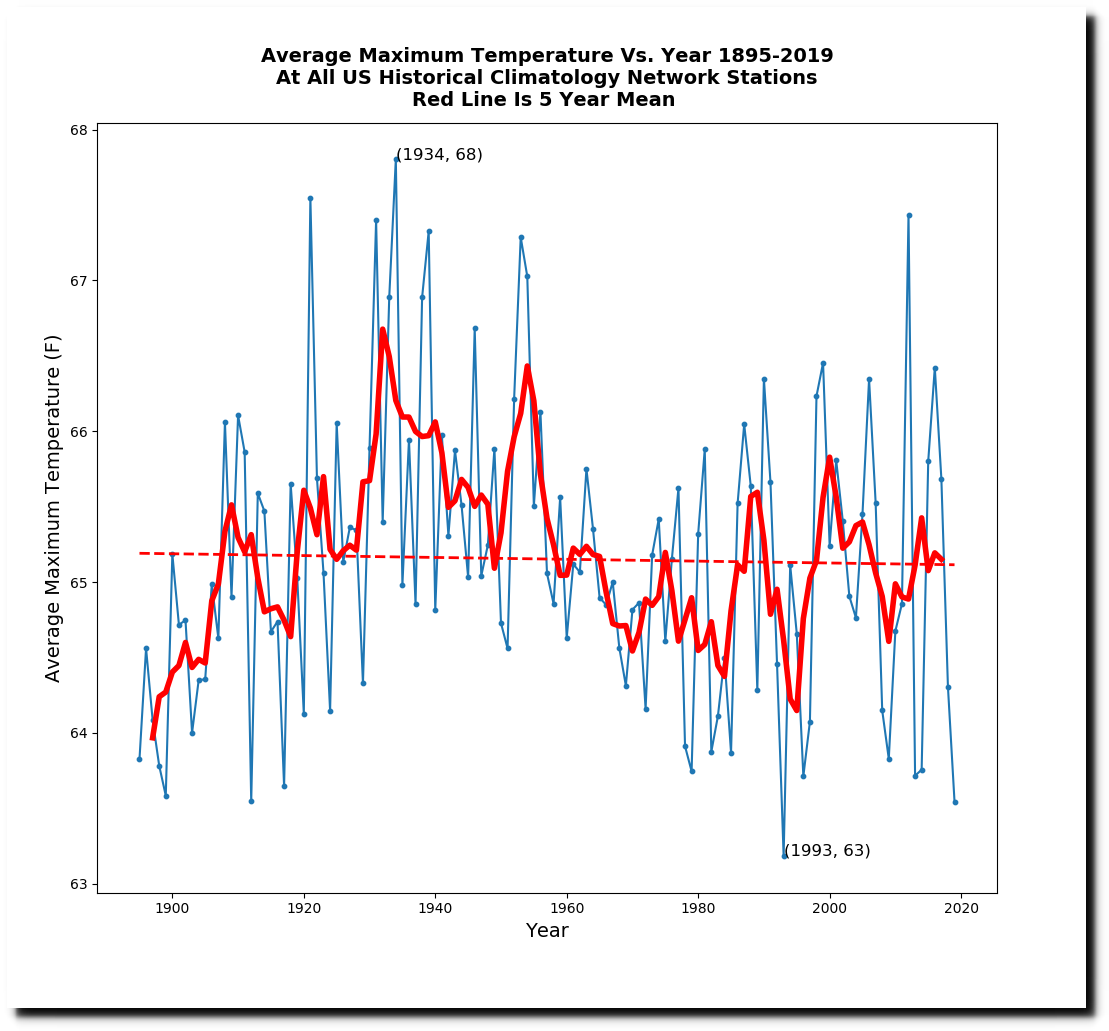
The National Climate Assessment shows that summers used to be much hotter, and that peak temperatures are way down over most of the country.

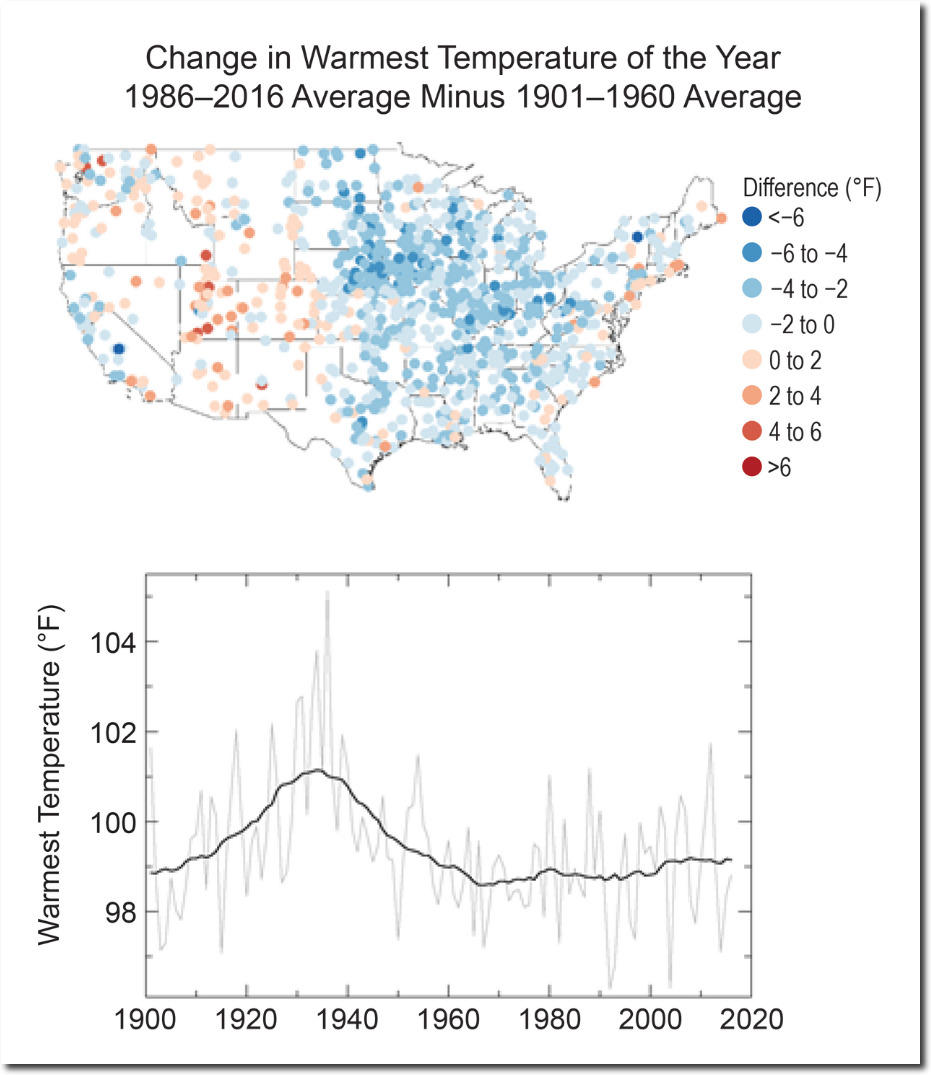
Temperature Changes in the United States – Climate Science Special Report
There are no metrics which support the NOAA graph.
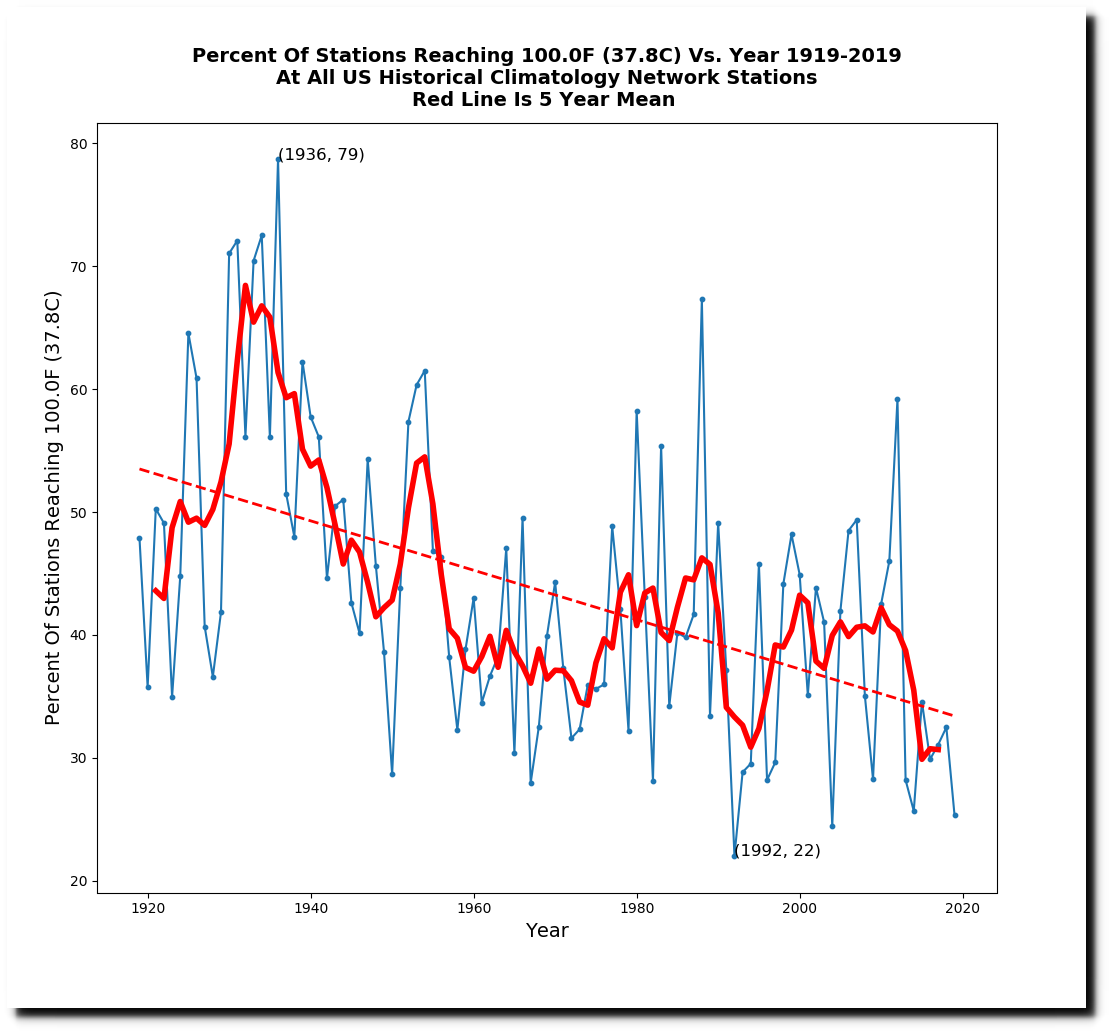
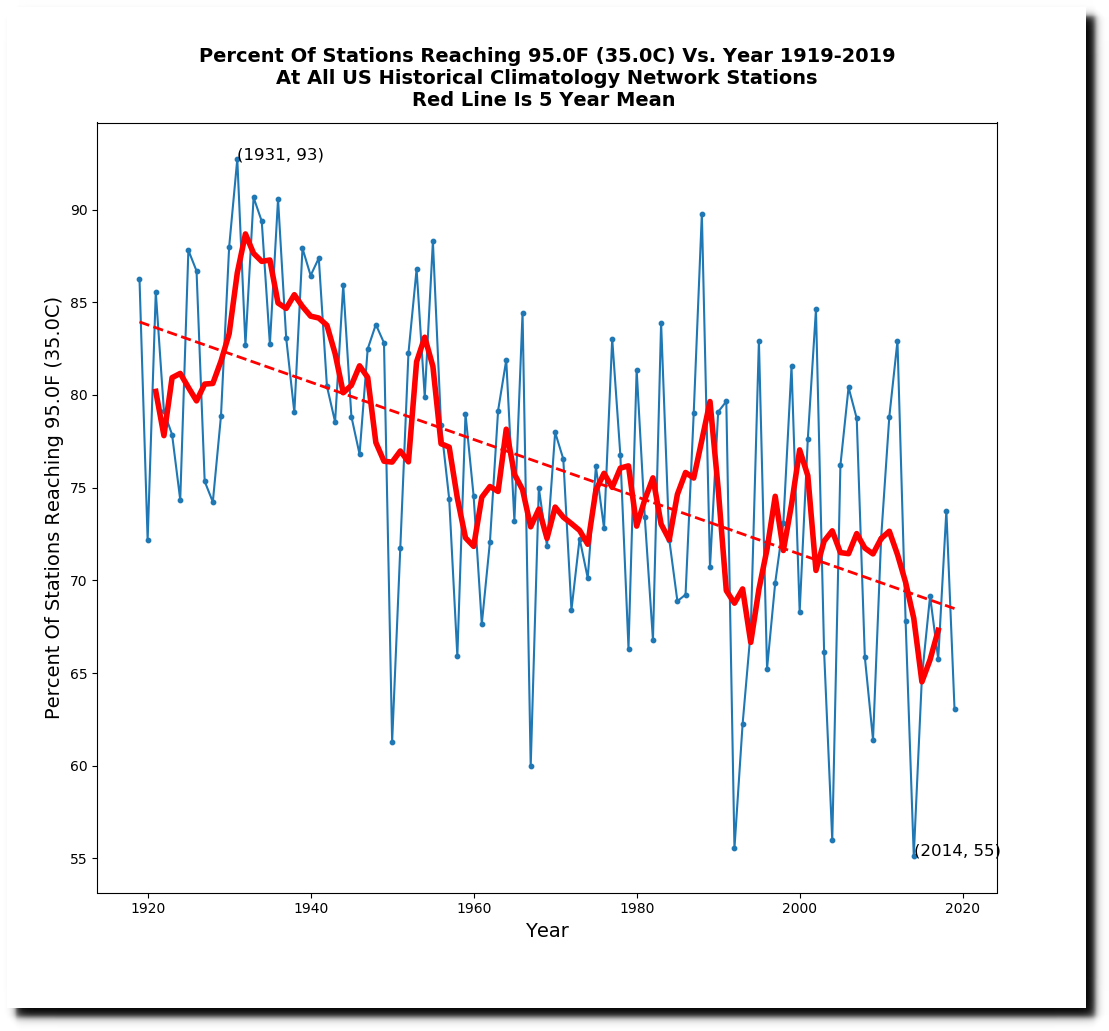

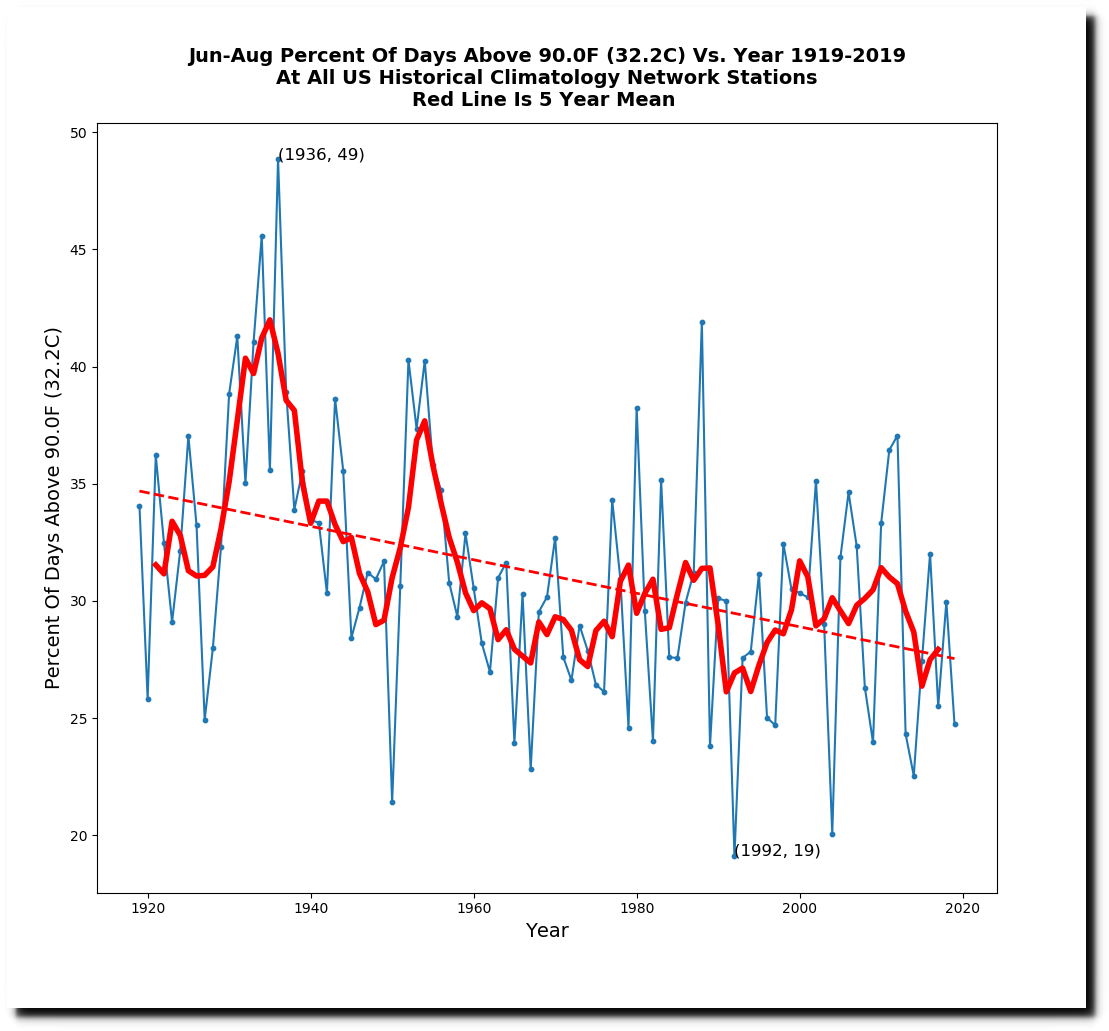


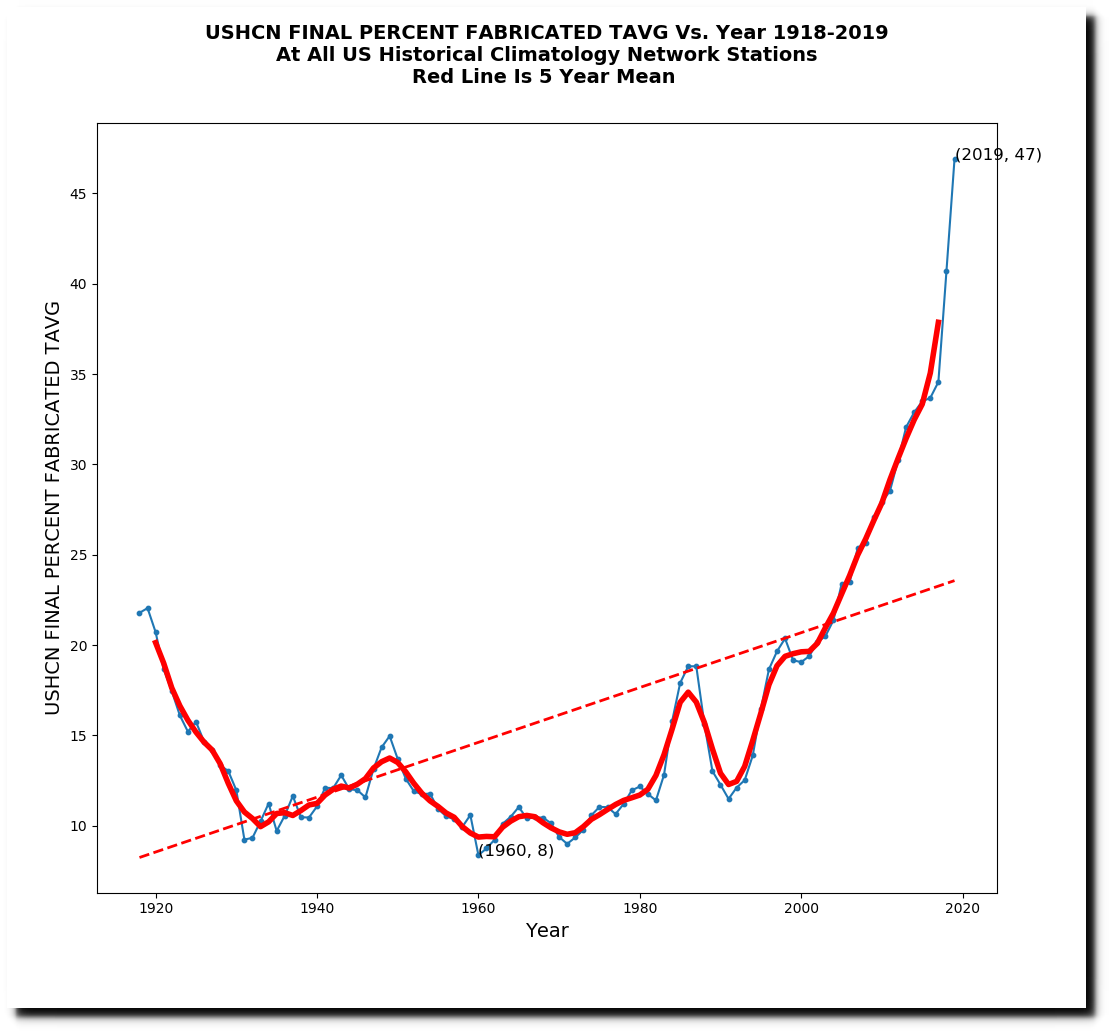
So how did NOAA create the fake data? They simply made it up. Almost half of all data from NOAA now is completely fake, with no underlying thermometer data.
Posted in Uncategorized
Leave a comment