
Disrupting the Borg is expensive and time consuming!

Google Search
-
Recent Posts
- Analyzing The Western Water Crisis
- Gaslighting 1924
- “Why Do You Resist?”
- Climate Attribution Model
- Fact Checking NASA
- Fact Checking Grok
- Fact Checking The New York Times
- New Visitech Features
- Ice-Free Arctic By 2014
- Debt-Free US Treasury Forecast
- Analyzing Big City Crime (Part 2)
- Analyzing Big City Crime
- UK Migration Caused By Global Warming
- Climate Attribution In Greece
- “Brown: ’50 days to save world'”
- The Catastrophic Influence of Bovine Methane Emissions on Extraterrestrial Climate Patterns
- Posting On X
- Seventeen Years Of Fun
- The Importance Of Good Tools
- Temperature Shifts At Blue Hill, MA
- CO2²
- Time Of Observation Bias
- Climate Scamming For Profit
- Climate Scamming For Profit
- Back To The Future
March 2026 M T W T F S S 1 2 3 4 5 6 7 8 9 10 11 12 13 14 15 16 17 18 19 20 21 22 23 24 25 26 27 28 29 30 31 Recent Comments
- Bob G on Analyzing The Western Water Crisis
- arn on Analyzing The Western Water Crisis
- Bob G on Analyzing The Western Water Crisis
- Bob G on Analyzing The Western Water Crisis
- Bob G on Analyzing The Western Water Crisis
- Hank Phillips on Analyzing The Western Water Crisis
- Hank Phillips on Analyzing The Western Water Crisis
- Hank Phillips on Analyzing The Western Water Crisis
- Hank Phillips on Analyzing The Western Water Crisis
- Bob G on Analyzing The Western Water Crisis
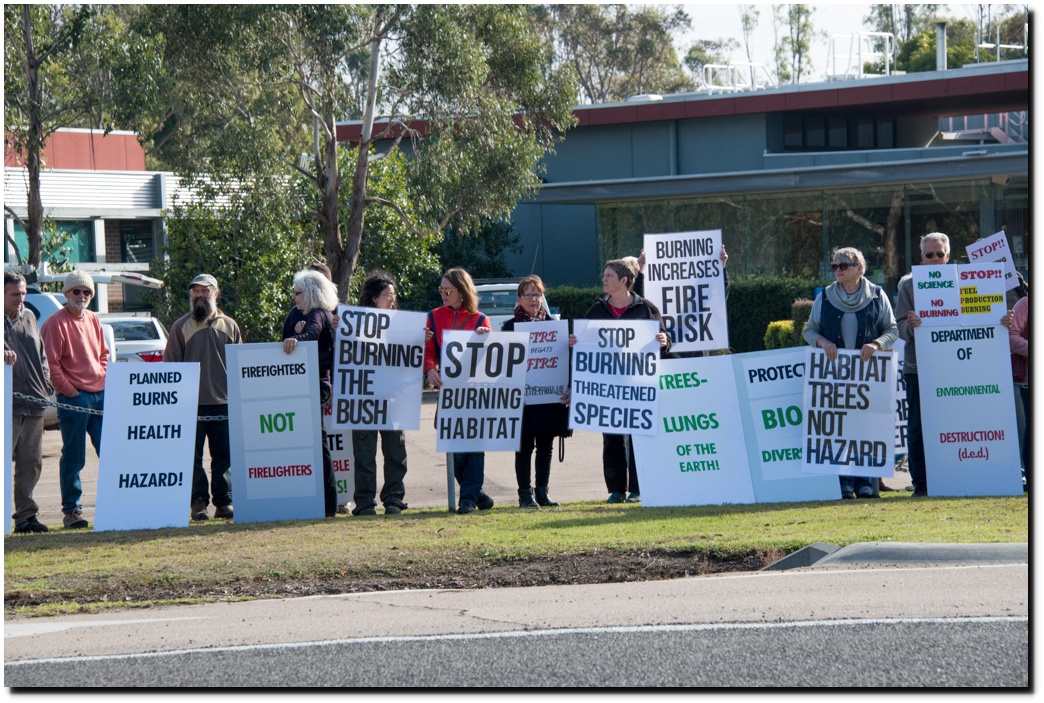
“Nothing To Do With Climate Change”
“As former State Fire Chiefs call for a summit on bushfires, expert and scientist David Packham explains that it has nothing to do with climate change and everything to do with fuel-loads.”
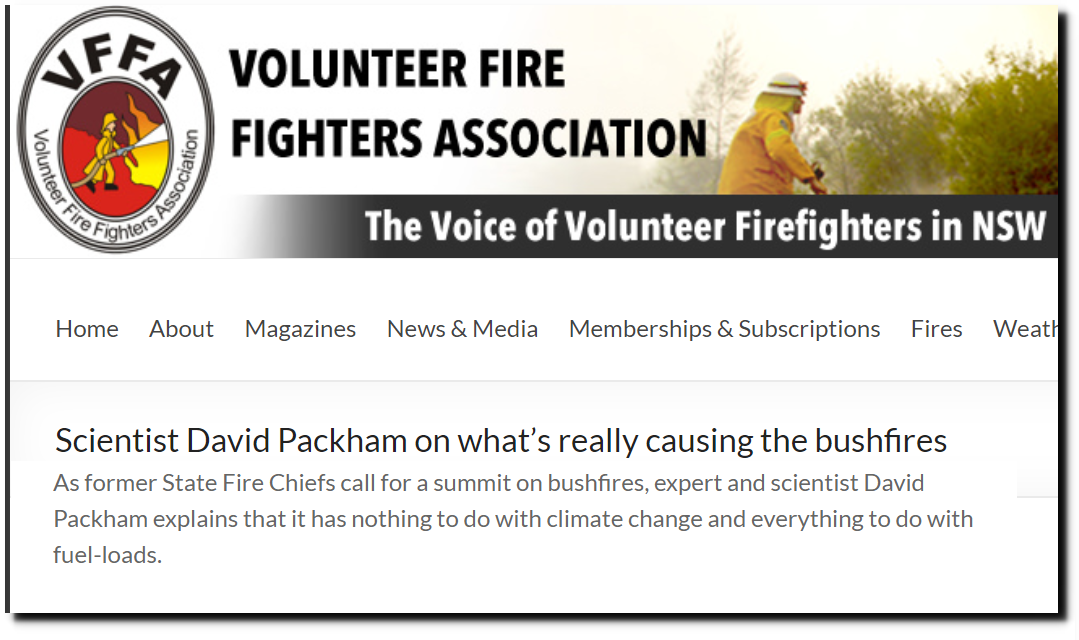
Scientist David Packham on what’s really causing the bushfires
h/t Craig Kelly MP
Posted in Uncategorized
Leave a comment
NASA ConfIrms Their Own “Conspiracy Theory”
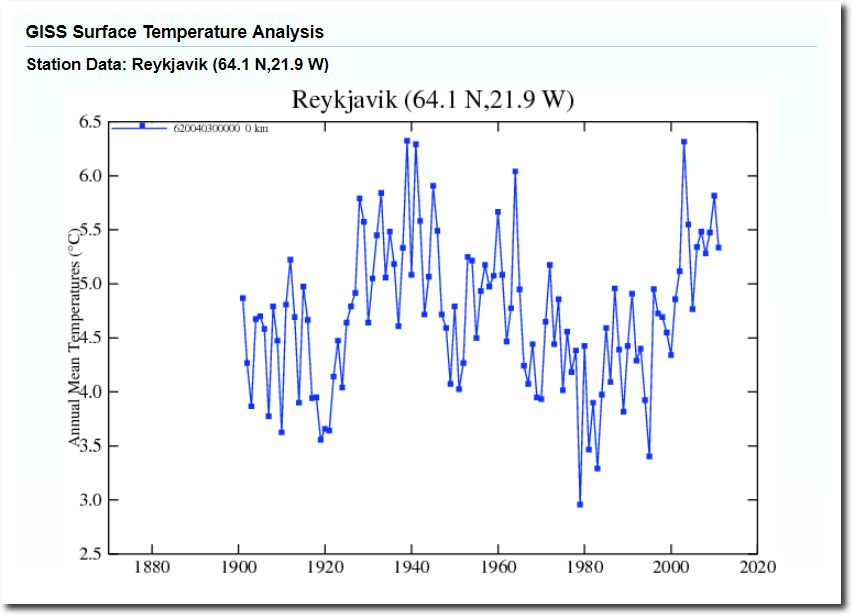
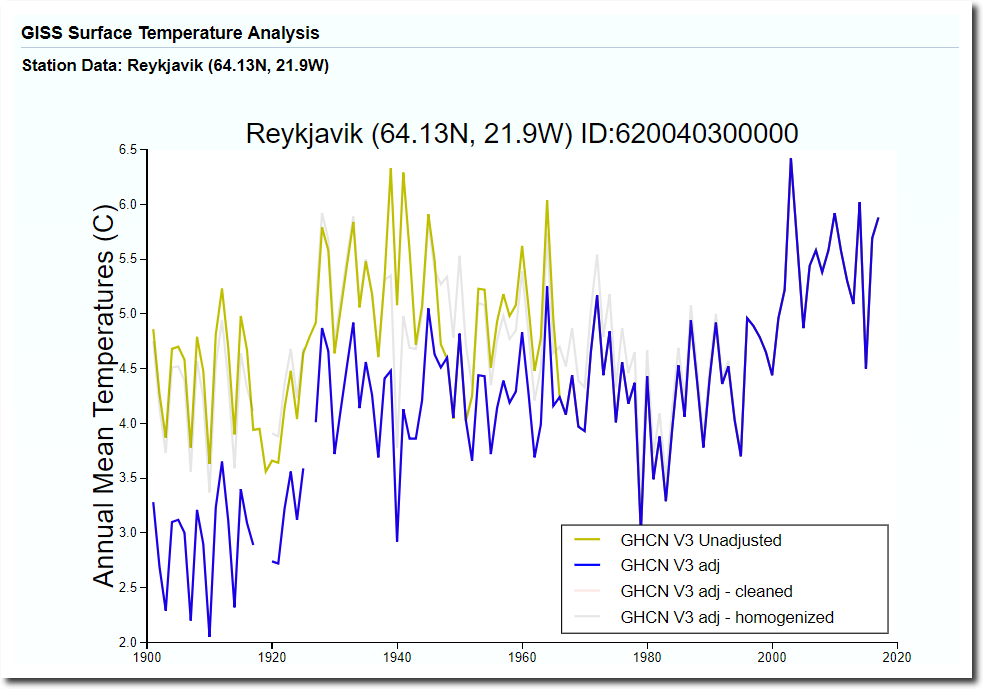
NASA and NOAA have been erasing the 1940s warmth in the Eastern Arctic for decades. This is what the raw data looks like.
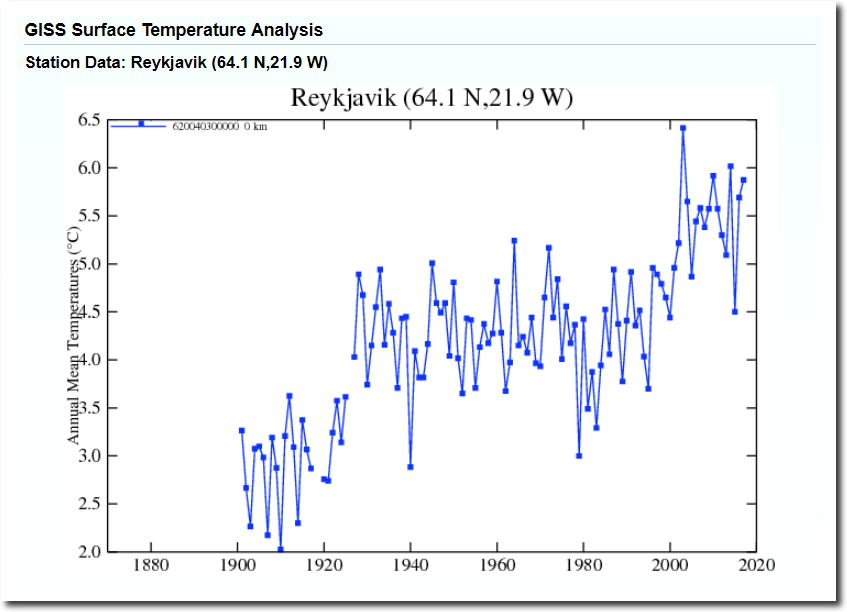
And this is what the adjusted data has looked like in various versions of GISTEMP.
May 2018 Measured Vs. Adjusted
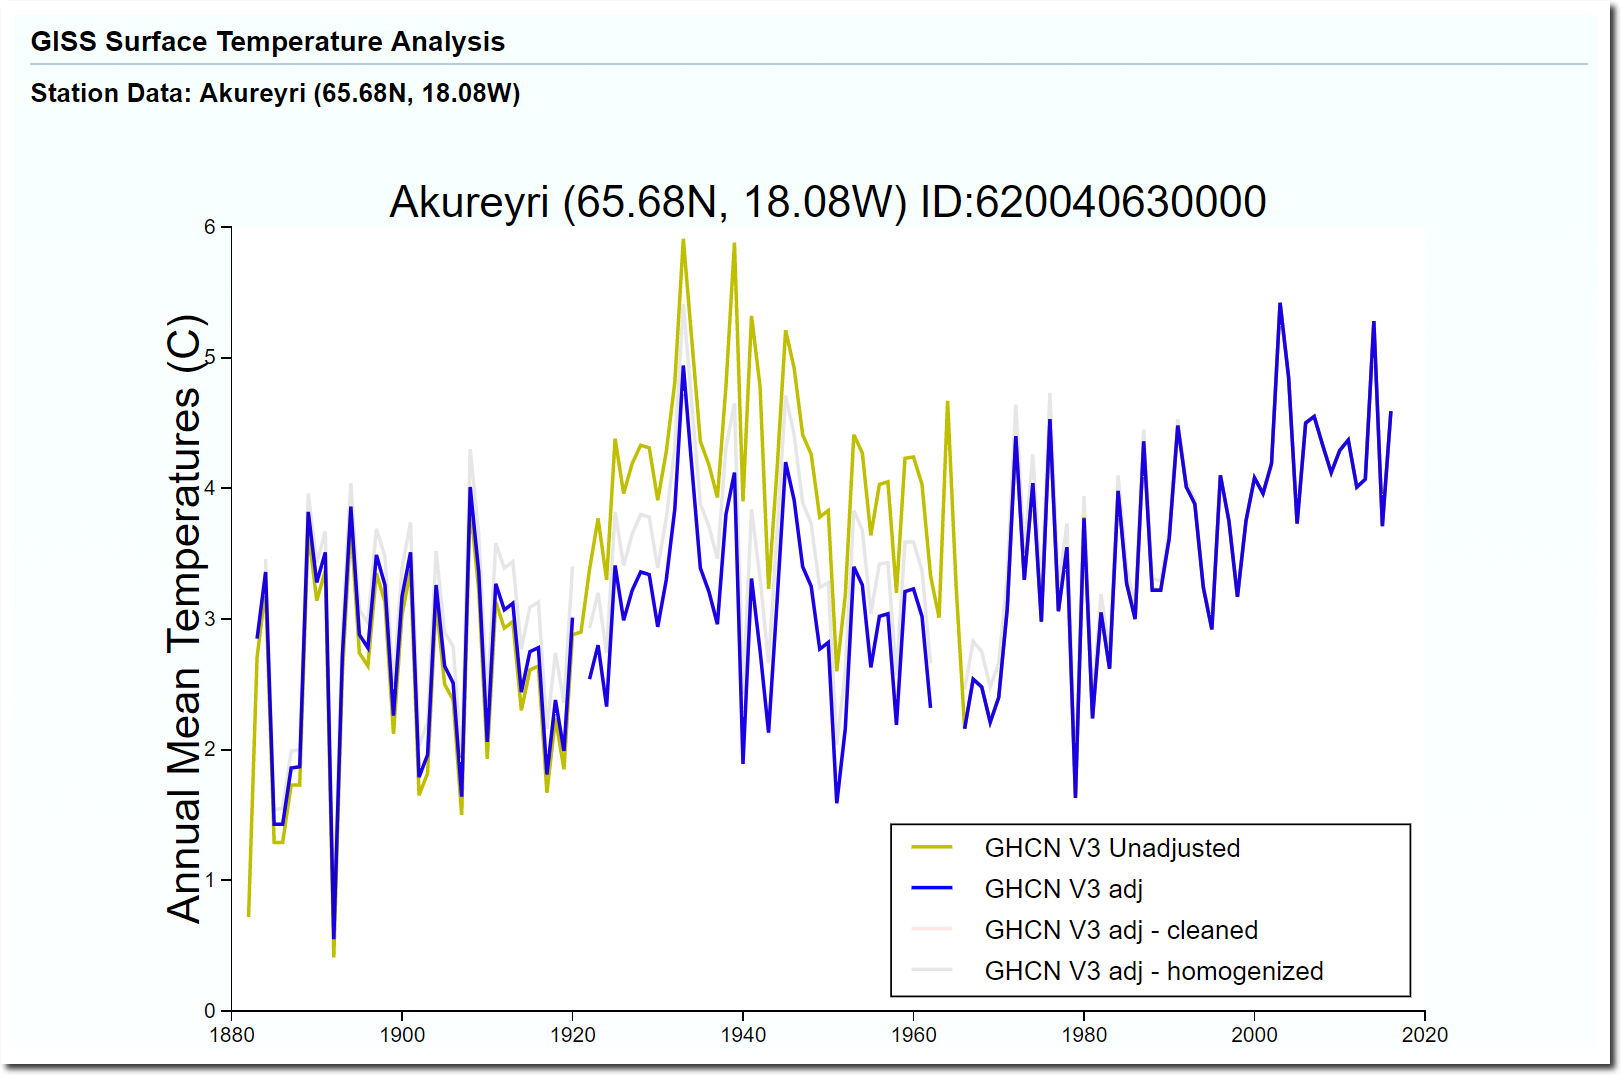
Data.GISS: GISS Surface Temperature Analysis
Removing the warmth of the 1940s (without any justification) was discussed by the world’s leading climate experts in this Climategate email.

In 2012, Paul Homewood contacted Trausti Jónsson of the Icelandic Met Office about these adjustments, and they were soundly rejected.
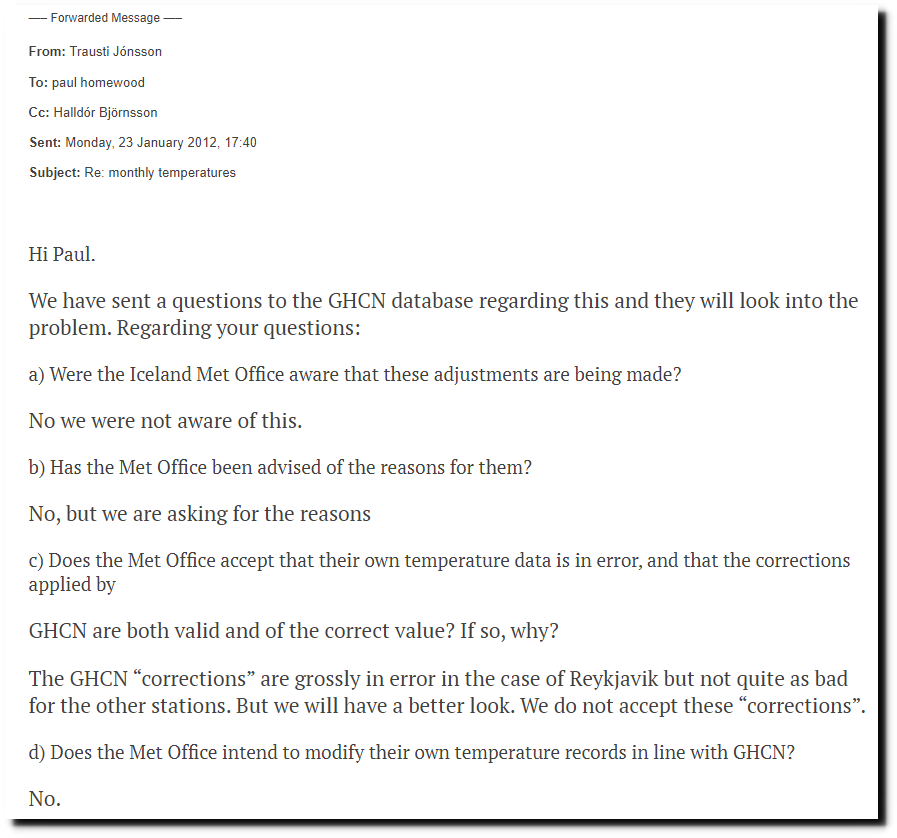
Another GISS miss, this time in Iceland | Watts Up With That?
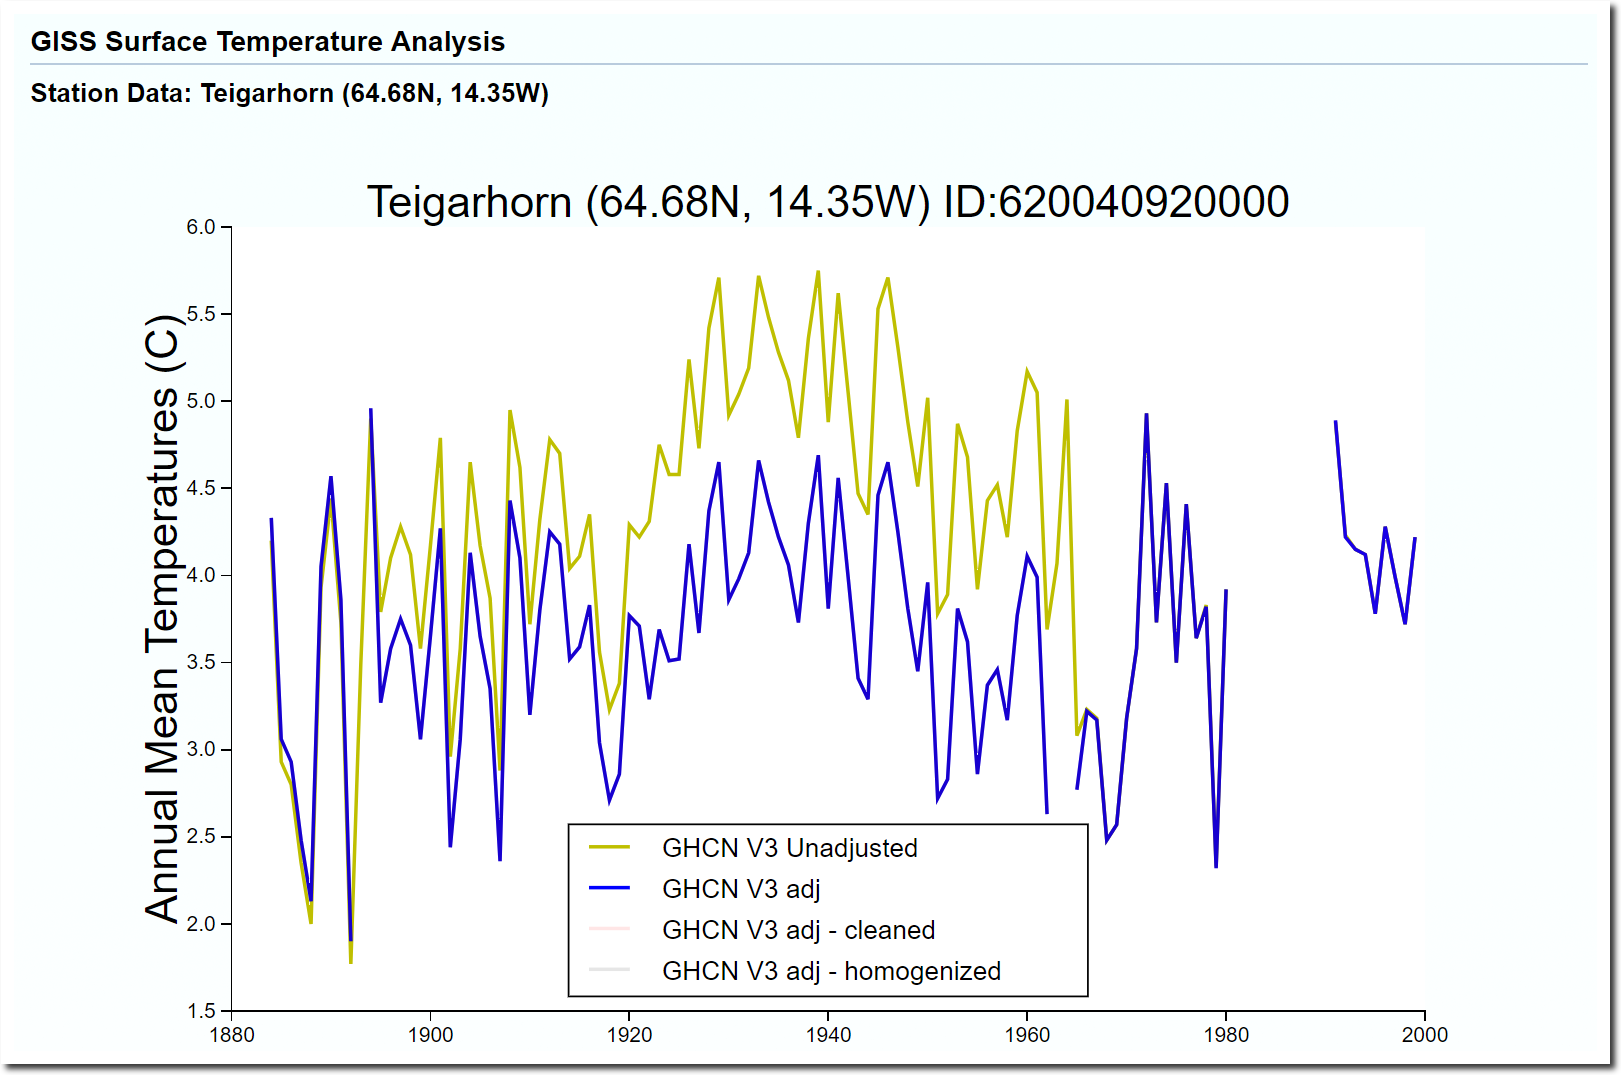
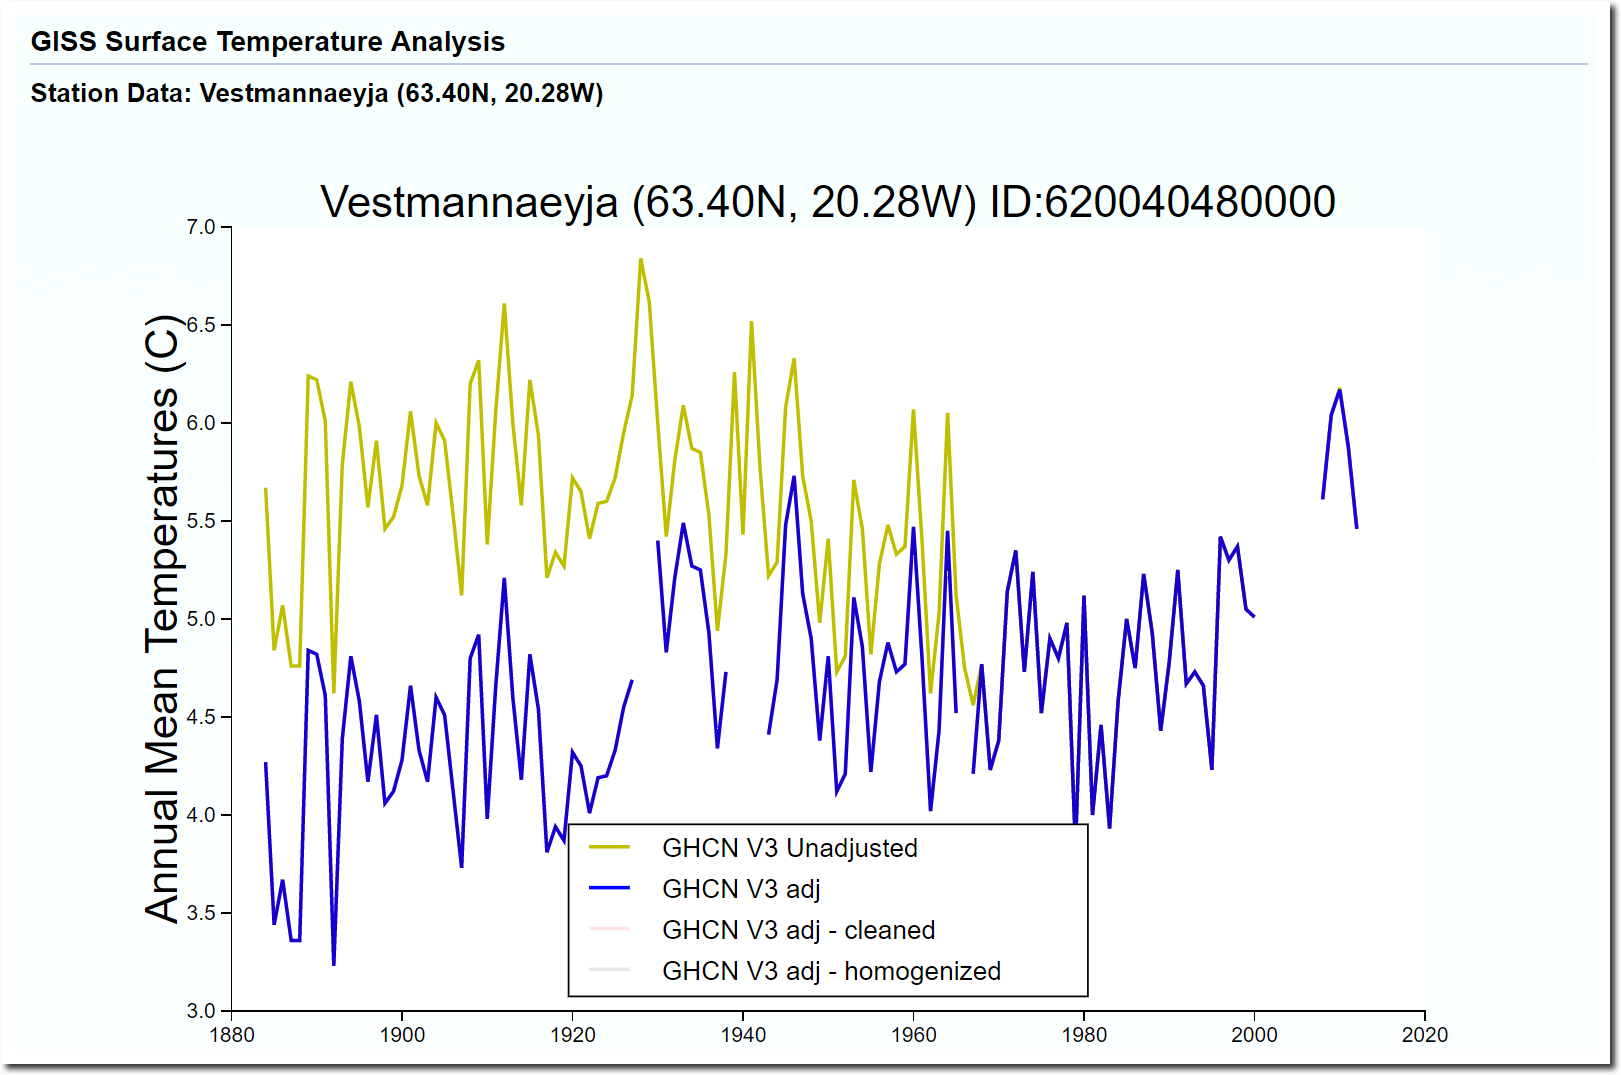
In November, 2016, Australian Senator Malcolm Roberts queried Gavin Schmidt at NASA about the adjustments.
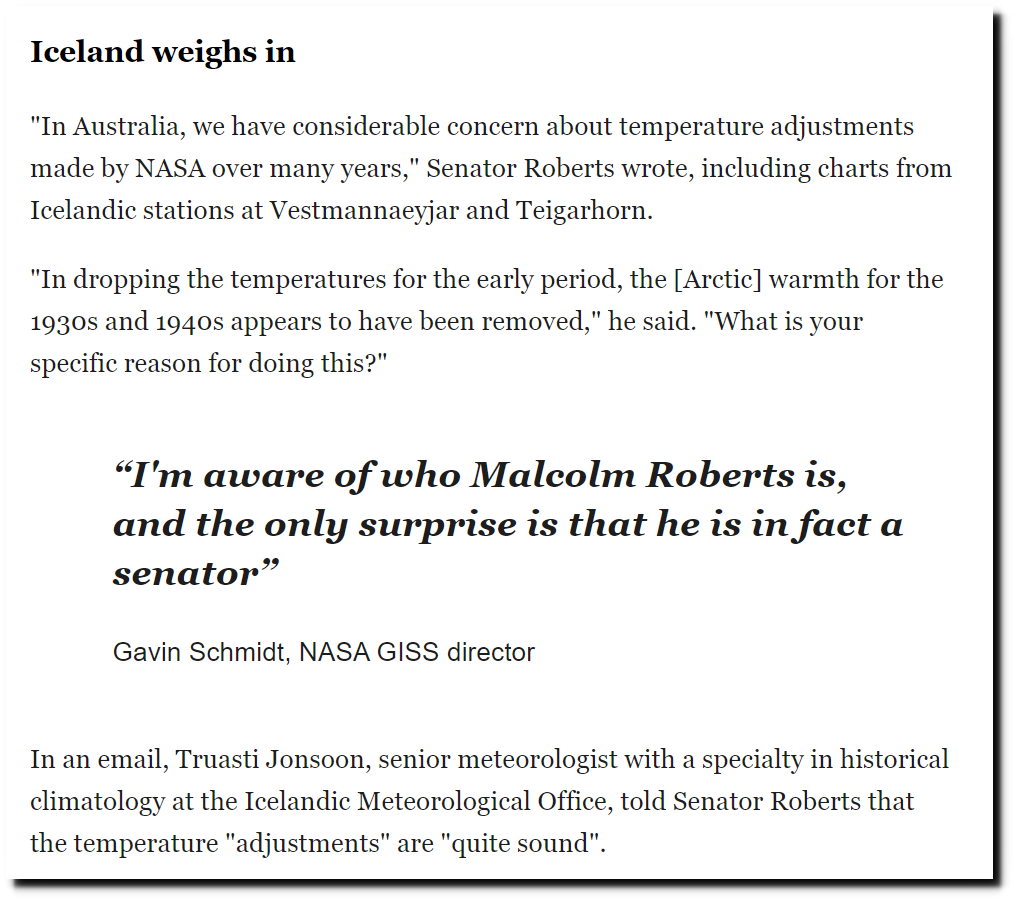
“In Australia, we have considerable concern about temperature adjustments made by NASA over many years,” Senator Roberts wrote, including charts from Icelandic stations at Vestmannaeyjar and Teigarhorn.
“In dropping the temperatures for the early period, the [Arctic] warmth for the 1930s and 1940s appears to have been removed,” he said. “What is your specific reason for doing this?”
Gavin Schmidt responded by insulting Senator Roberts, and saying that they don’t alter the data. Trausti Jónsson of the Icelandic Met Office magically reversed his story, saying the adjustments were “quite sound.”
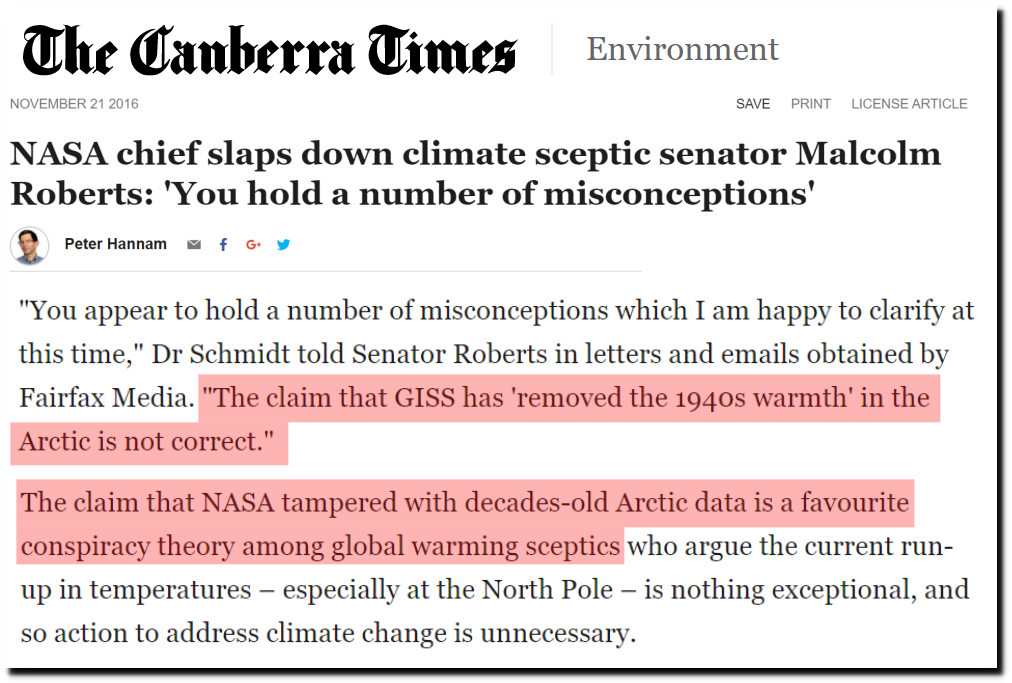
NASA chief slaps down climate sceptic senator Malcolm Roberts: ‘You hold a number of misconceptions’
Gavin also said that NASA data isn’t theirs, it is actually NOAA data, and that they don’t take responsibility for it.
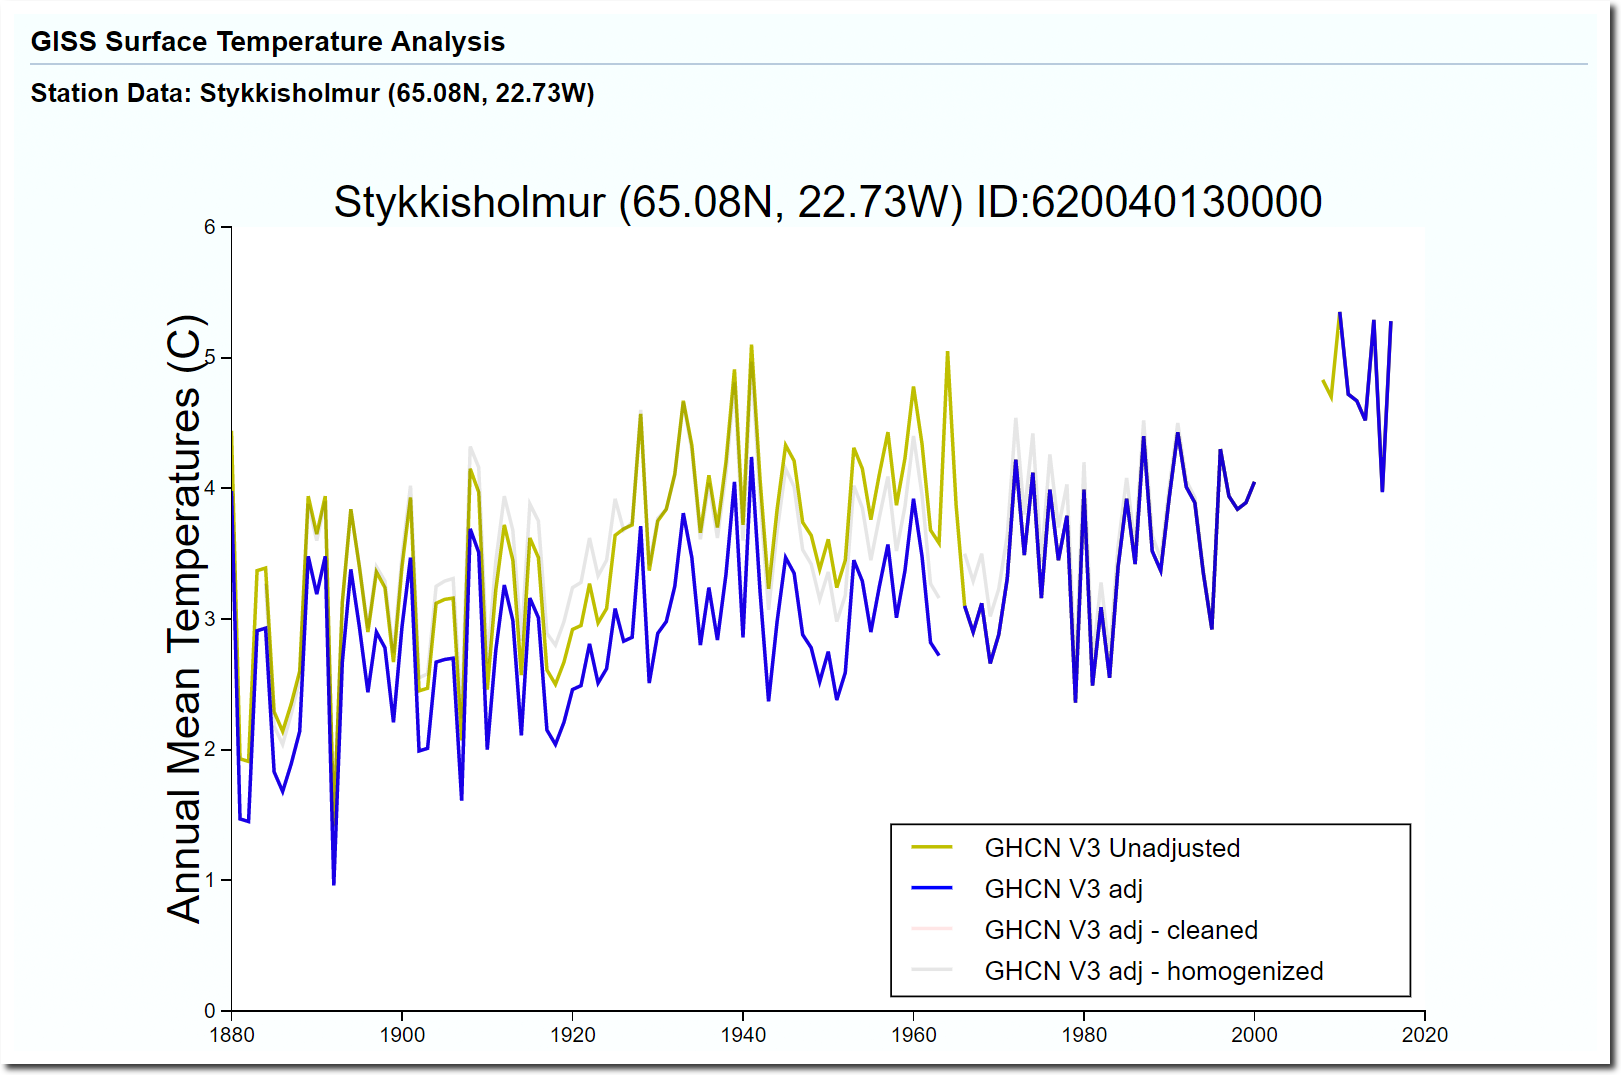
Three years later, the Canberra Times has since removed this story from their website, and NASA and NOAA have quietly stopped tampering with Iceland’s temperatures – thus confirming what they actually were removing the 1940s warmth without justification.
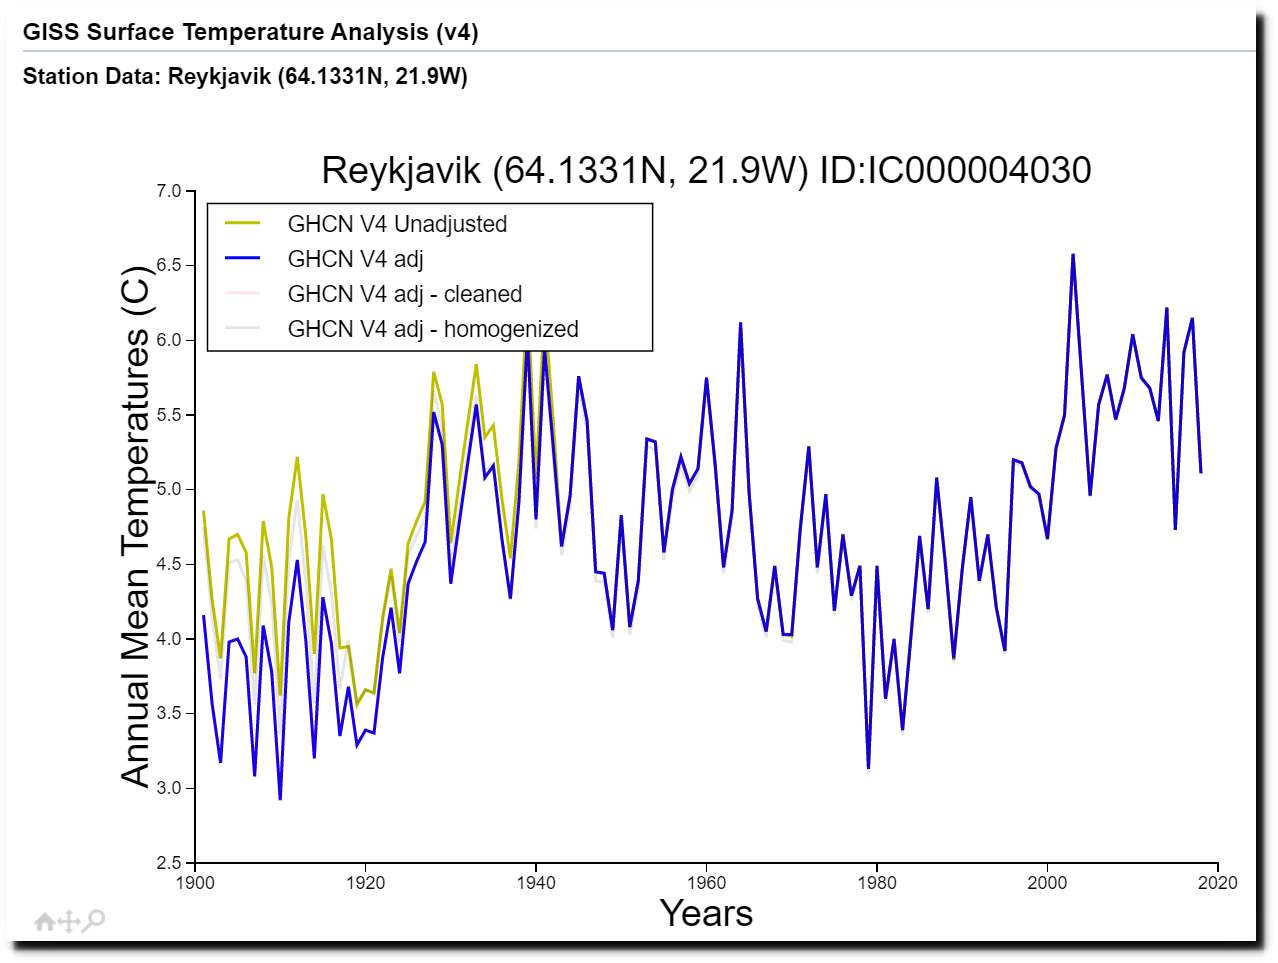
Data.GISS: GISS Surface Temperature Analysis (v4)
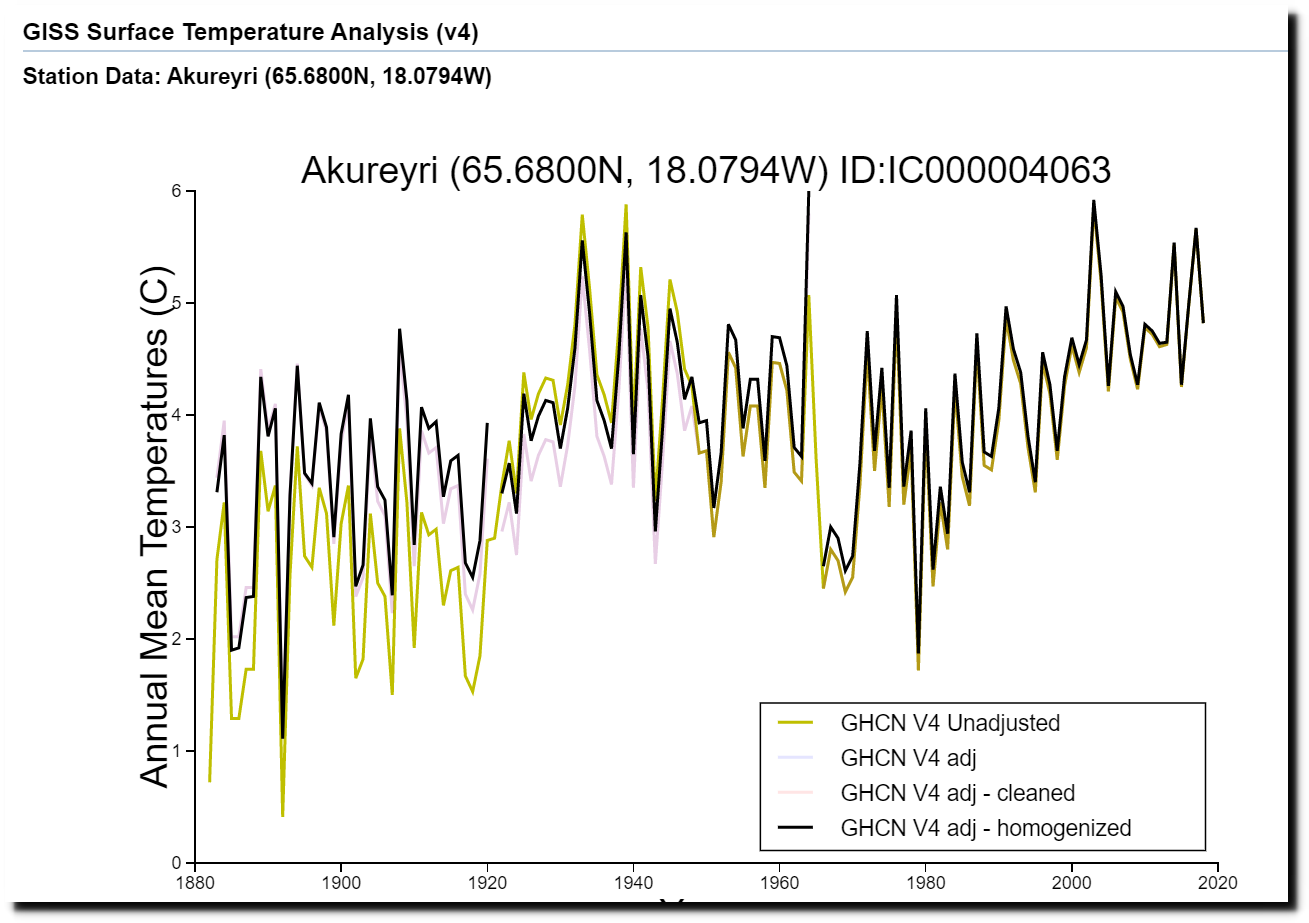
Data.GISS: GISS Surface Temperature Analysis (v4)
Gavin told Senator Roberts they use NOAA data, yet the NASA web site claims that their data is independent, and that is proof that their graphs are real.
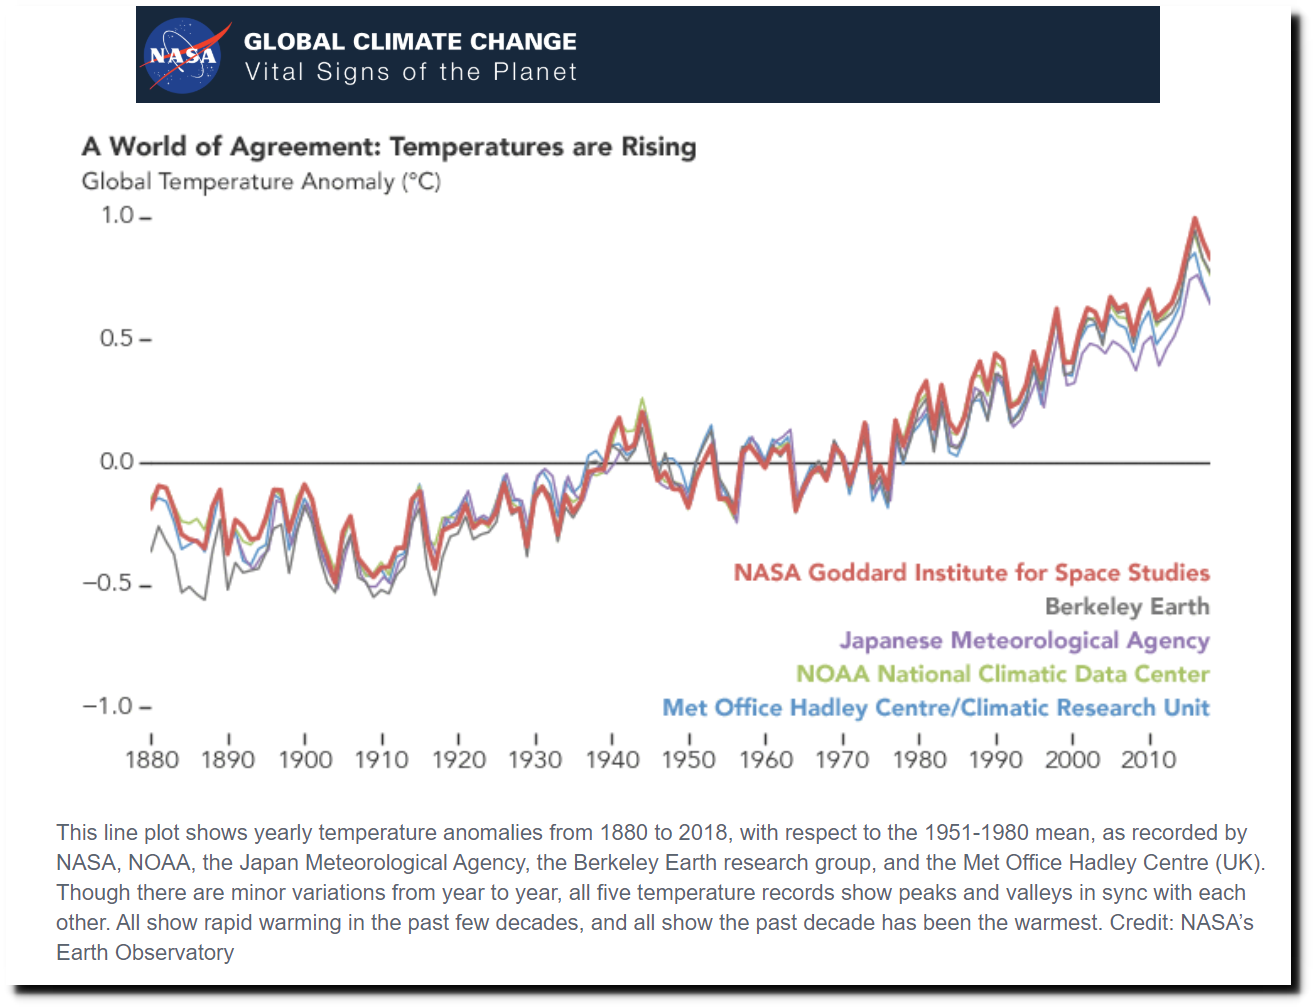
Evidence of climate fraud by leading government agencies is readily available all over the Internet. By using the term “conspiracy theory” – climate alarmists hope to keep people from looking at what is happening right in front of their faces.
Australian MP Craig Kelly also has pointed out to me that the thermometer at Reykjavik is located immediately adjacent to lots of asphalt and traffic.


Posted in Uncategorized
Leave a comment
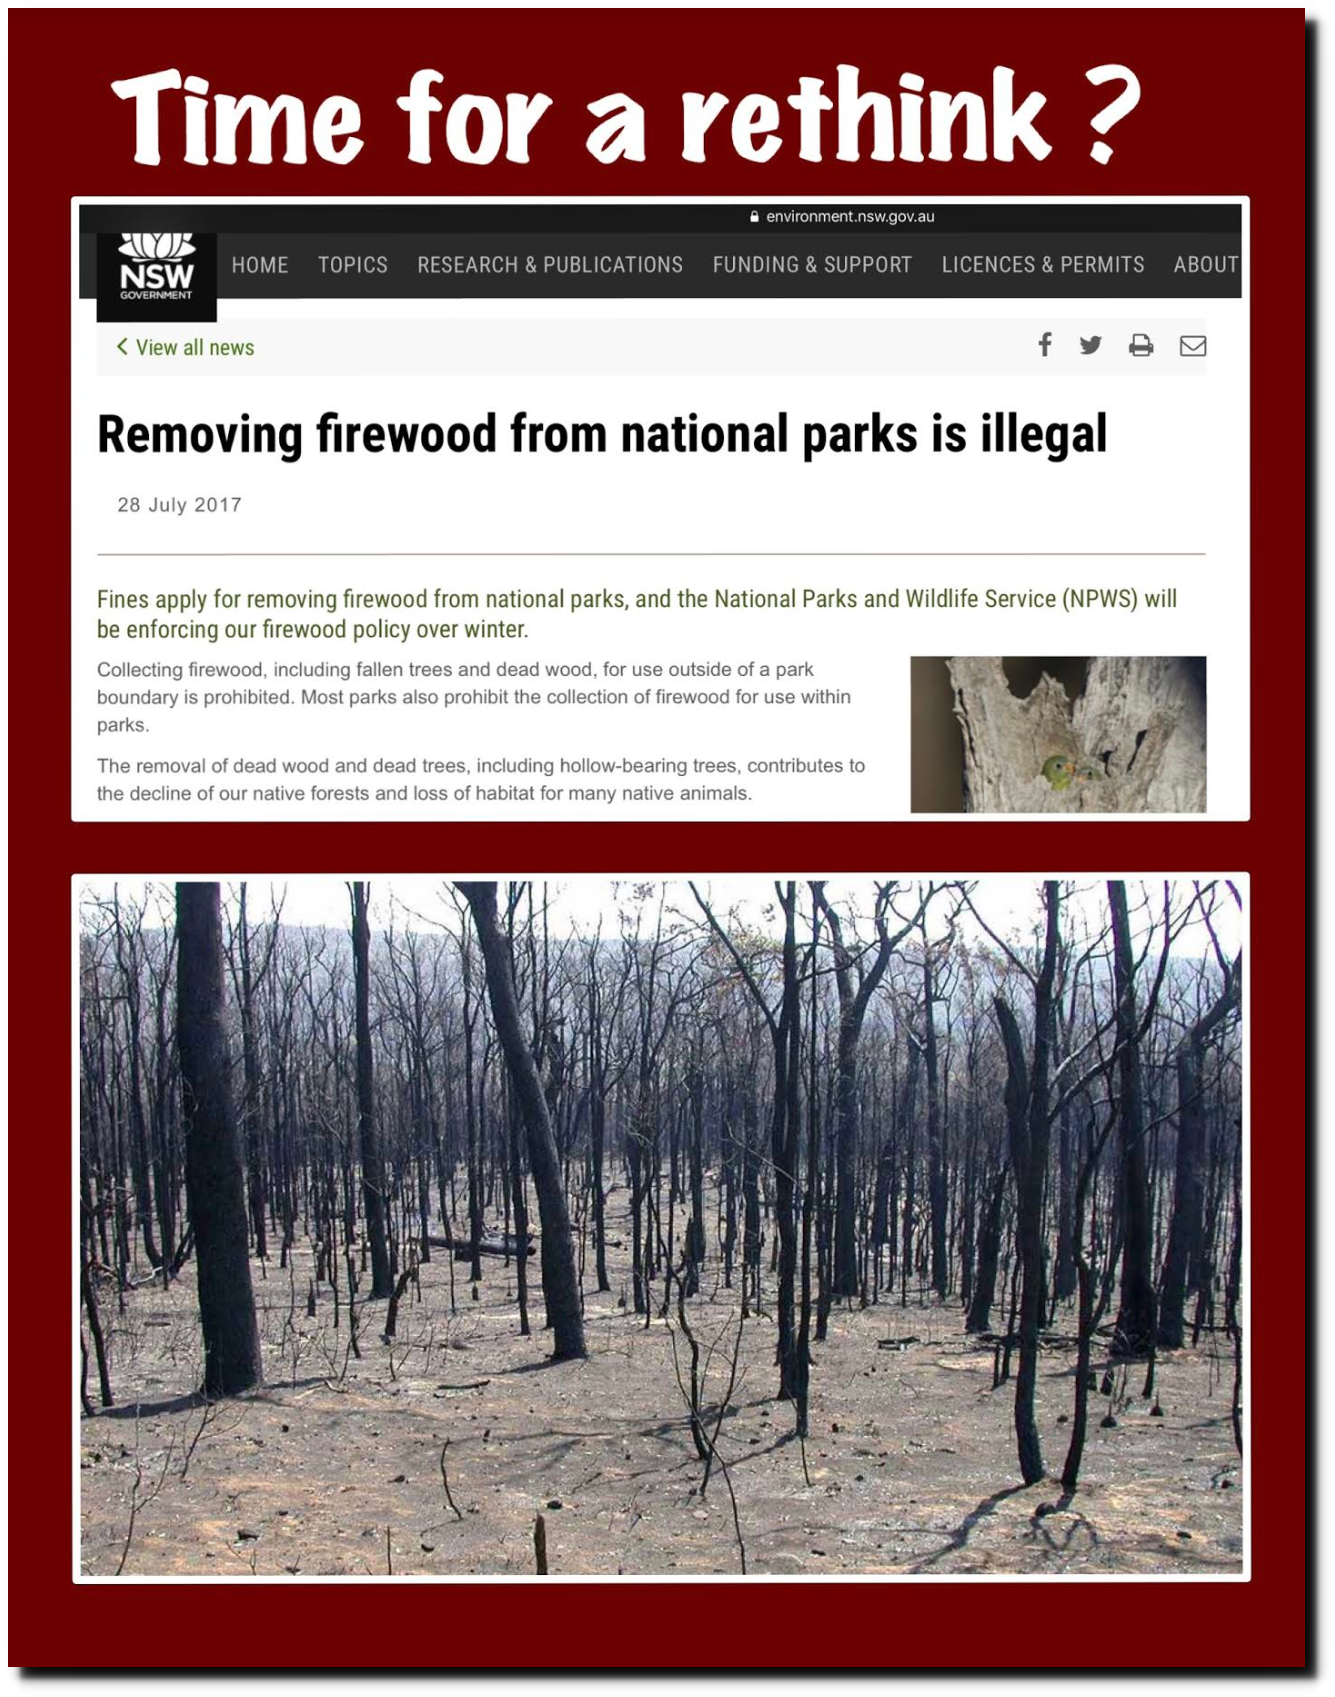
Report On The 1939 Fires
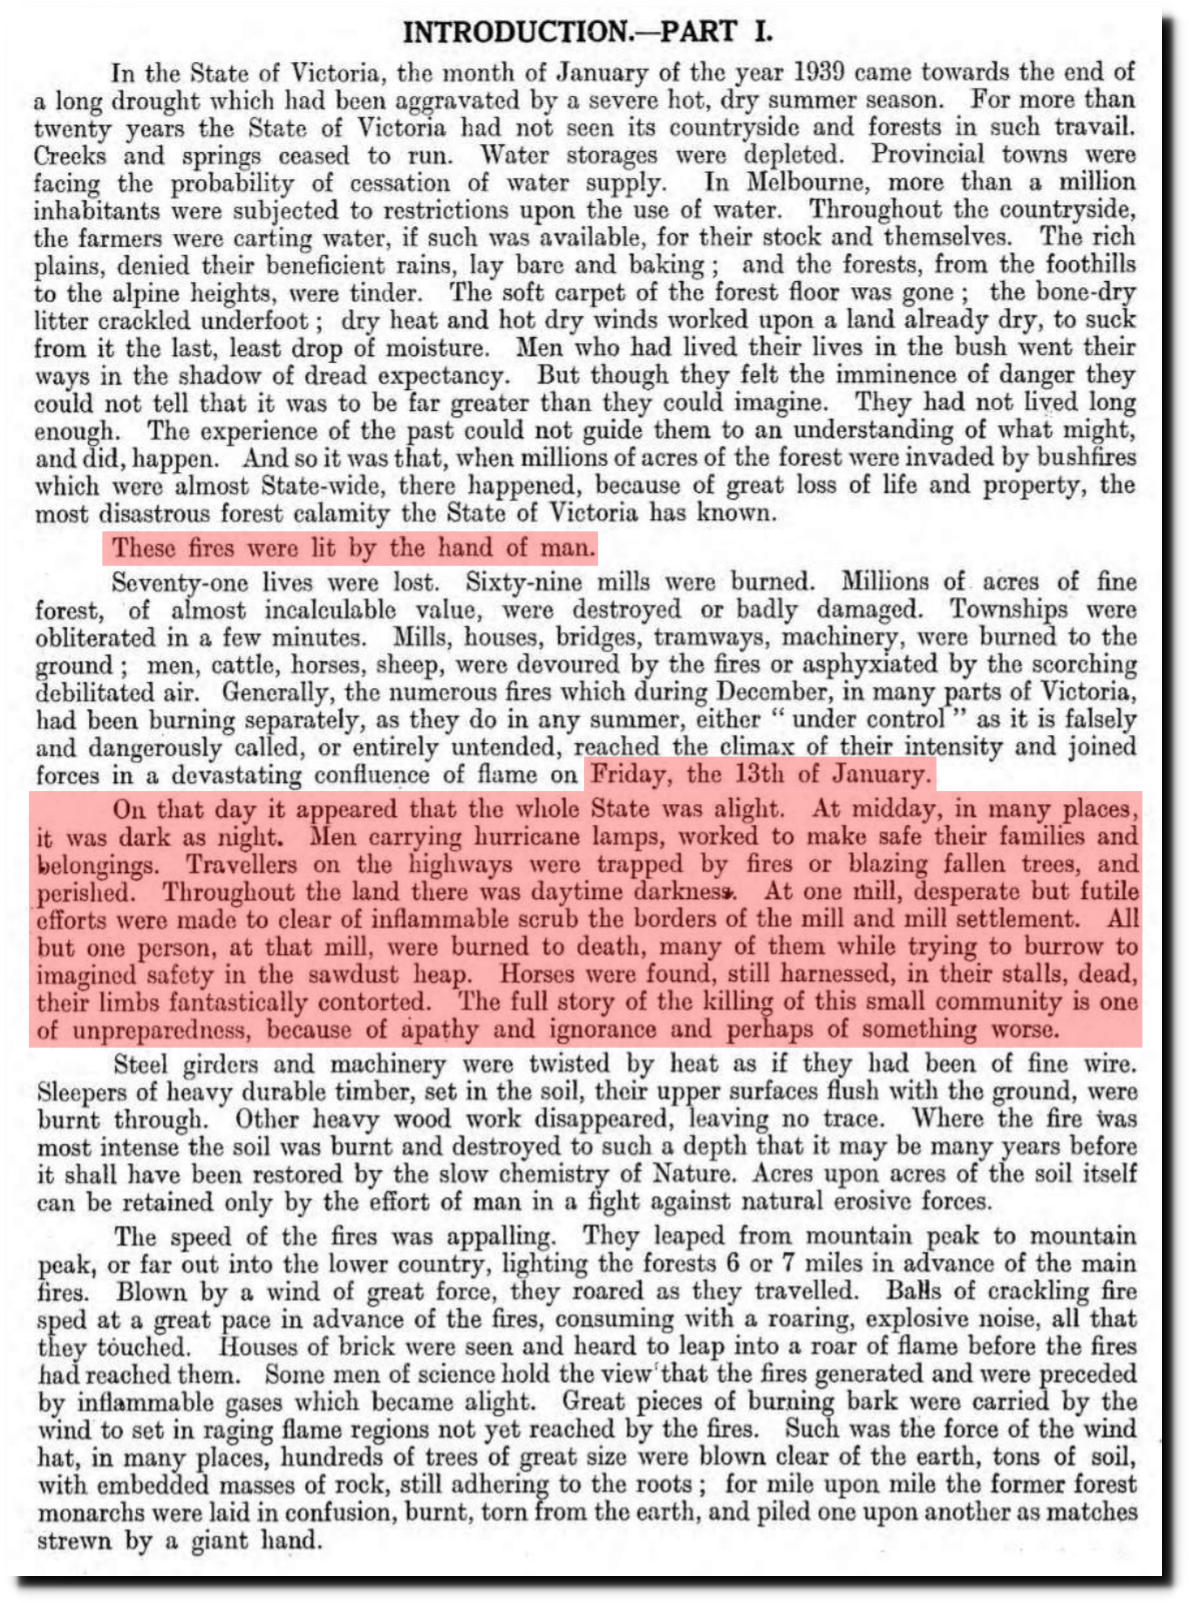
After the 1939 fires in Australia, there was a commission set up to study what happened and what could have been done differently.
- The fires were man-made
- There was a long drought followed by extreme heat
- Almost the entire state of Victoria appeared to be on fire on January 13
- It was dark as night at midday
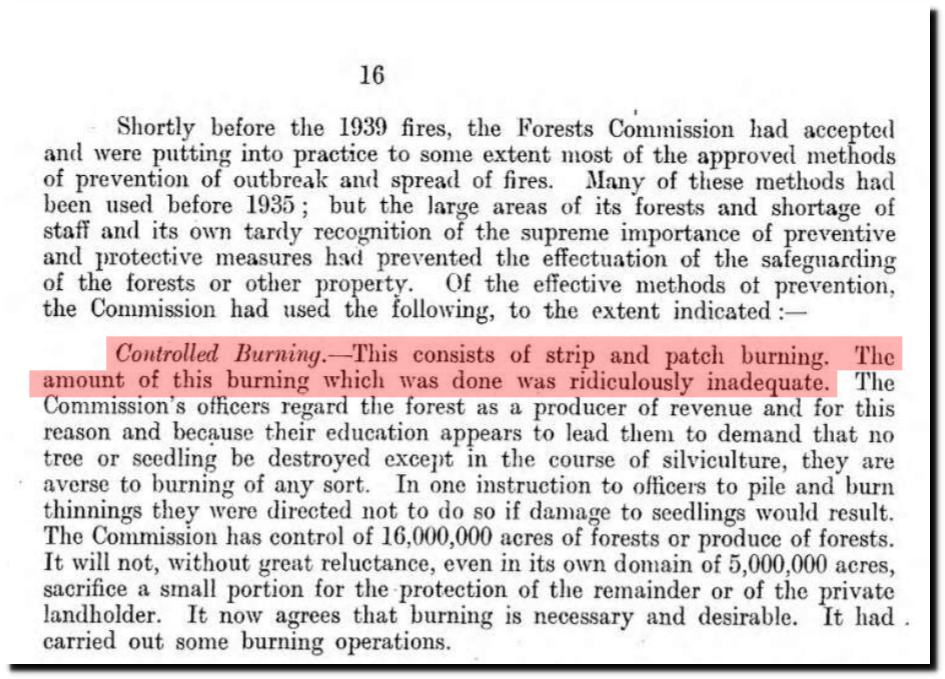
- The amount of controlled burning was “ridiculously inadequate”

Two days earlier was the hottest day on record in Melbourne, Canberra and Adelaide.
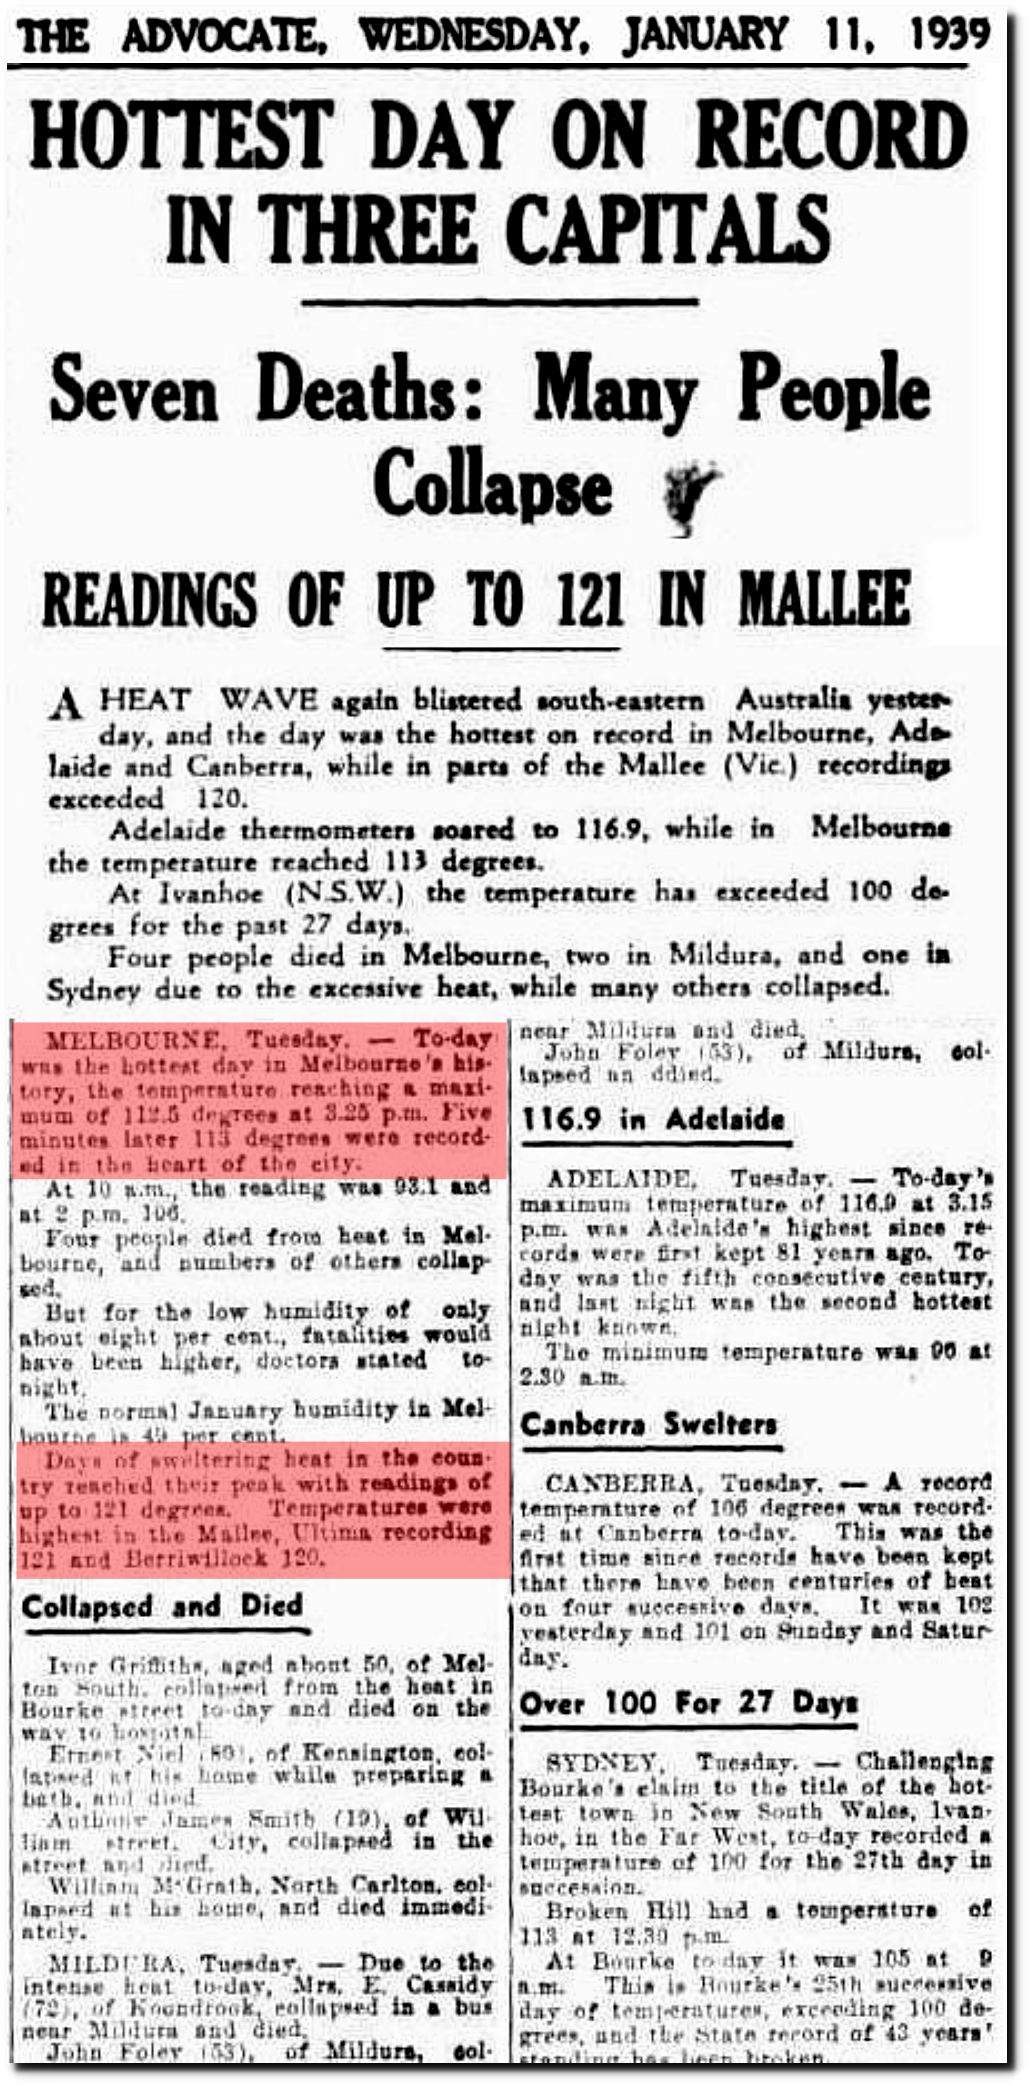
11 Jan 1939 – HOTTEST DAY ON RECORD IN THREE CAPITALS Seven Deaths: Many People Collapse – Trove
All the same mistakes were made again, with the same results.
As reported by Anthony Watts, Financial Times prefers dictatorship to controlled burns.
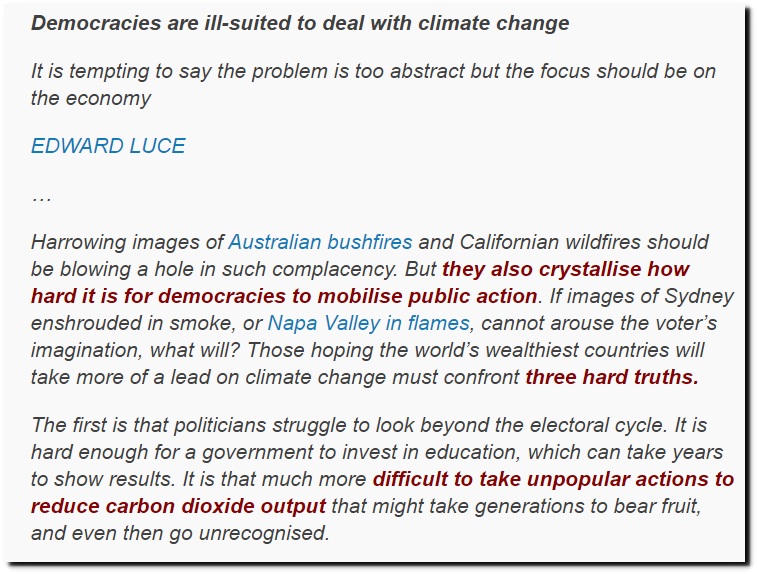
FT: “Democracies are ill-suited to deal with climate change” | Watts Up With That?
If we did that, we could have a safe climate like China, the world’s #1 producer of CO2 emissions.

25 May 1987 – CHINA Massive flooding as forest fire rages – Trove
Climate Goals Pledged by China and the U.S. – The New York Times
Posted in Uncategorized
Leave a comment
The History Of The Arctic
In the distant past, palm trees grew in Greenland.
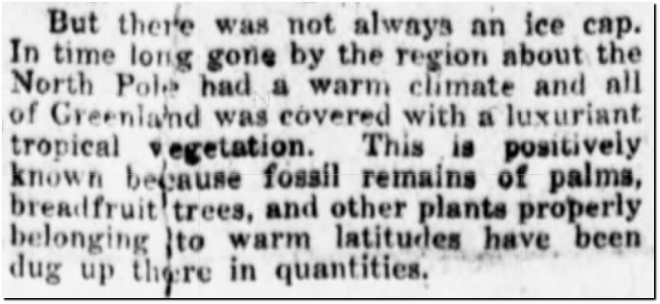
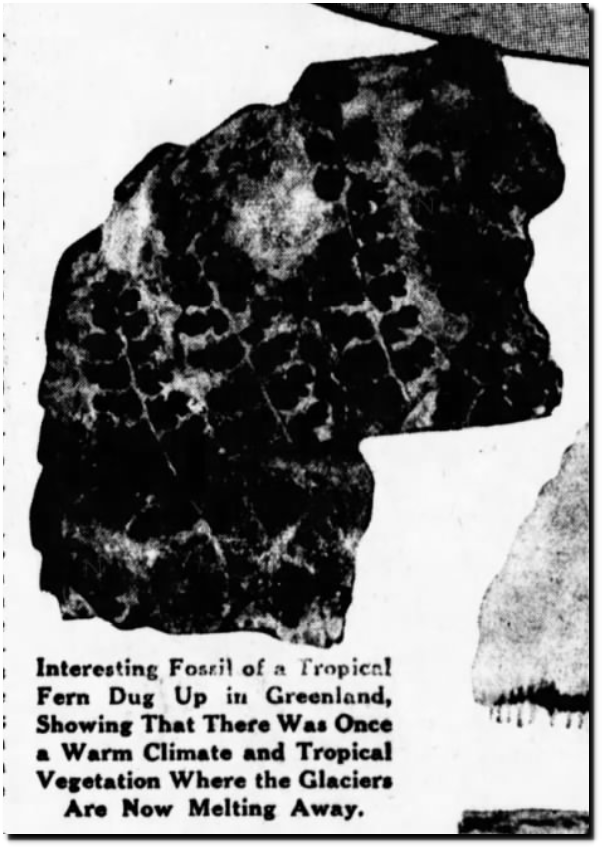
03 Dec 1922, Page 63 – The Washington Times at Newspapers.com
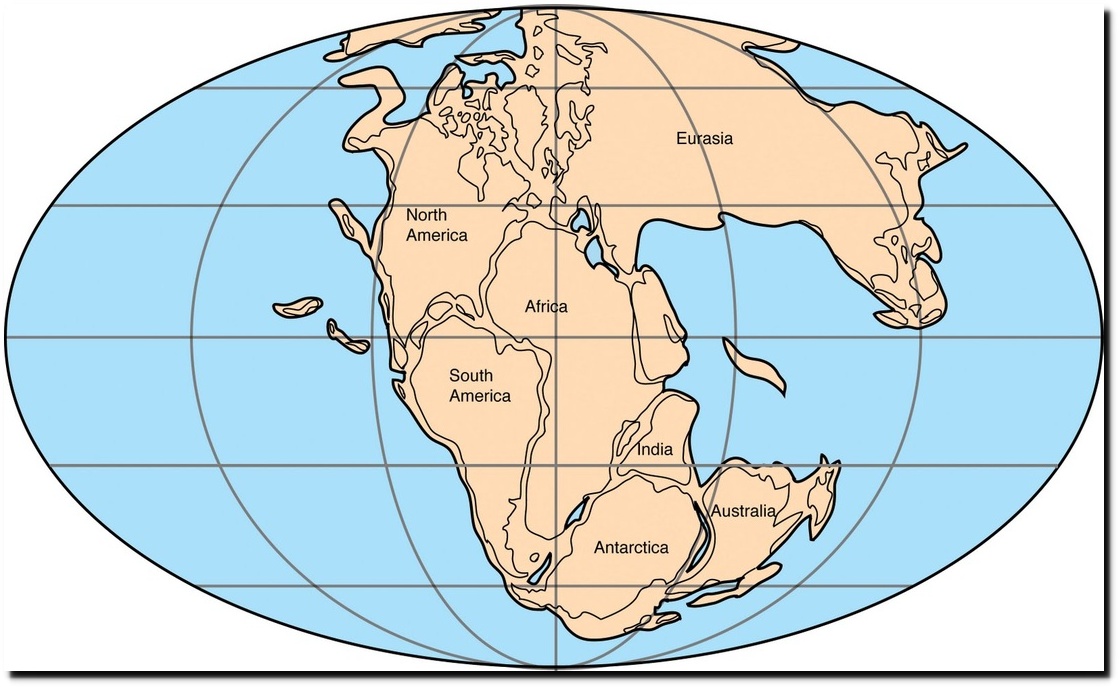
Greenland wasn’t quite as far north 250 million years ago as it is now.
The Arctic Ocean is believed to have been ice-free around the time Stonehenge was built, with atmospheric CO2 at pre-industrial levels.
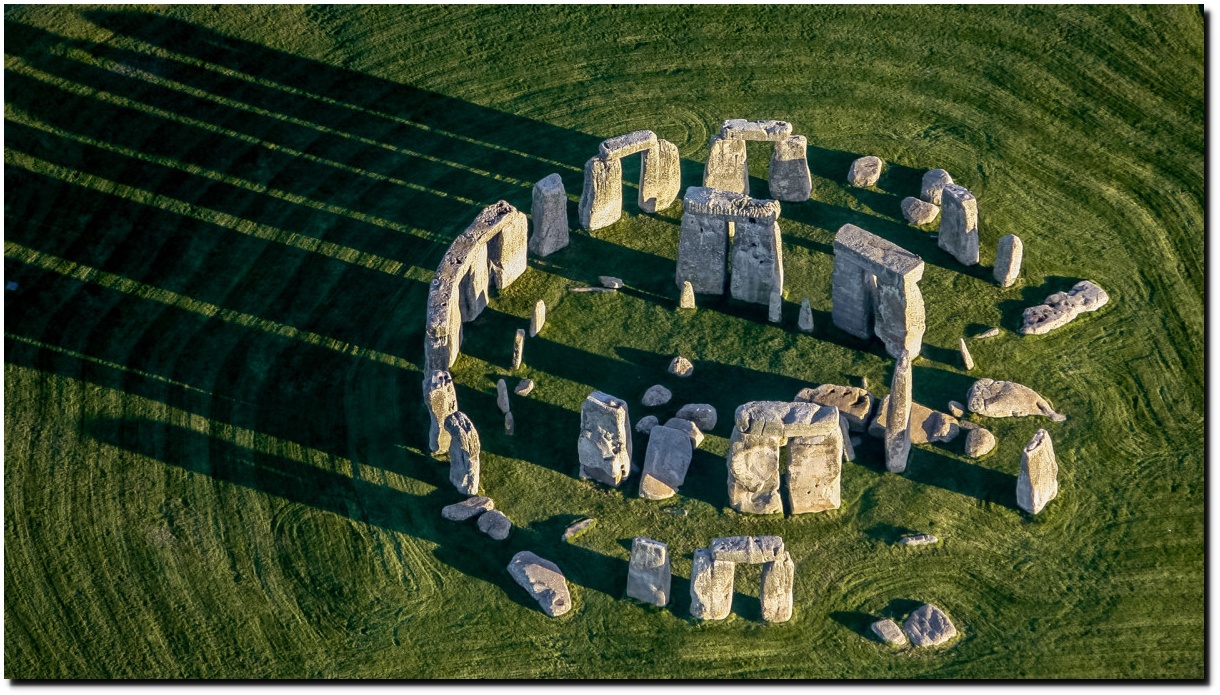
Less Ice In Arctic Ocean 6000-7000 Years Ago — ScienceDaily
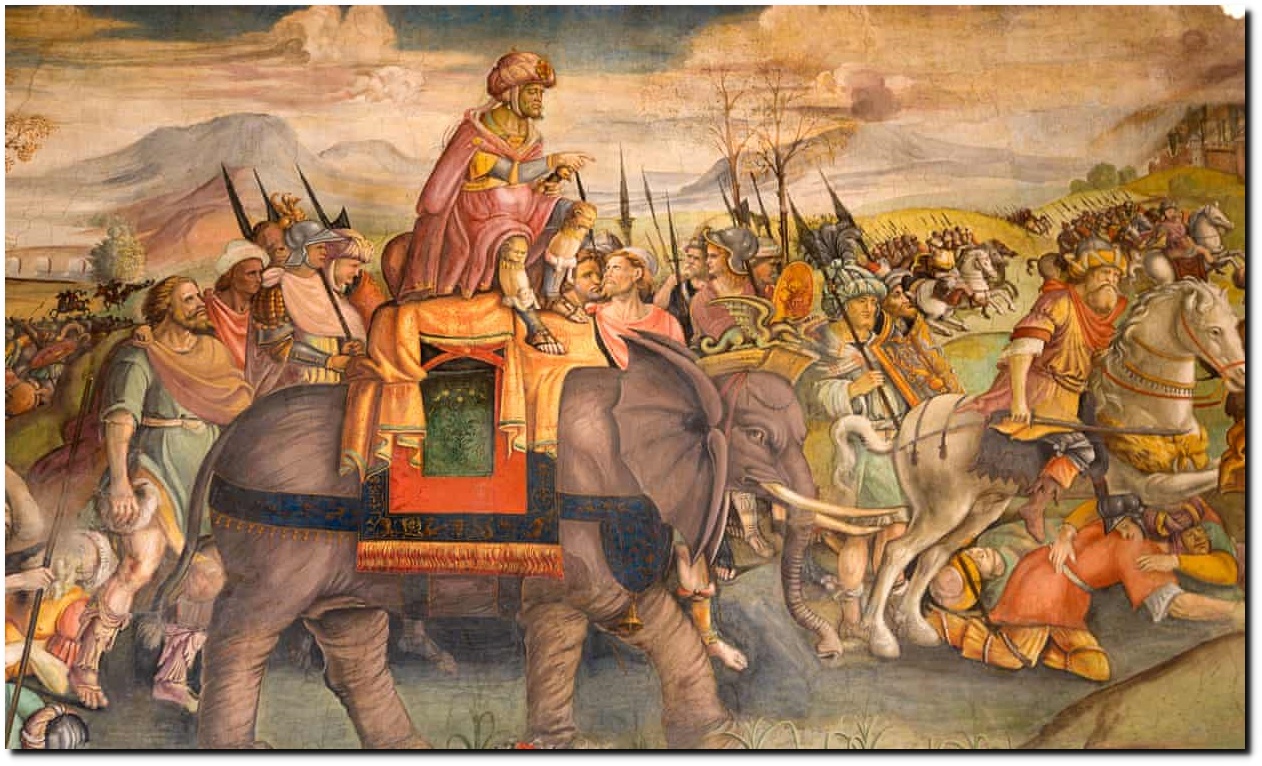
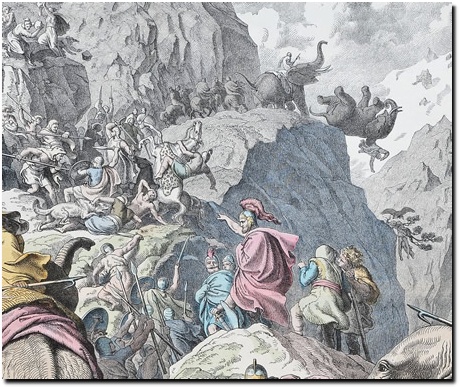
Hannibal took elephants across the Alps in 181 BC.
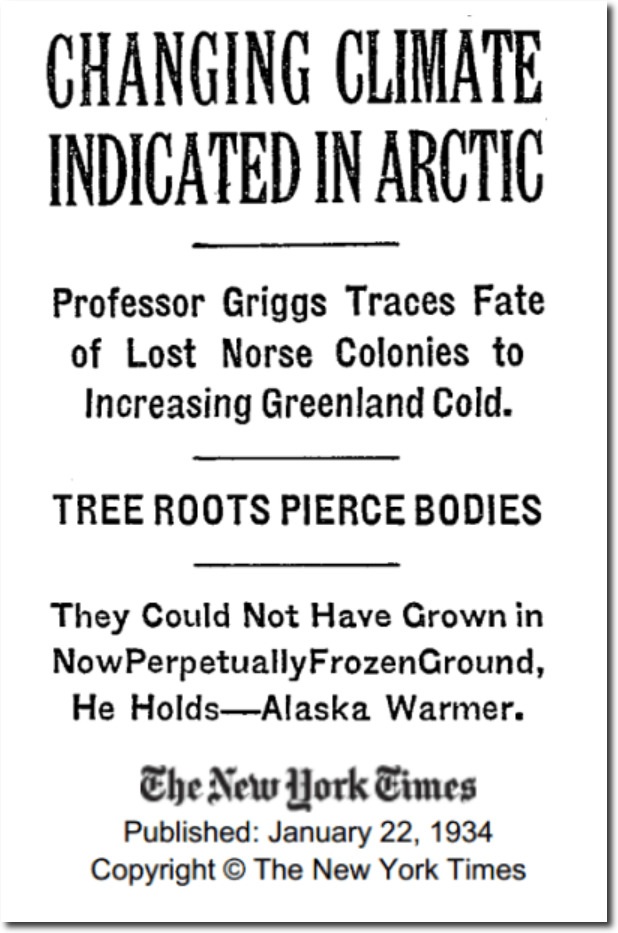
It is also known that the Arctic was much warmer one thousand years ago, with atmospheric CO2 at pre-industrial levels. Then the Arctic got much colder and the Vikings in Greenland froze to death.
The 1990 IPCC report recognized the warmth of 1,000 years ago, and subsequent cooling into the 17th century. This was called the Medieval Warm Period and Little Ice Age.
NASA’s James Hansen also recognized that in 1983.
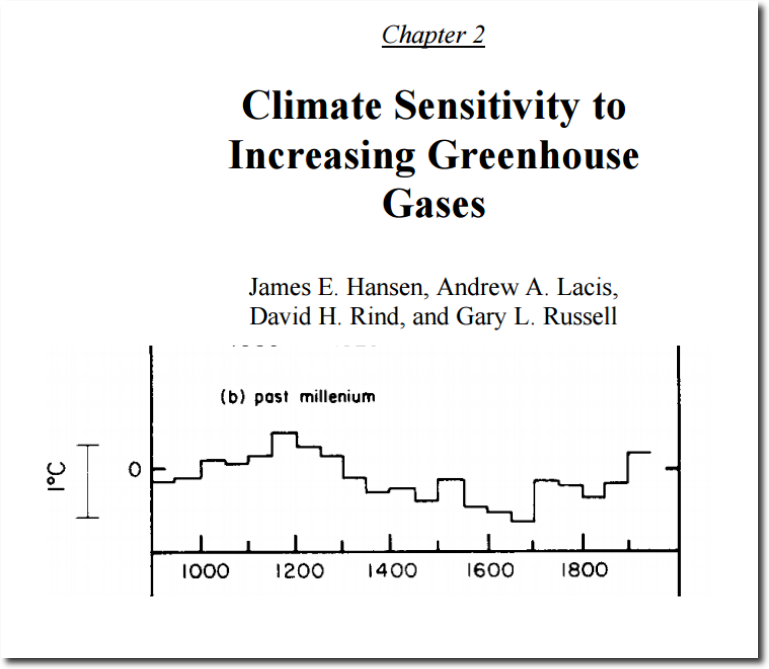
Global temperature trend is based on temperatures in central England, the tree limit in the White Mountains of California, and oxygen isotope measurements in the Greenland ice (W. Dansgaard of the Geophysical Isotope Laboratory, University of Copenhagen, pers. comm.), with the temperature scale set by the variations in the last 100 years
Glaciers in the Aps were either small or non-existent one thousand years ago.
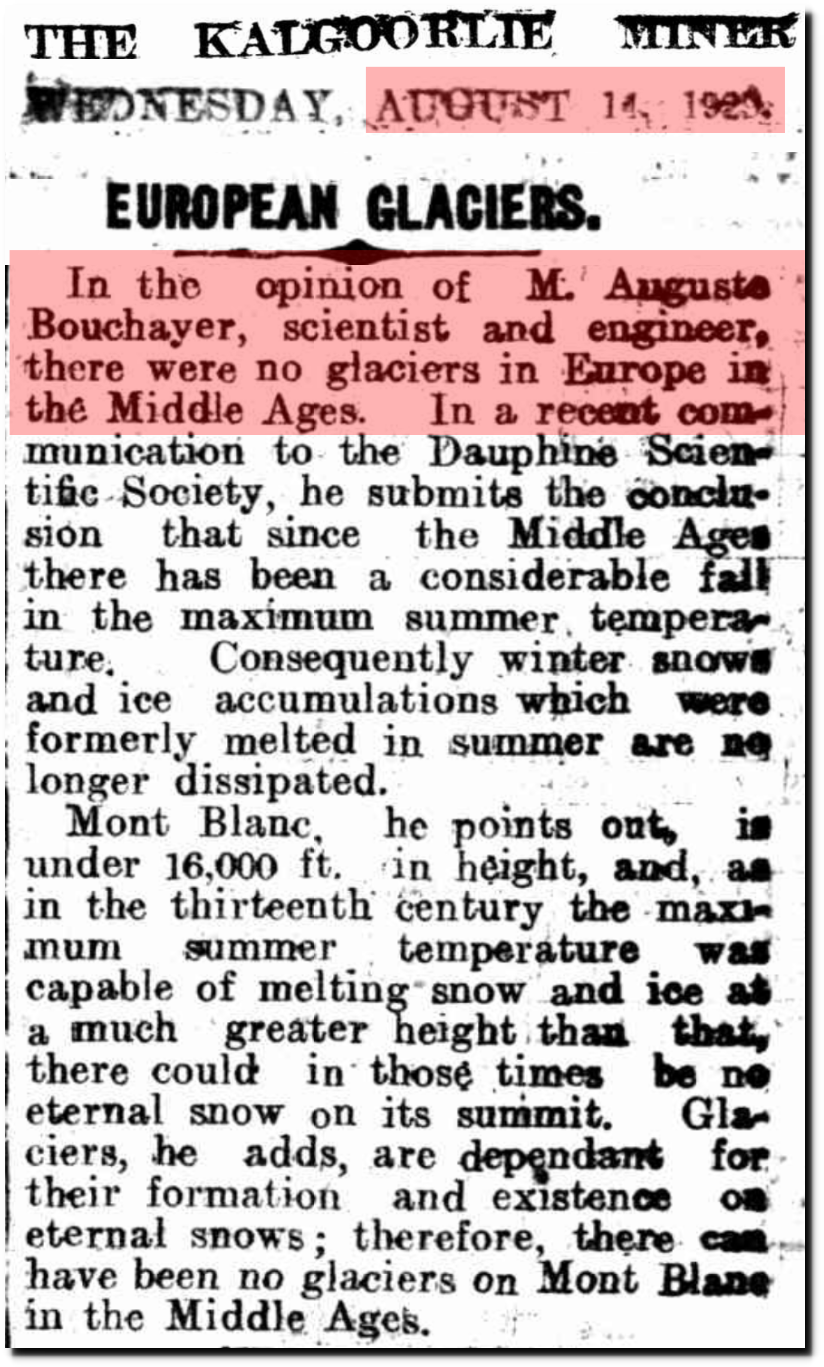
14 Aug 1929 – EUROPEAN GLACIERS. – Trove
The glaciers expanded rapidly during the Little Ice Age, and then started retreating again about 200 years ago. Glacier Bay, Alaska retreated 50 miles between 1790 and 1880.
Greenland’s Jakobshavn Glacier retreated more than two feet per day from 1850 to 1903.
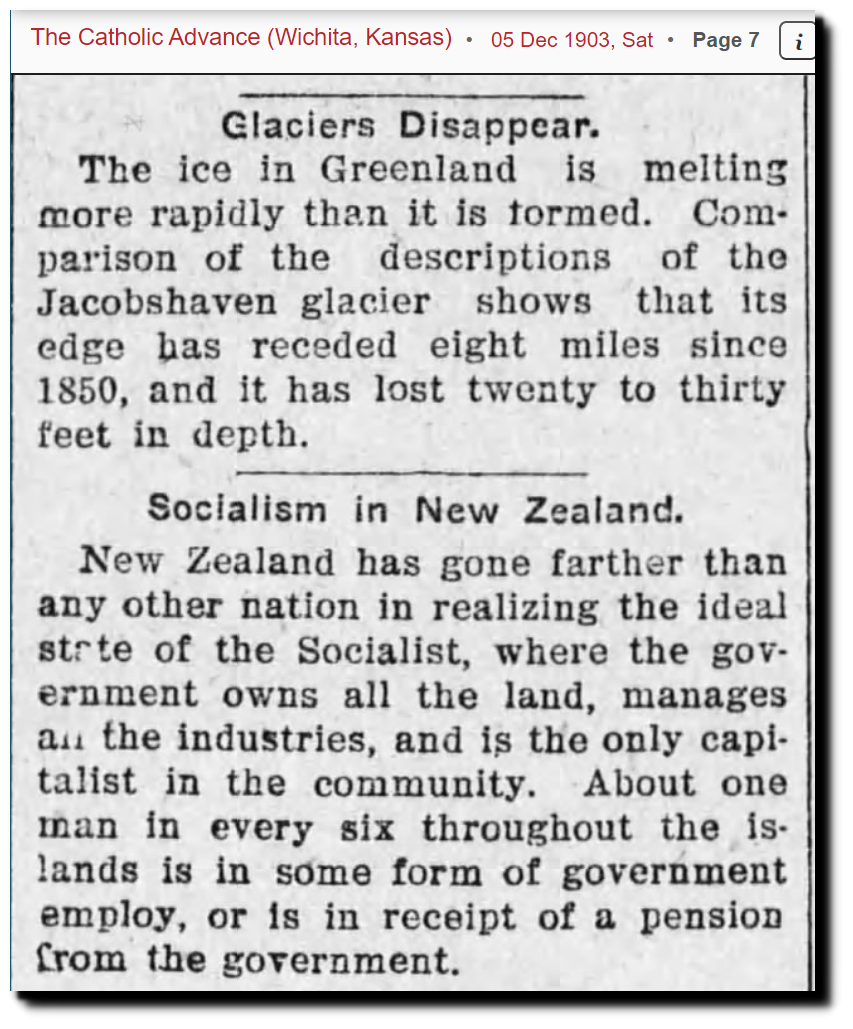
05 Dec 1903, Page 7 – The Catholic Advance at Newspapers.com
Geological Survey of Denmark and Greenland Bulletin 14, 14-25
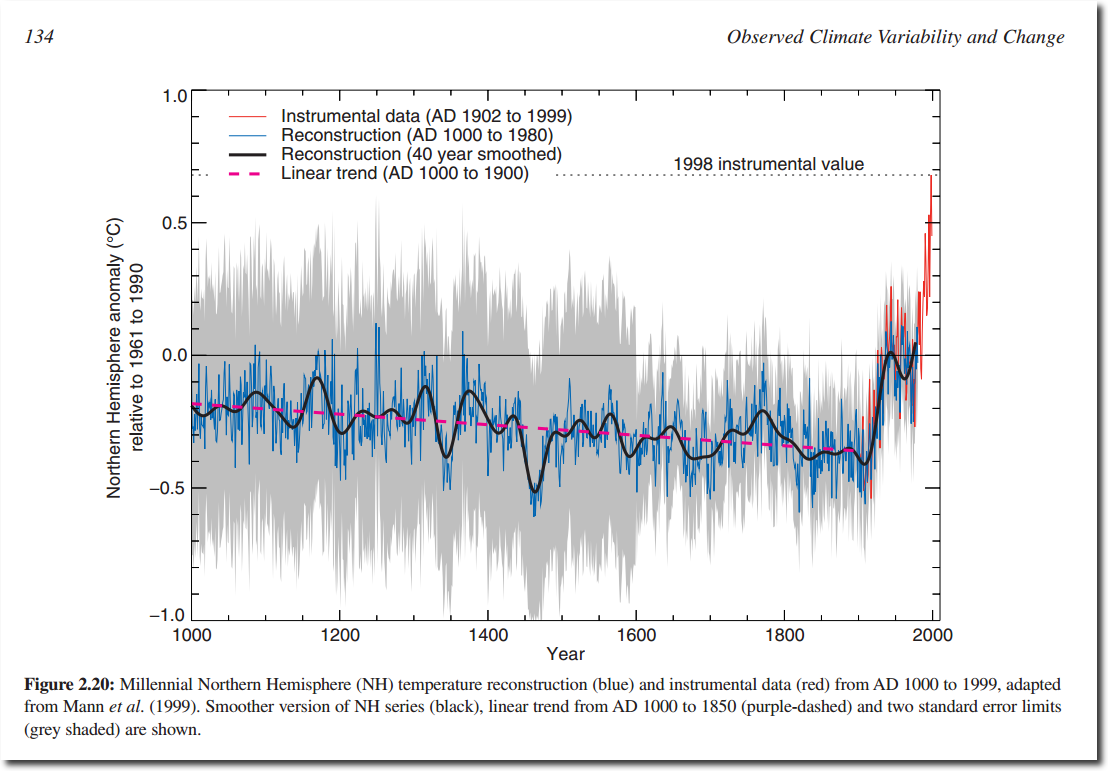
Michael Mann and the IPCC have since erased the Medieval Warm Period and Little Ice Age.
The press is currently hysterical about Arctic sea ice, predicting its imminent demise.
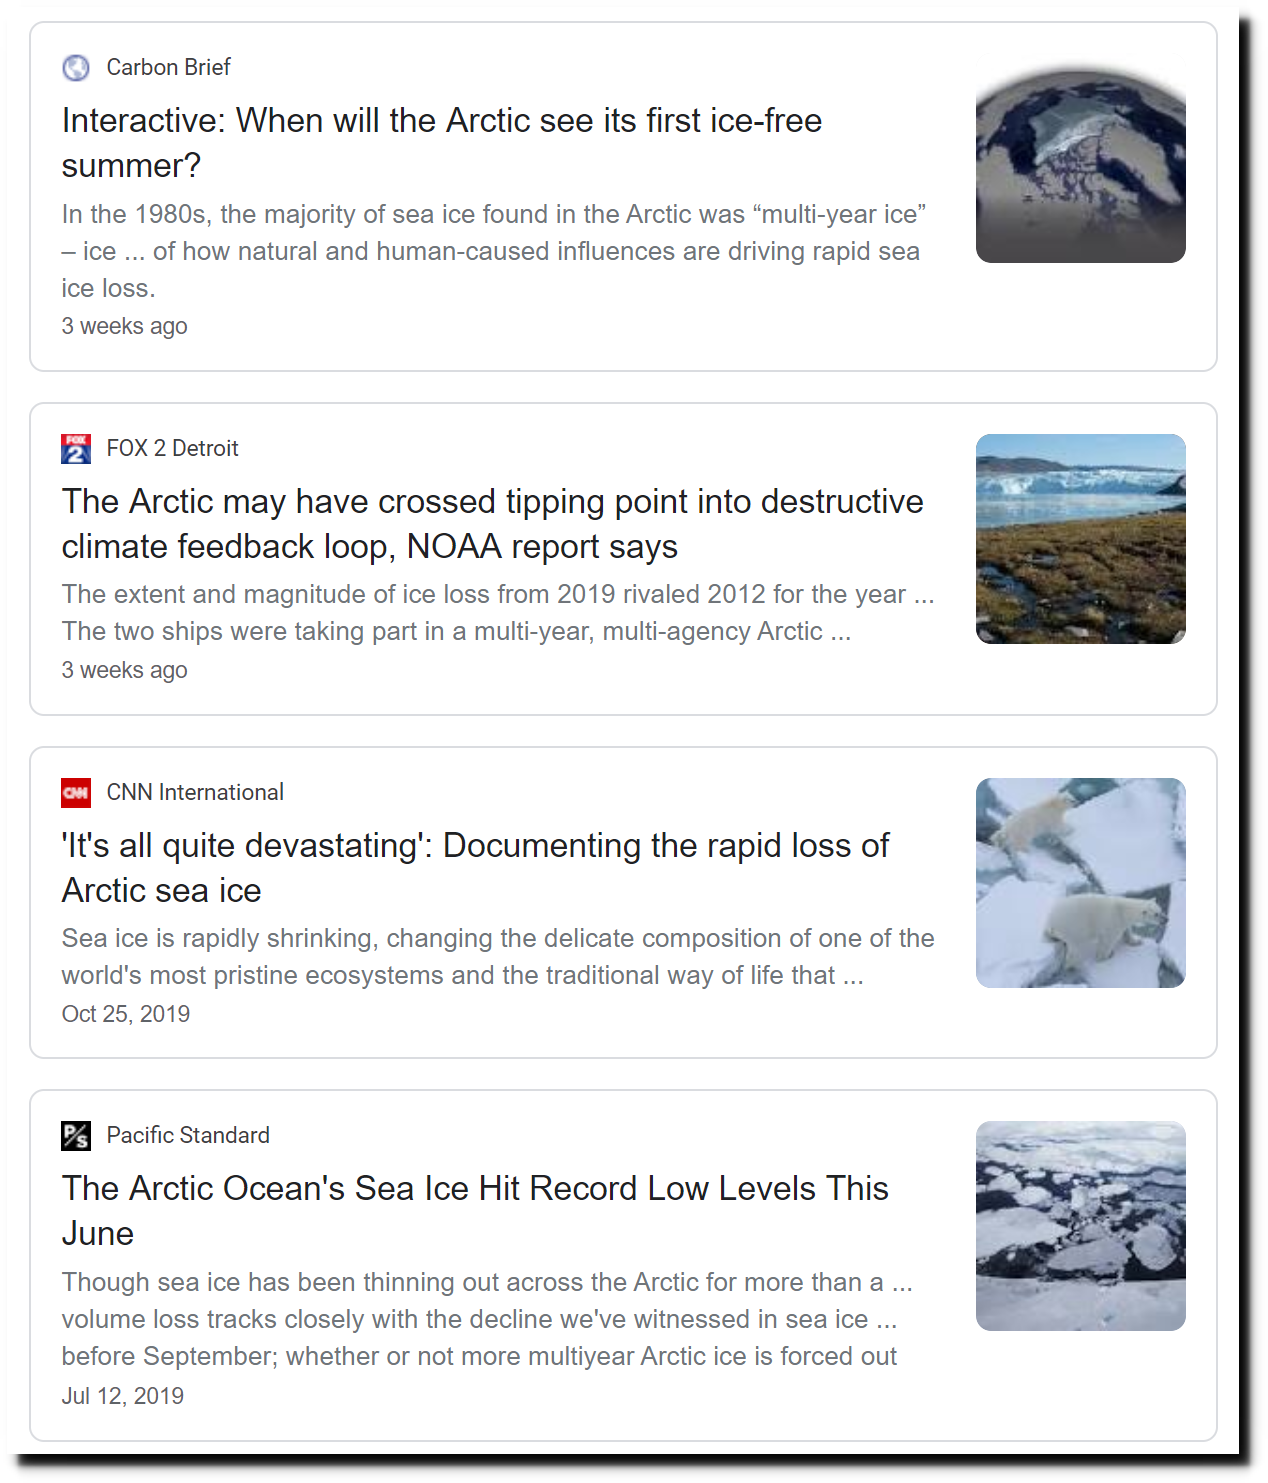
Thus continuing a long line of failed predictions.
Expert: Arctic polar cap may disappear this summer_English_Xinhua
North Pole May Be Ice-Free for First Time This Summer
BBC NEWS | UK | Swimmer aims to kayak to N Pole
Star-News – Google News Archive Search
Arctic Sea Ice Gone in Summer Within Five Years?
BBC NEWS | Science/Nature | Arctic summers ice-free ‘by 2013’
Gore: Polar ice cap may disappear by summer 2014
In the real Arctic, sea ice extent started and ended 2019 as the highest in five years.
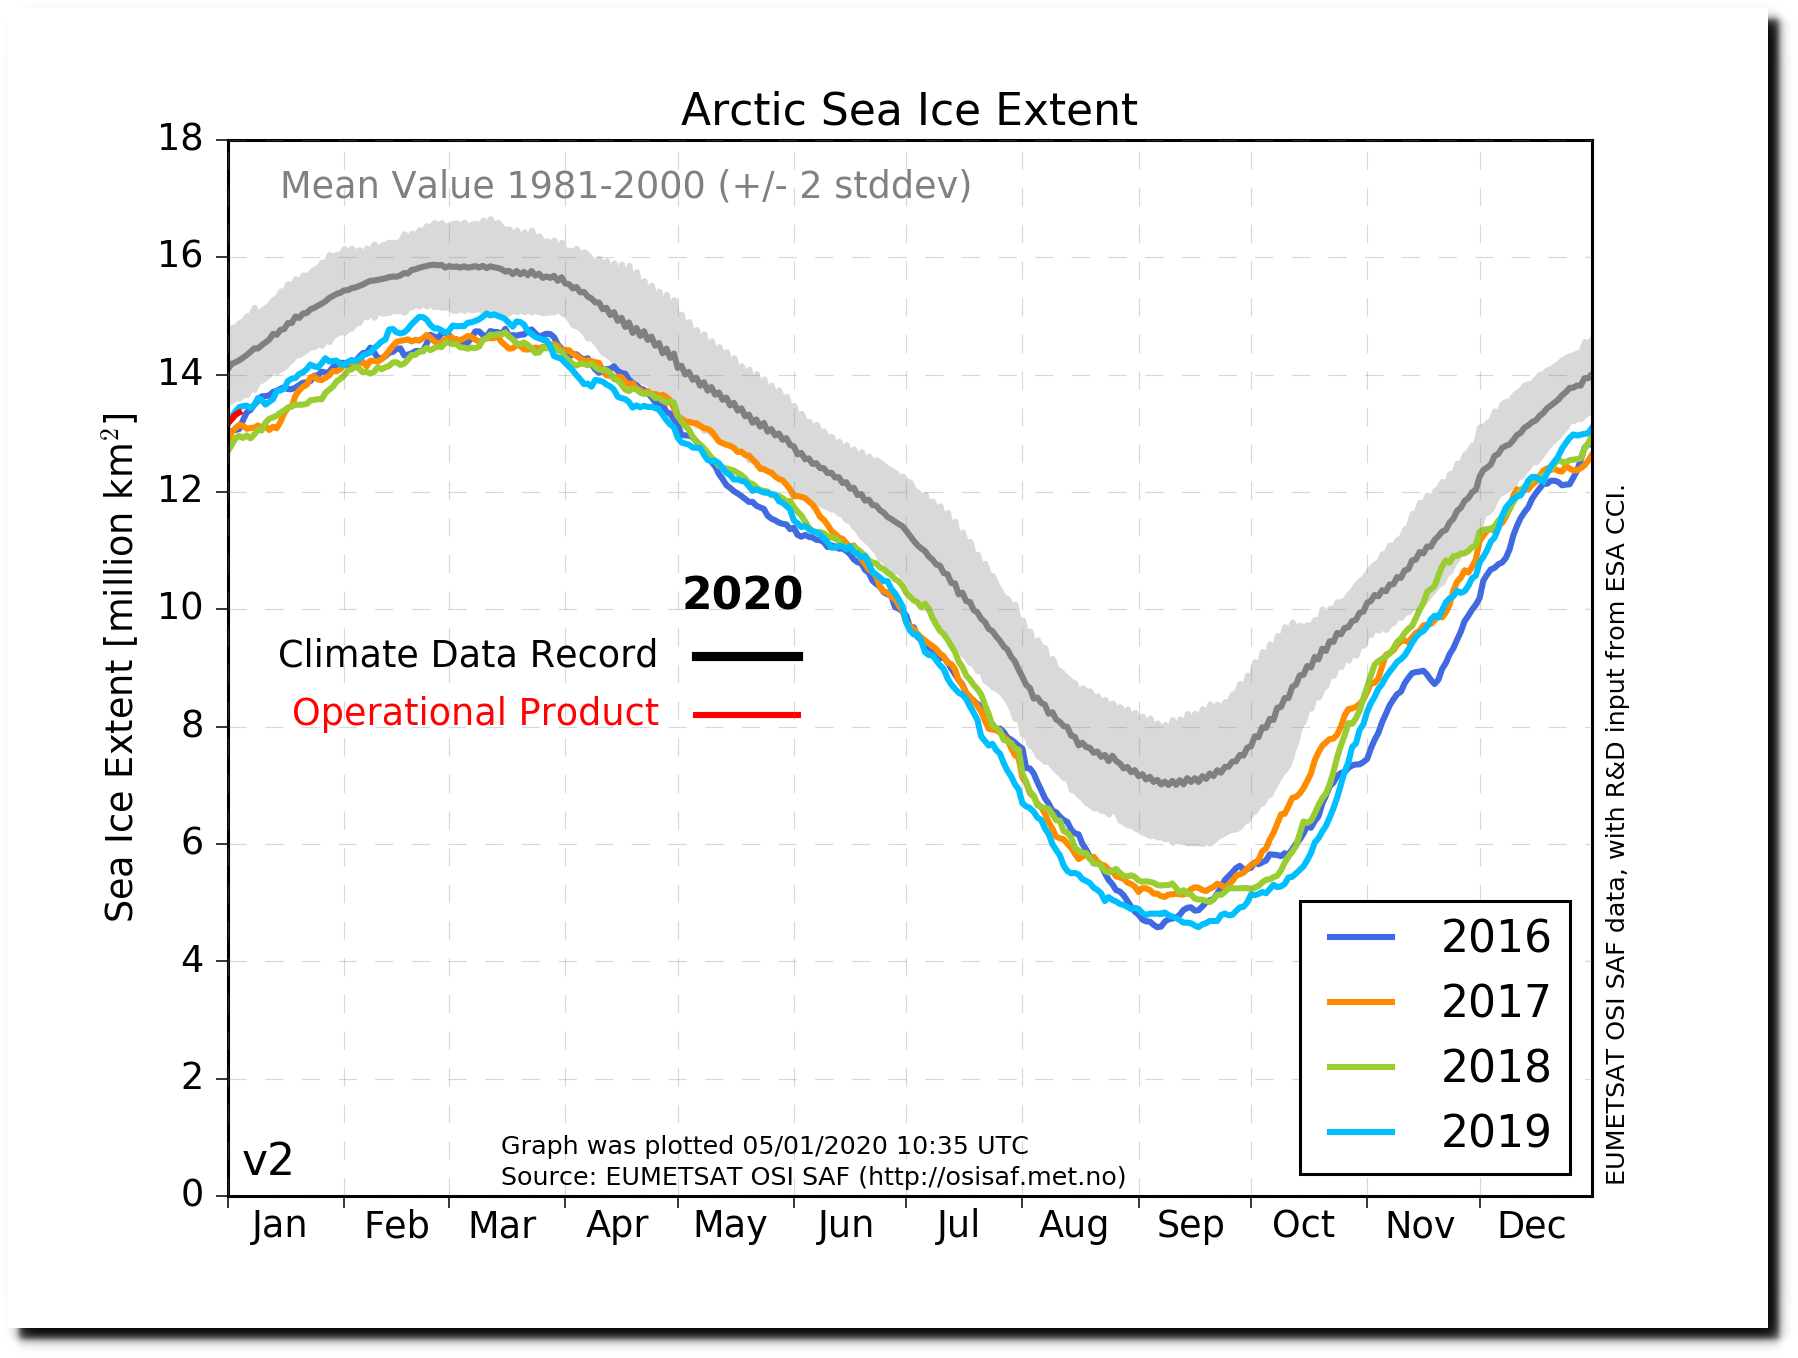
Ocean and Ice Services | Danmarks Meteorologiske Institut
Ice extent is very close to the 1981-2010 median.
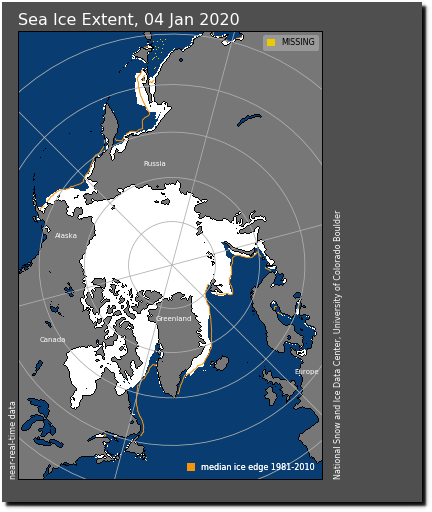
NOAA/G02135/north/daily/images/2020/01_Jan/N_20200104_extn_v3.0.png
Arctic sea ice extent is highest for the date in eight years.
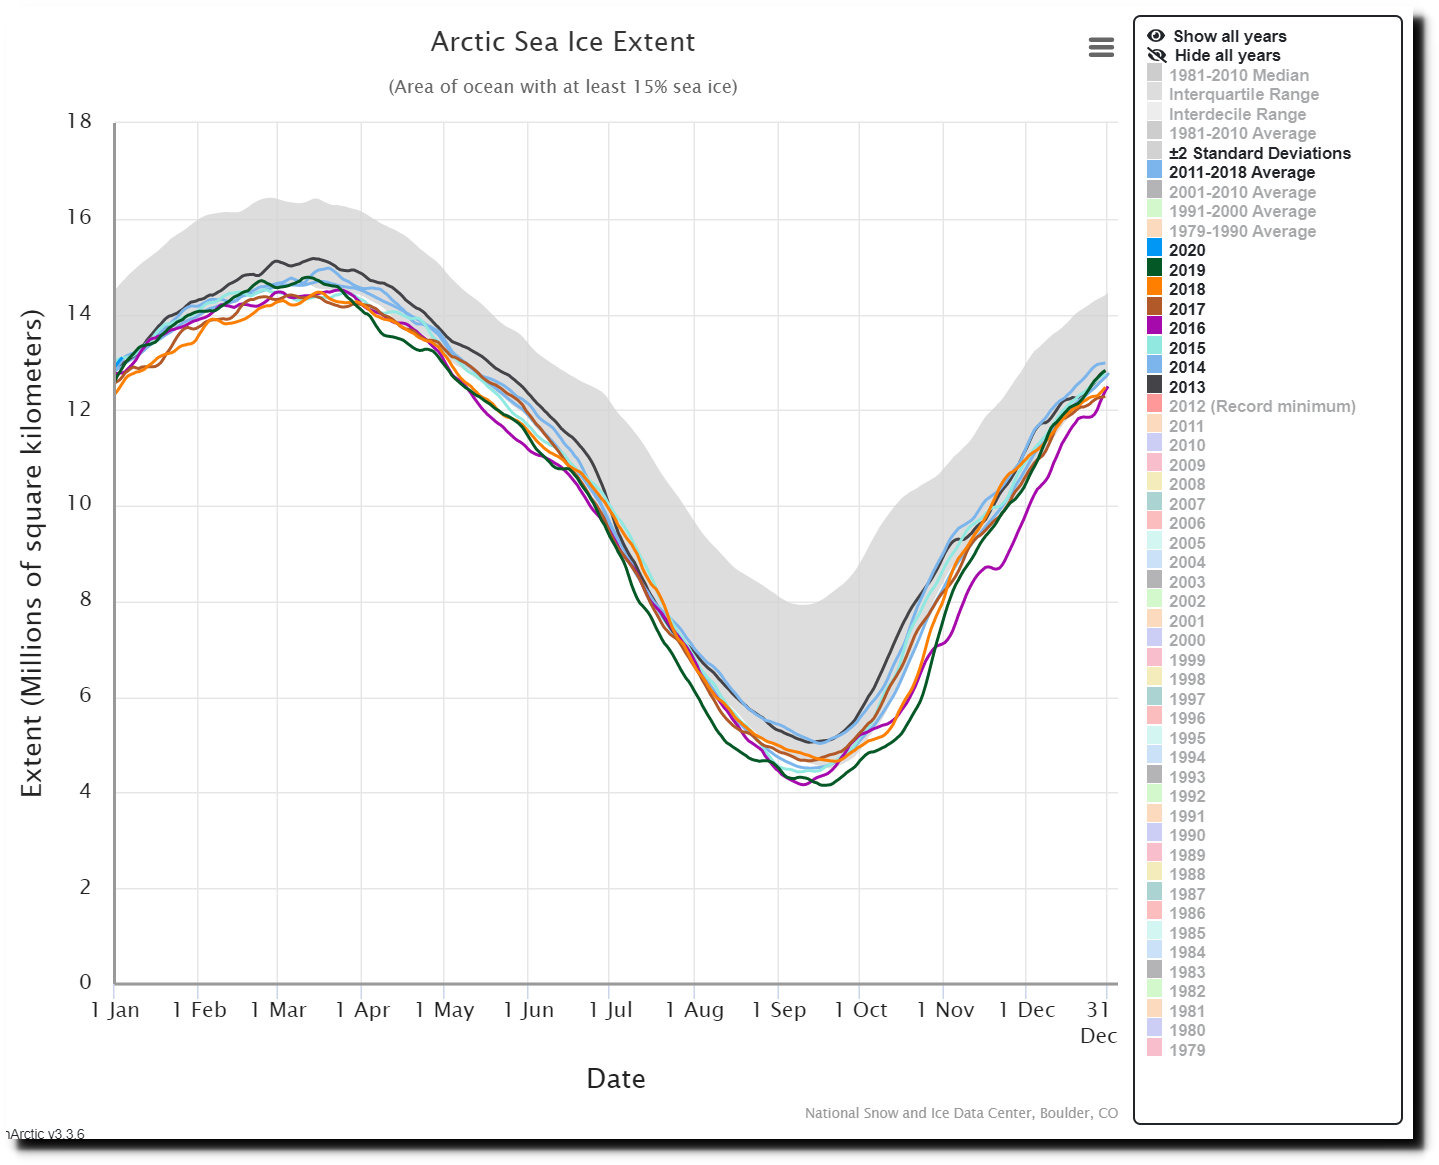
Charctic Interactive Sea Ice Graph | Arctic Sea Ice News and Analysis
And there has been no trend in Arctic sea ice extent since 2007, when climate alarmists started making the their forecasts of imminent doom.
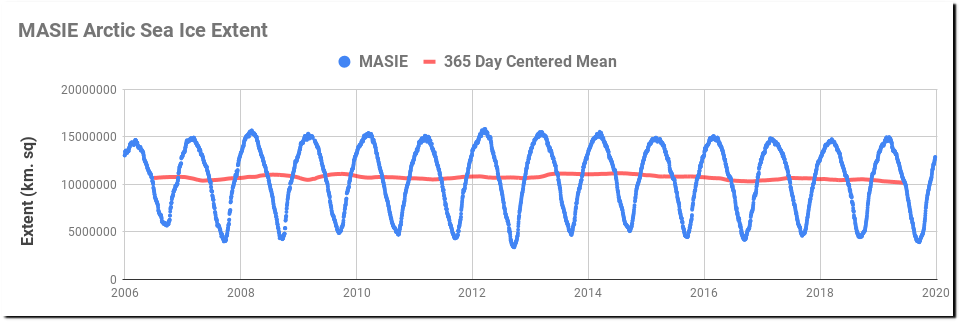
NOAA/G02186/masie_4km_allyears_extent_sqkm.csv
The National Climate Assessment shows Arctic sea ice rapidly declining since 1979.
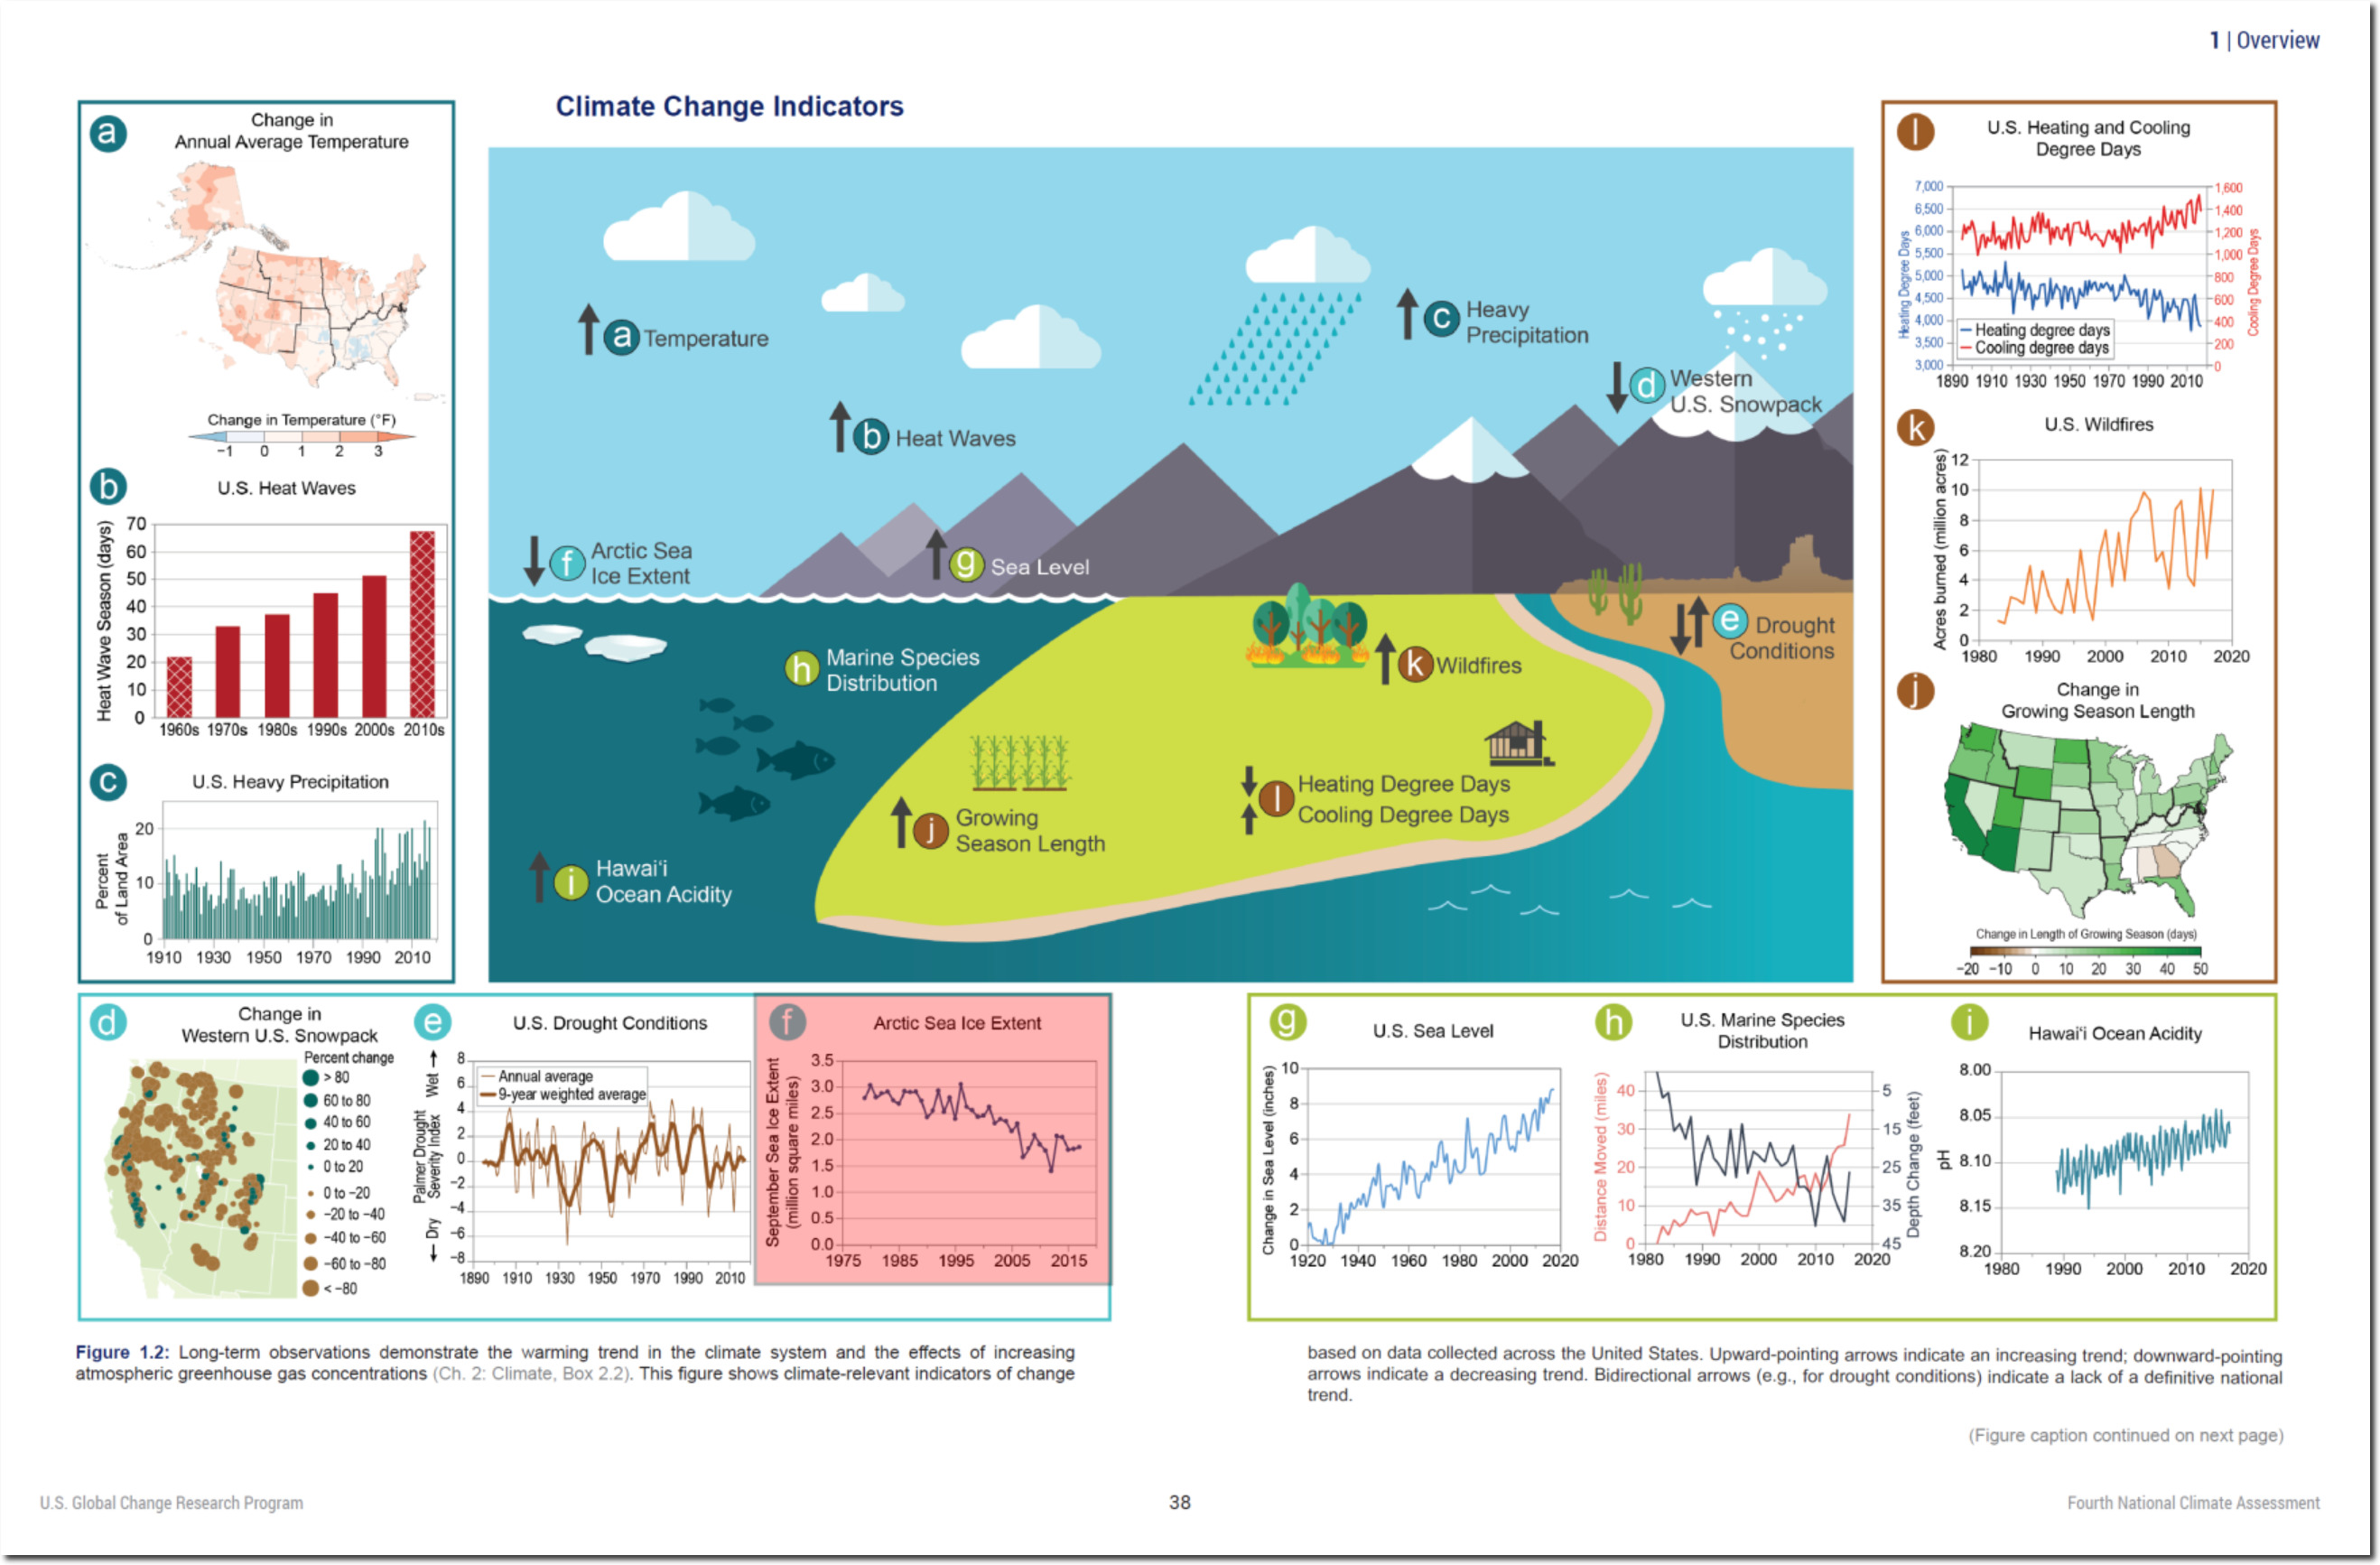
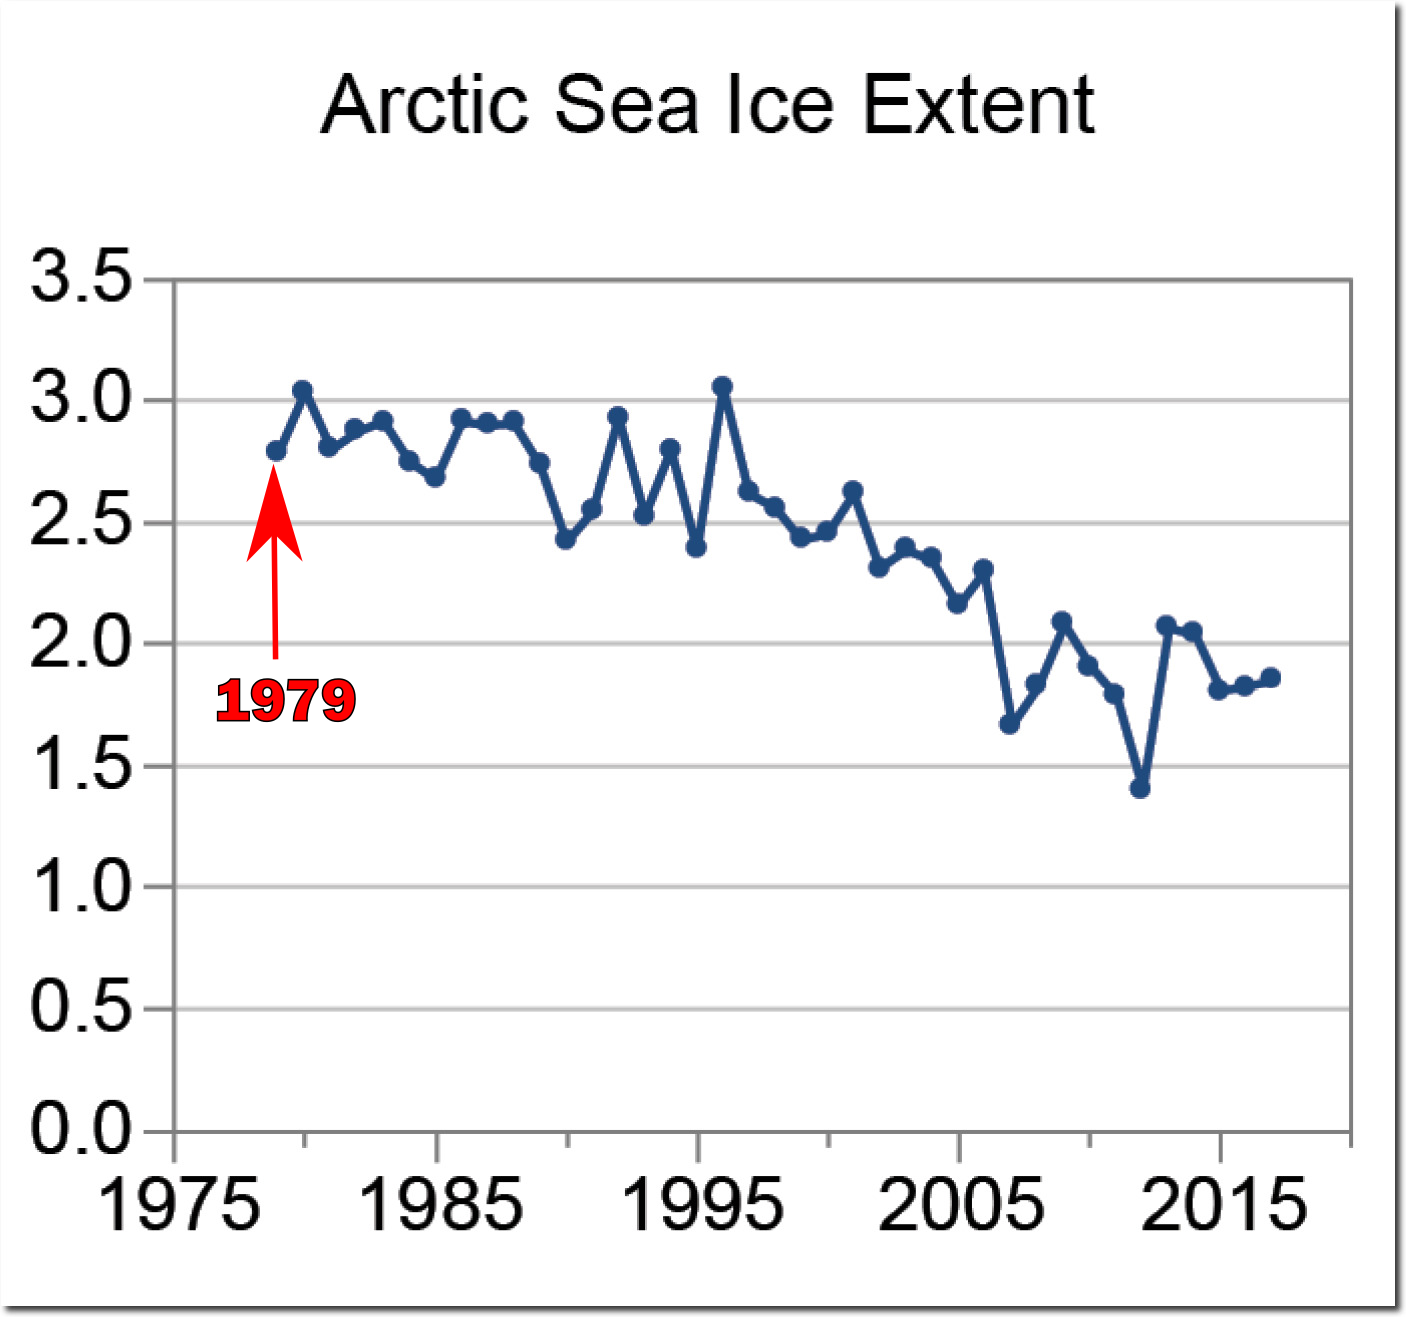
Fourth National Climate Assessment
Alarmists claim that they start their graphs in 1979, because that is the start of satellite records.
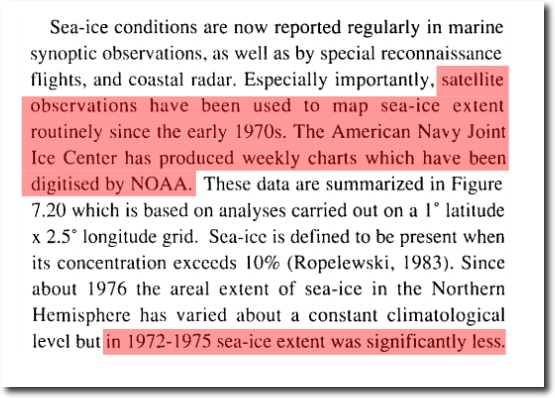
Sea ice extent has been monitored by passive microwave instruments on satellite platforms since 1979, providing a 39-year long perspective on changing coverage over the last several decades.
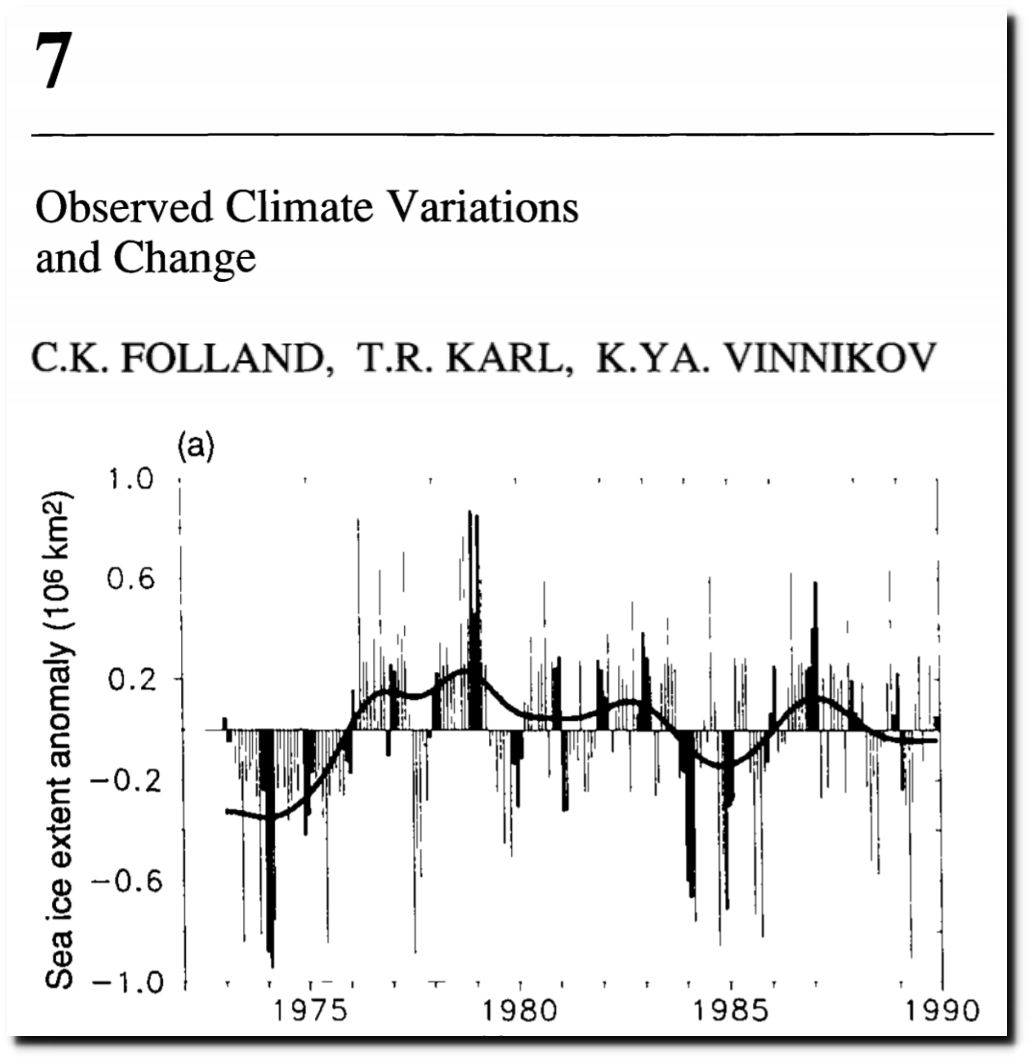
But the 1990 IPCC report shows that they are not being honest. satellite records go back to the early 1970s, when “sea ice extent was significantly less.”
In the 1985 DOE Report, Vinnikov showed that Arctic sea ice declined sharply until the century low in the mid-1950s, and then started to increase again.

Projecting the climatic effects of increasing carbon dioxide
This chart combines the 1985 and 1990 Vinnikov graphs, and shows that government agencies now start their sea ice graphs at the century maximum.

The graphs also start at the coldest year on record in Iceland.
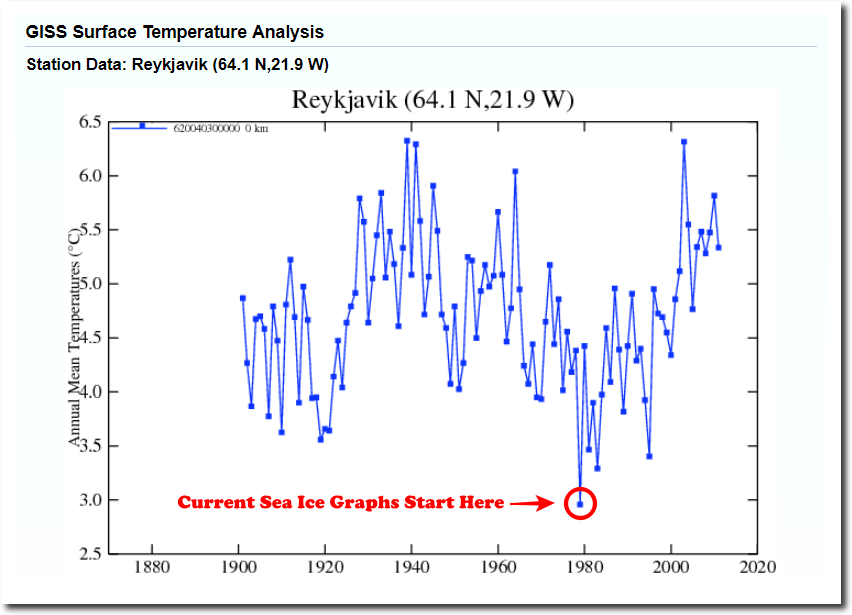
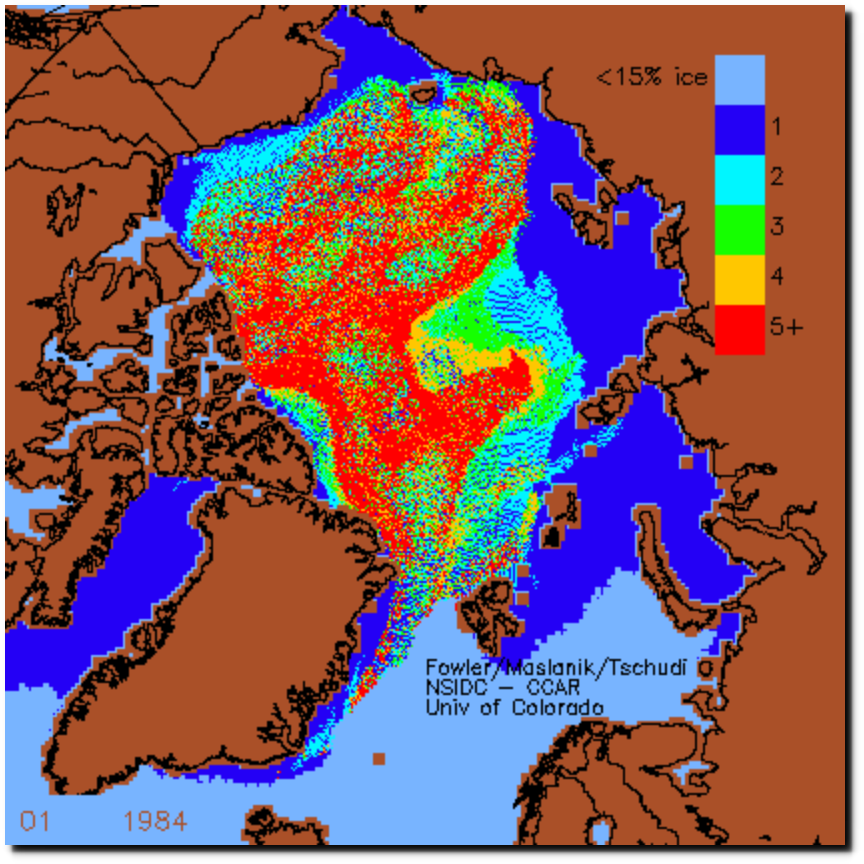
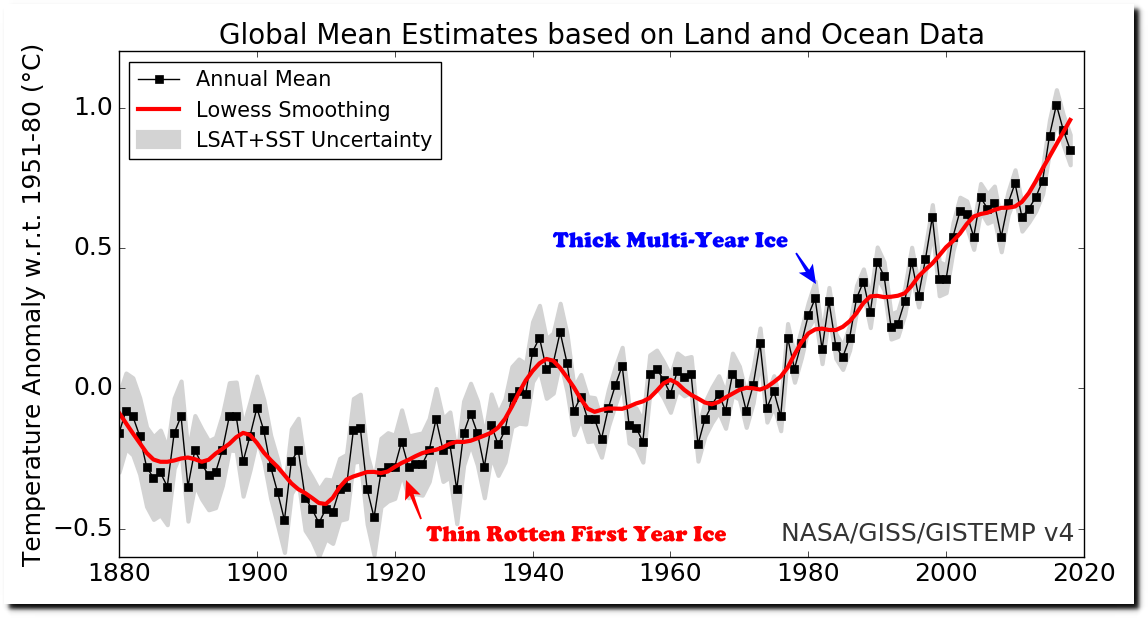
When I show the fraud going on with sea ice extent, climate alarmists invariably try to change the subject to ice age and thickness, pointing out that sea ice was thick and old in the late 1970s and early 1980s.
But in 1922, the ice between Alaska and the North Pole was thin, rotten first year ice.
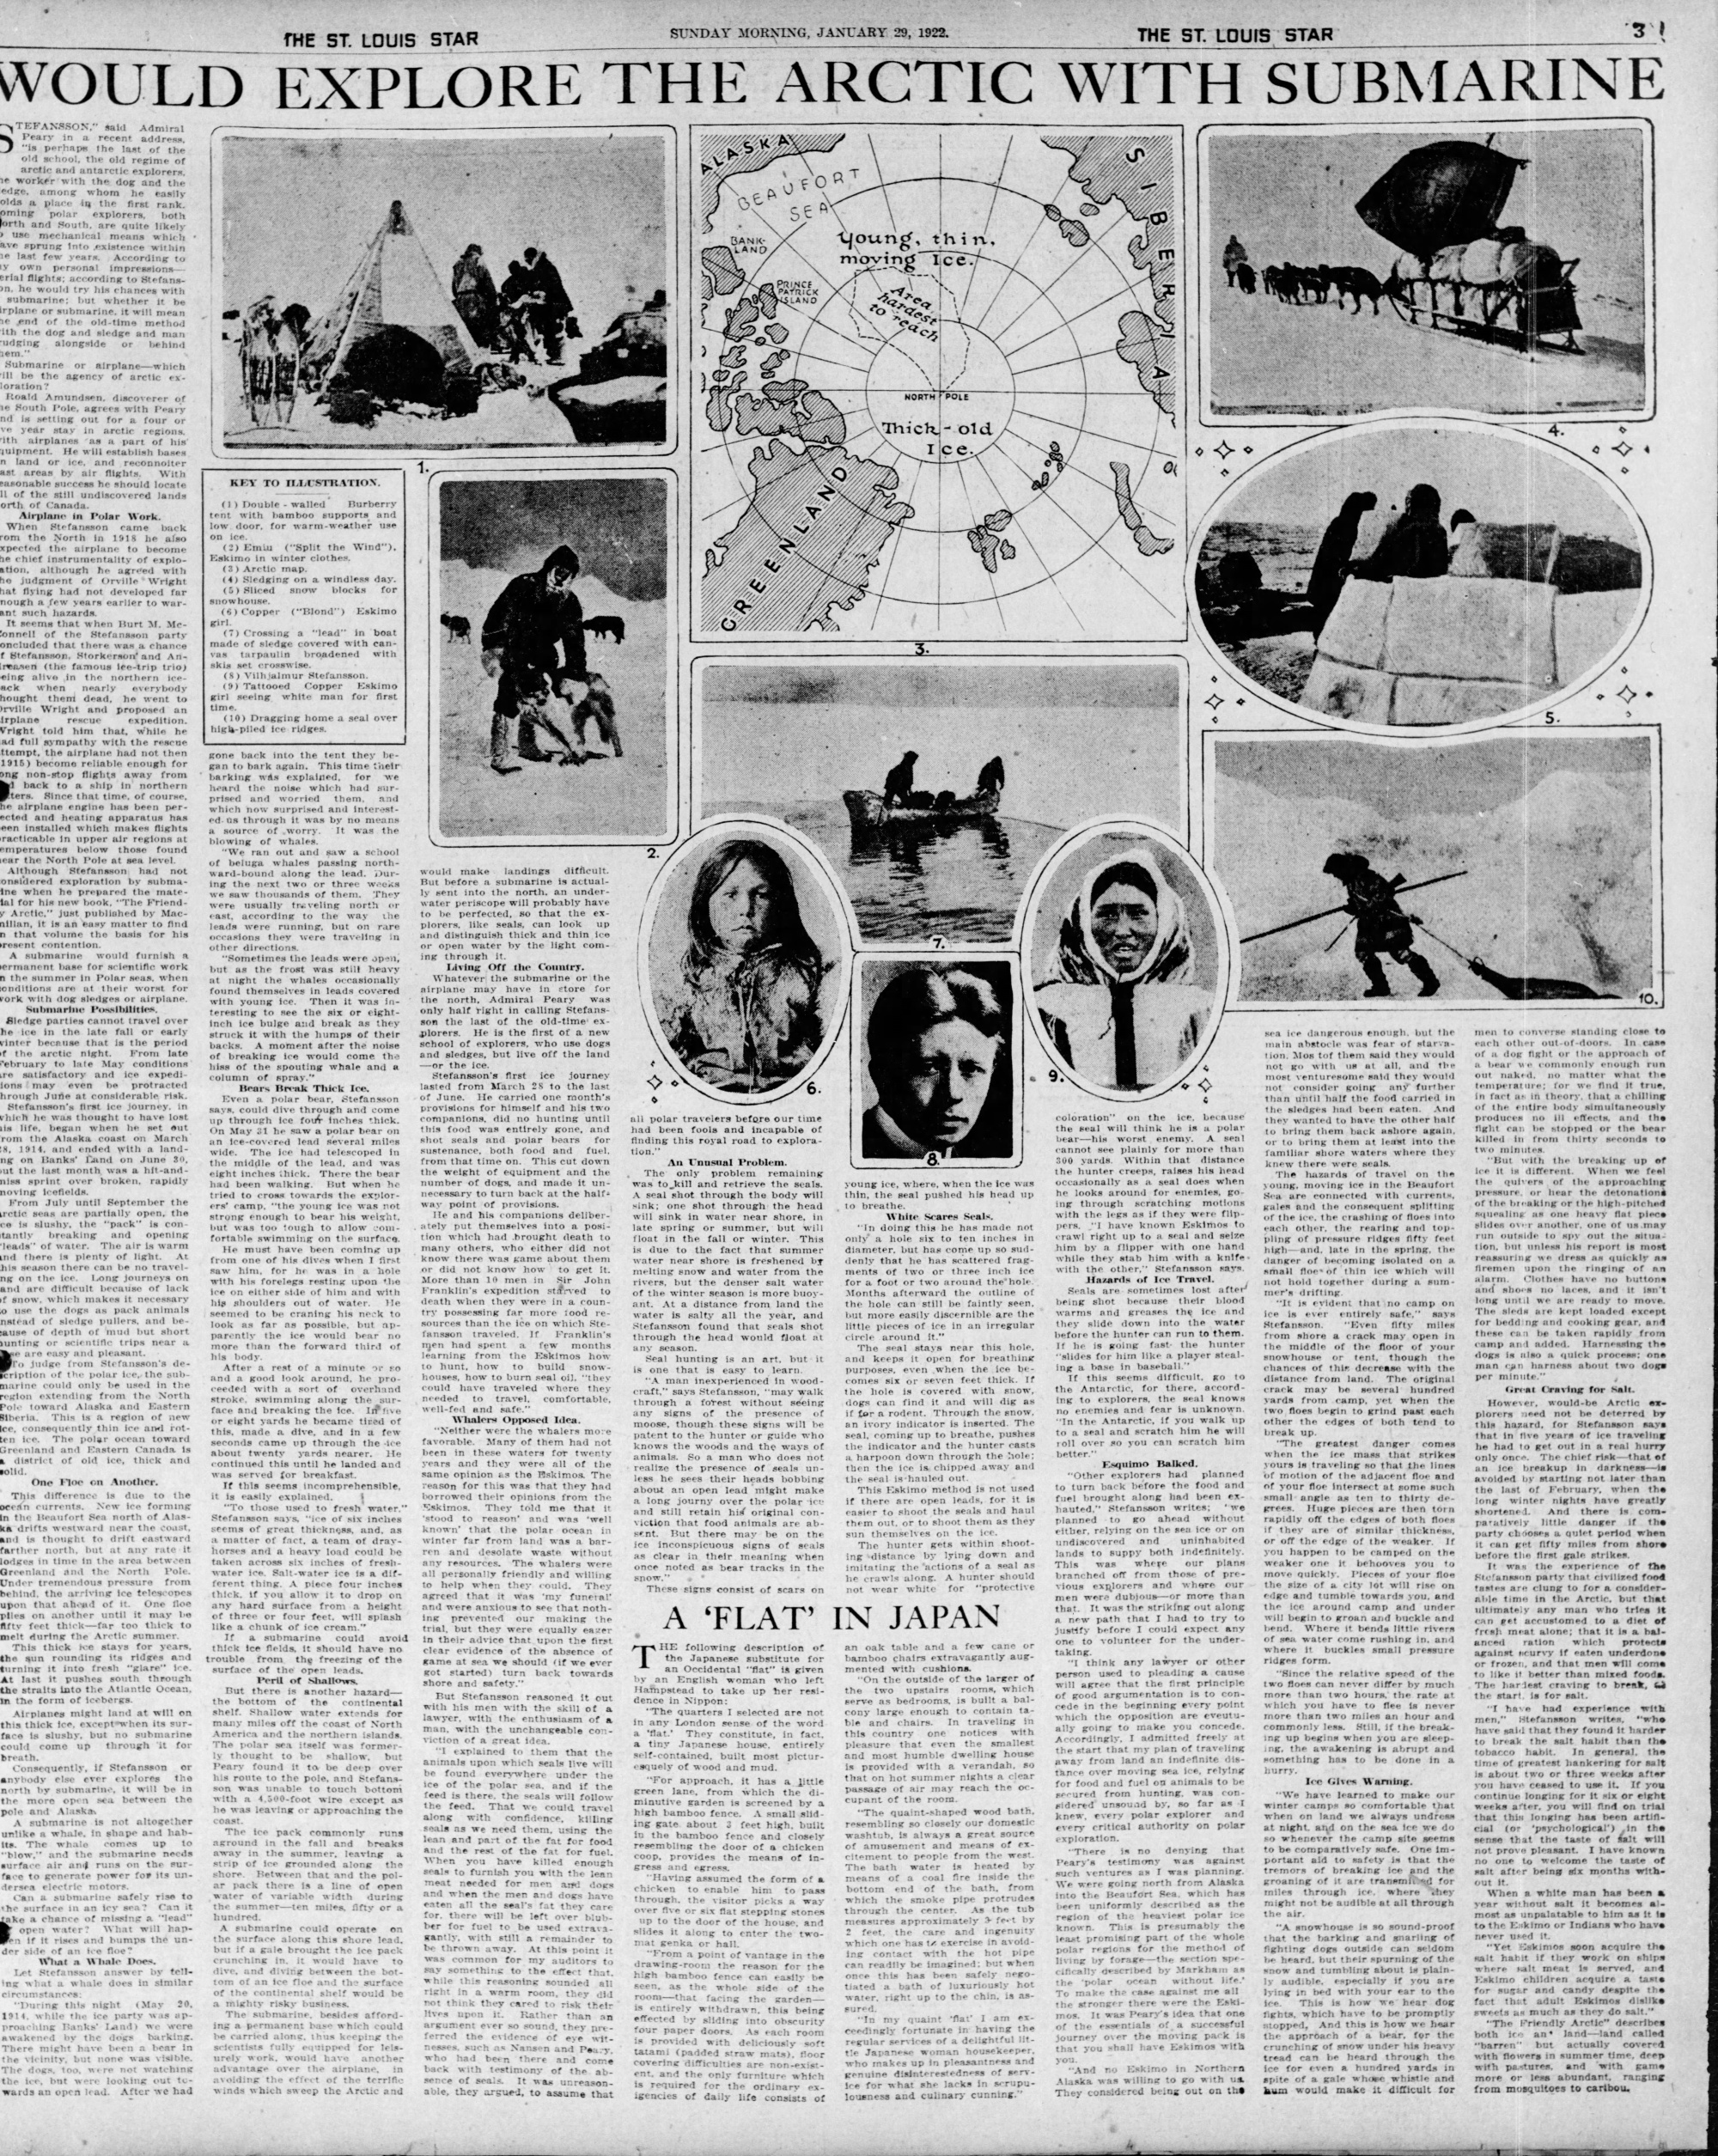
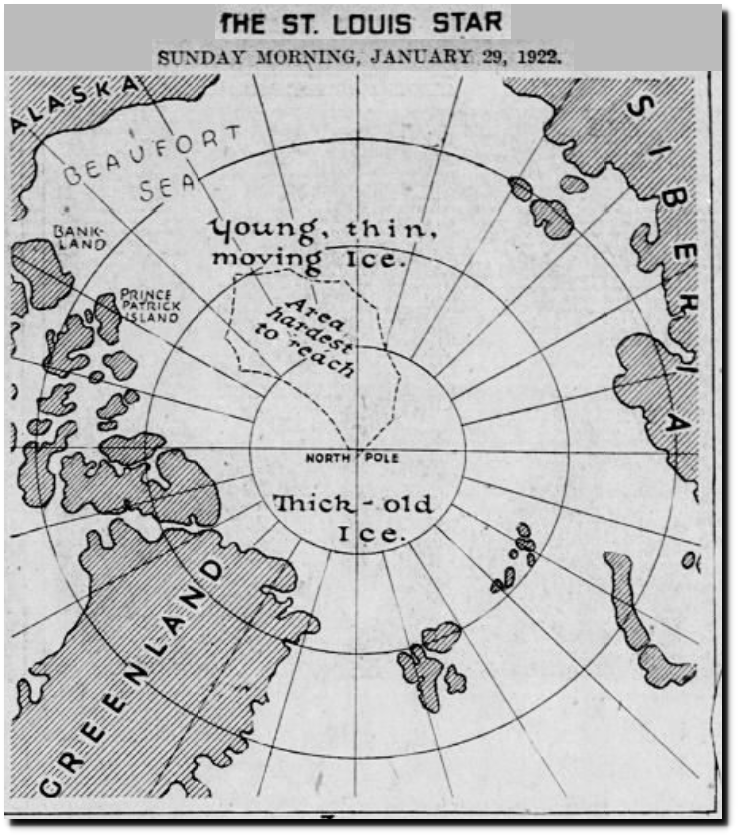
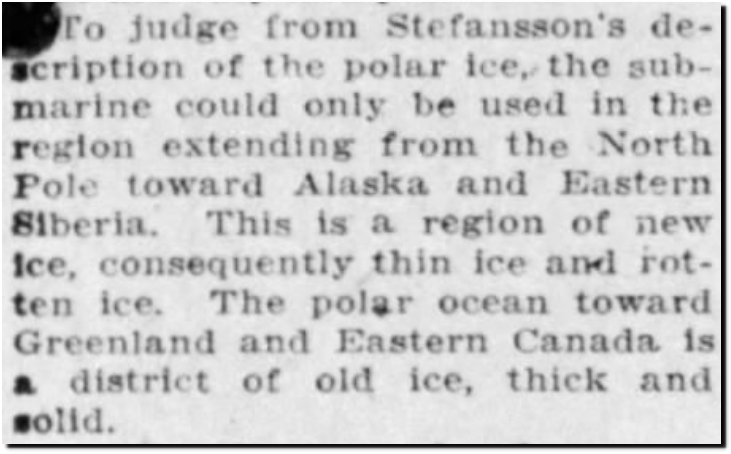
29 Jan 1922, Page 35 – The St. Louis Star and Times at Newspapers.com
The Arctic was rapidly melting, and there was no ice around Svalbard.
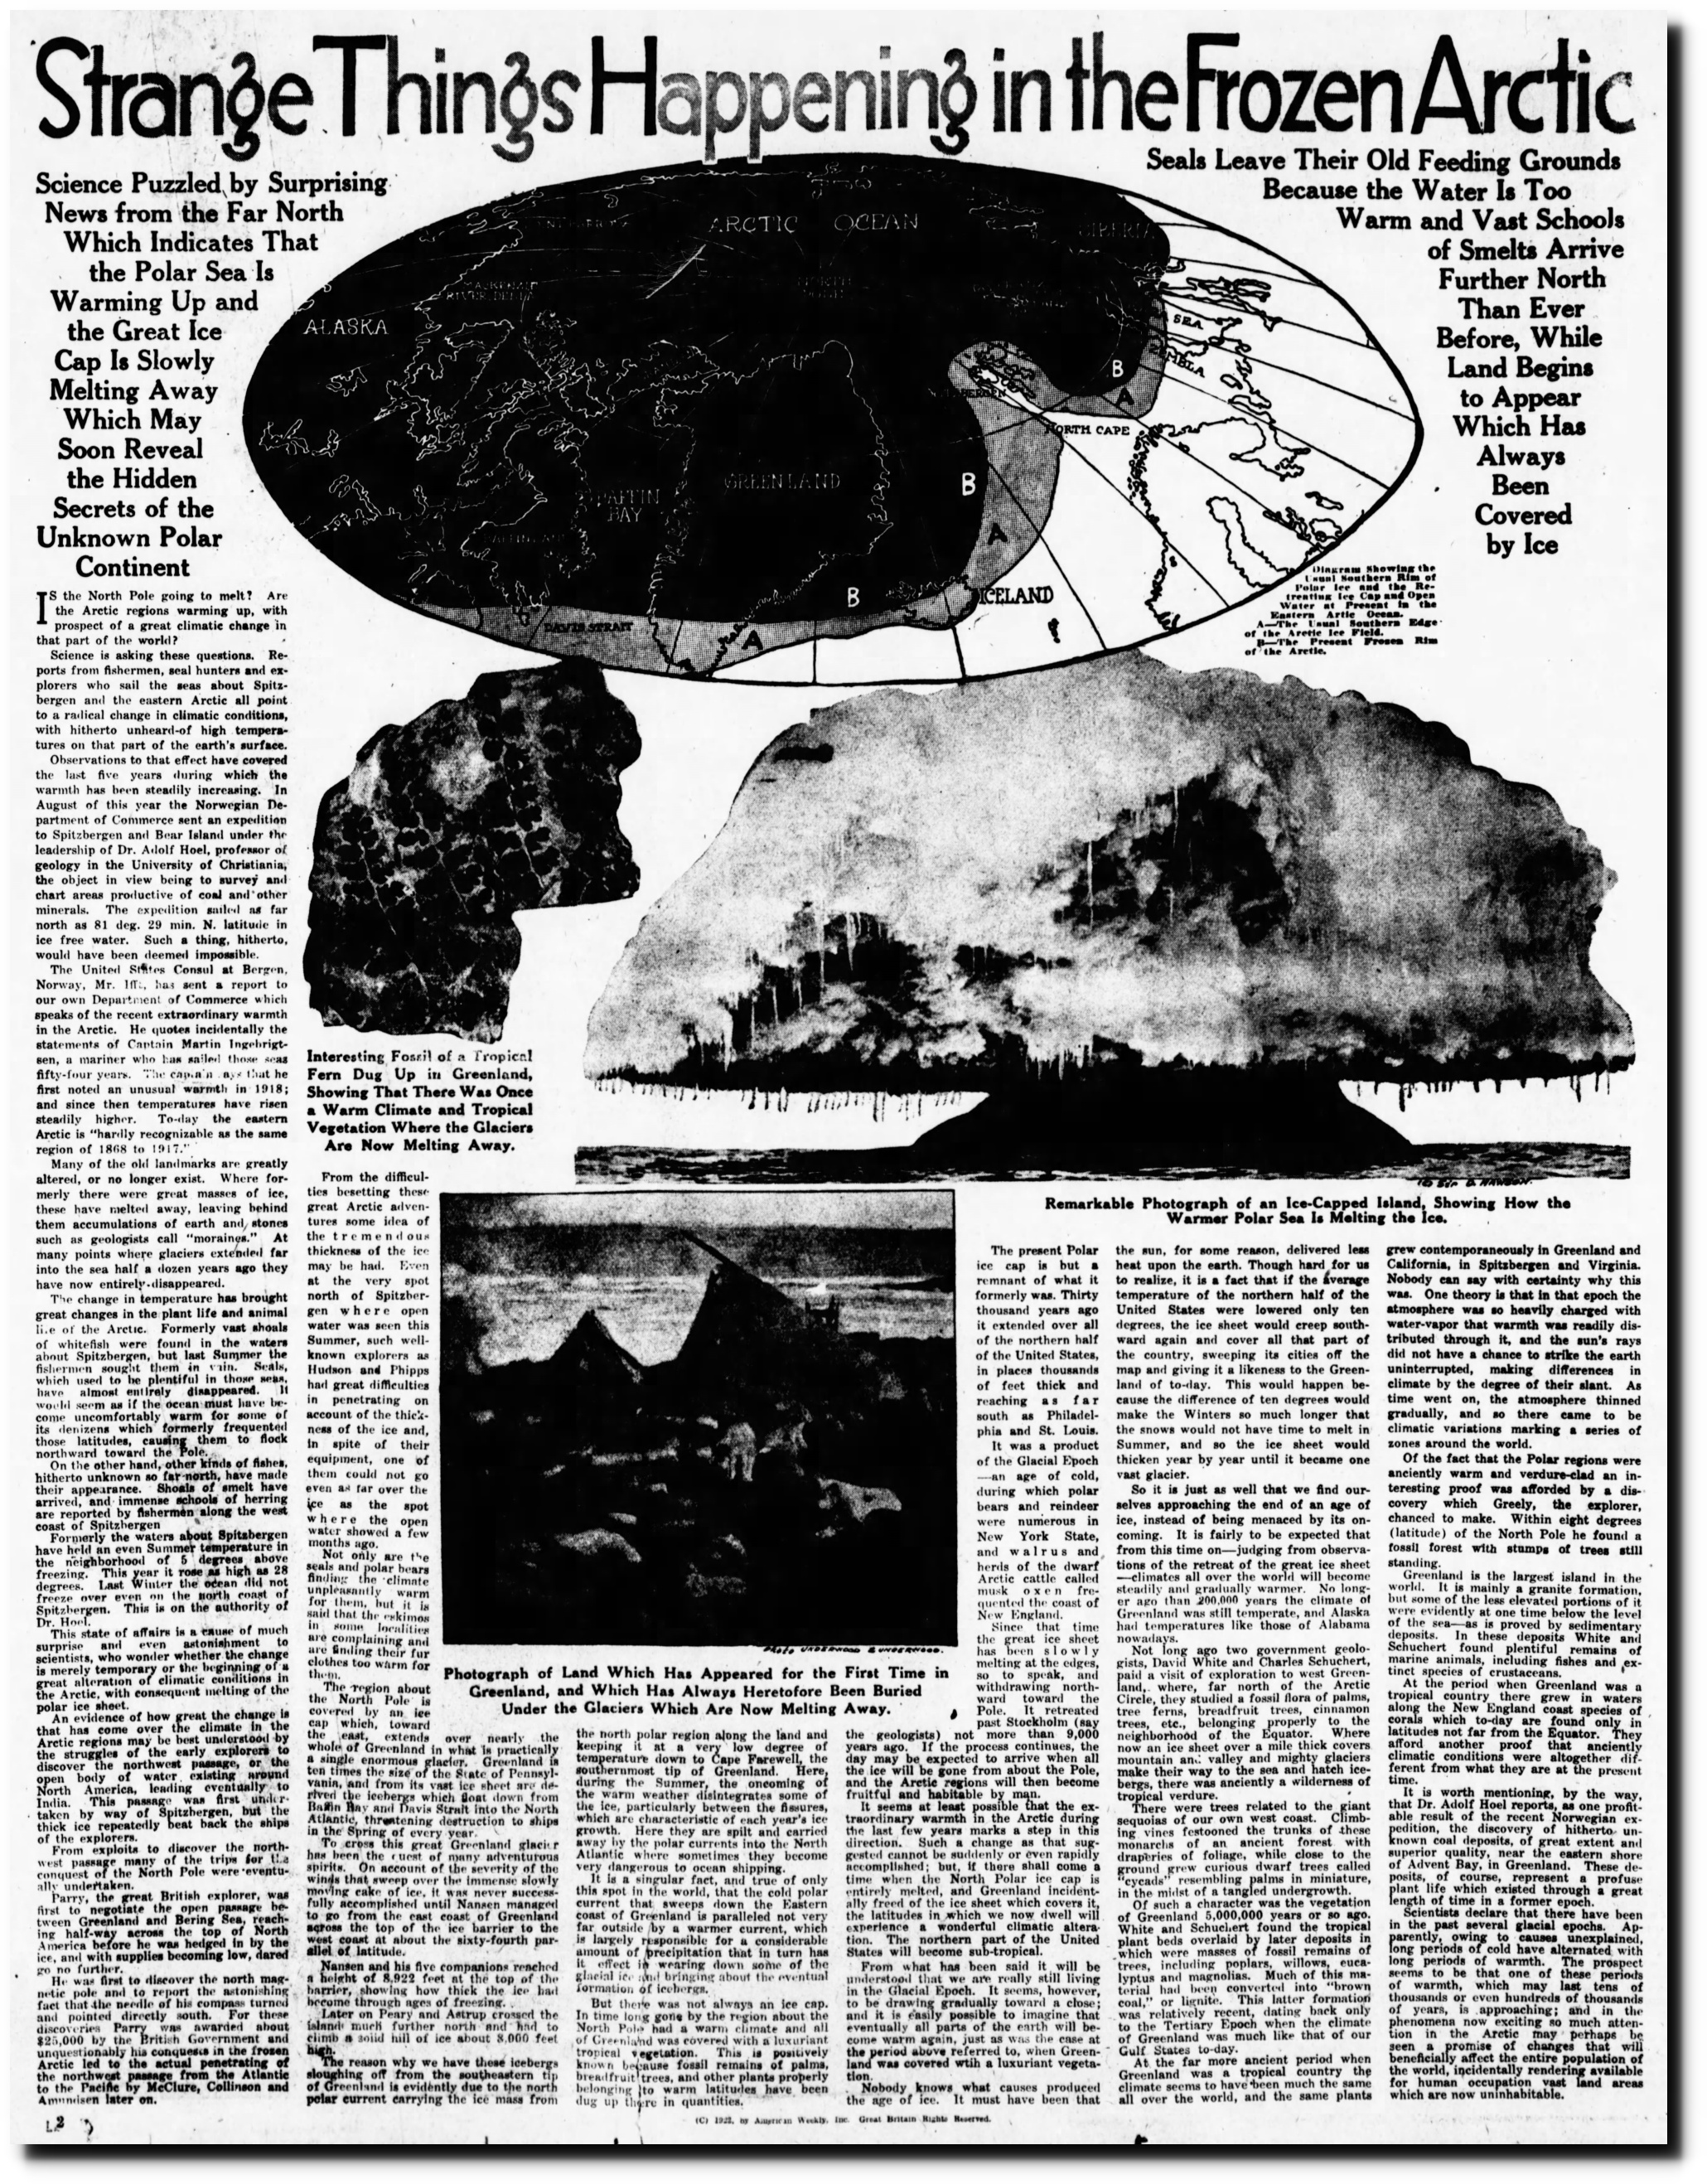
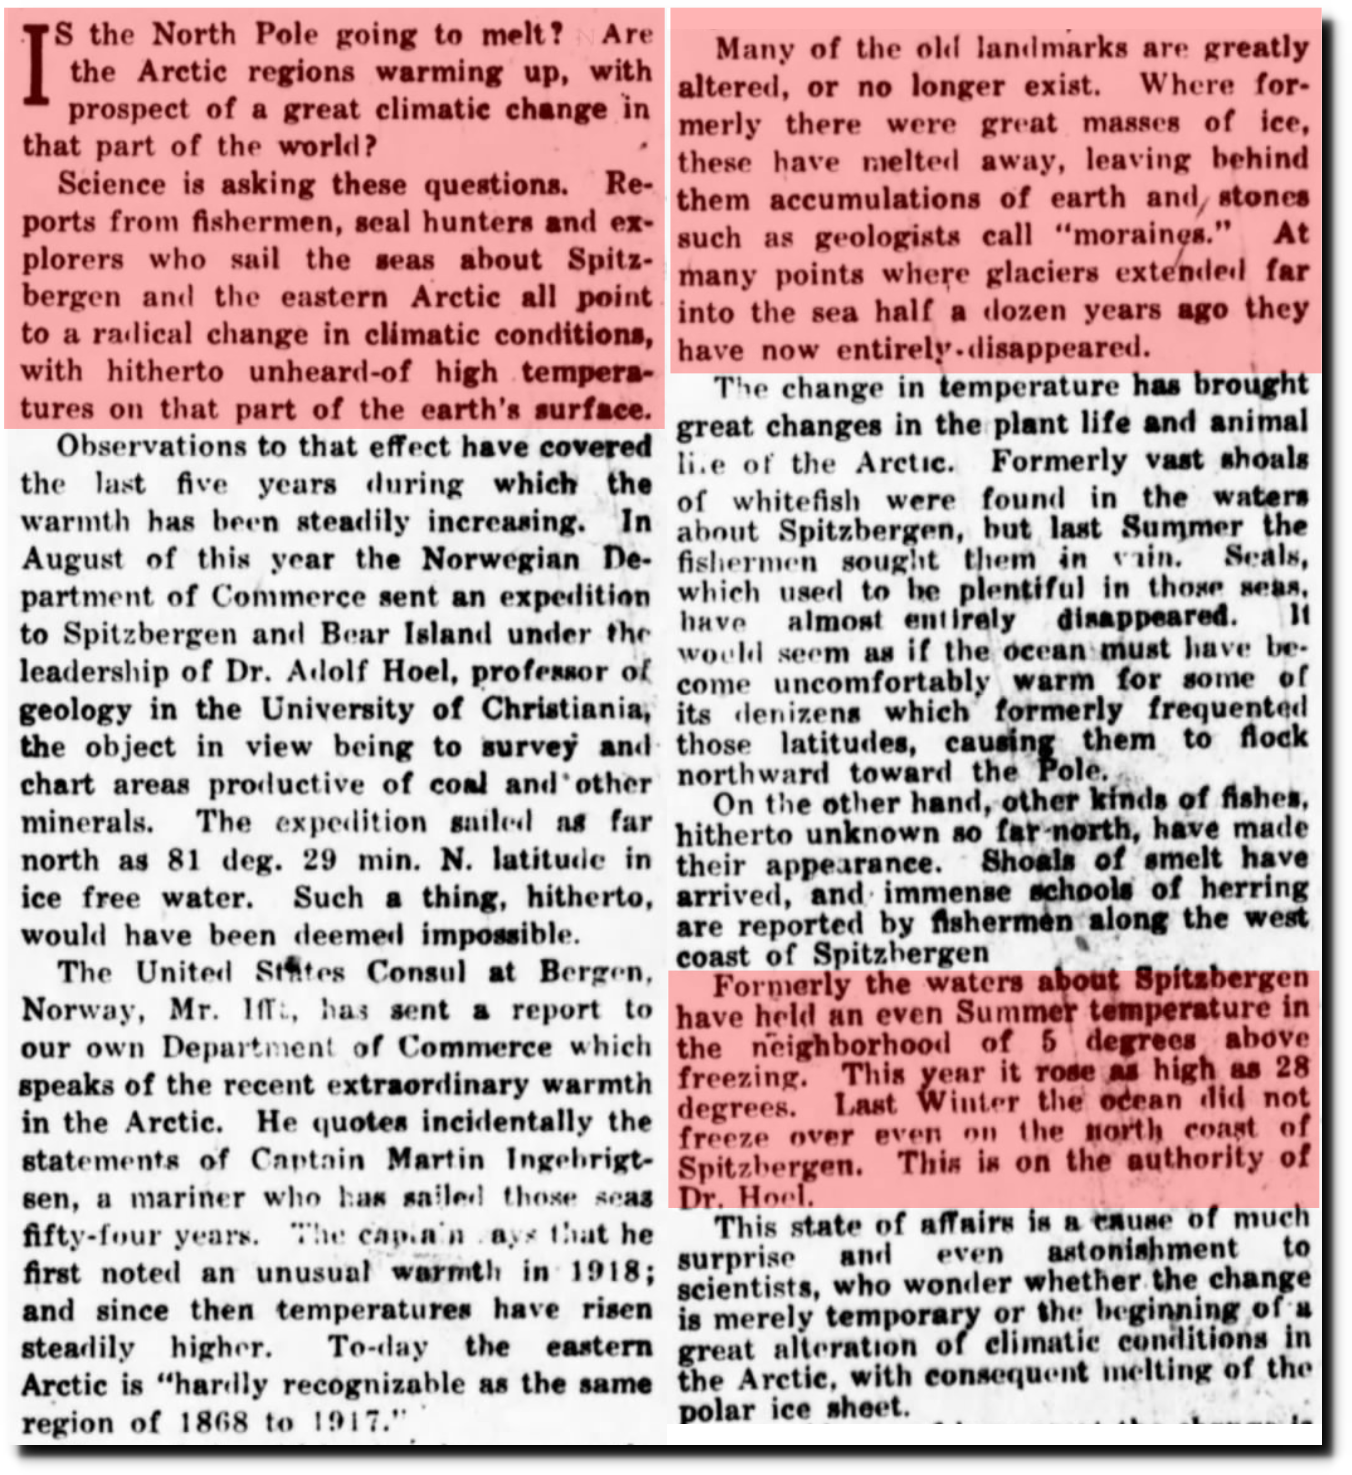
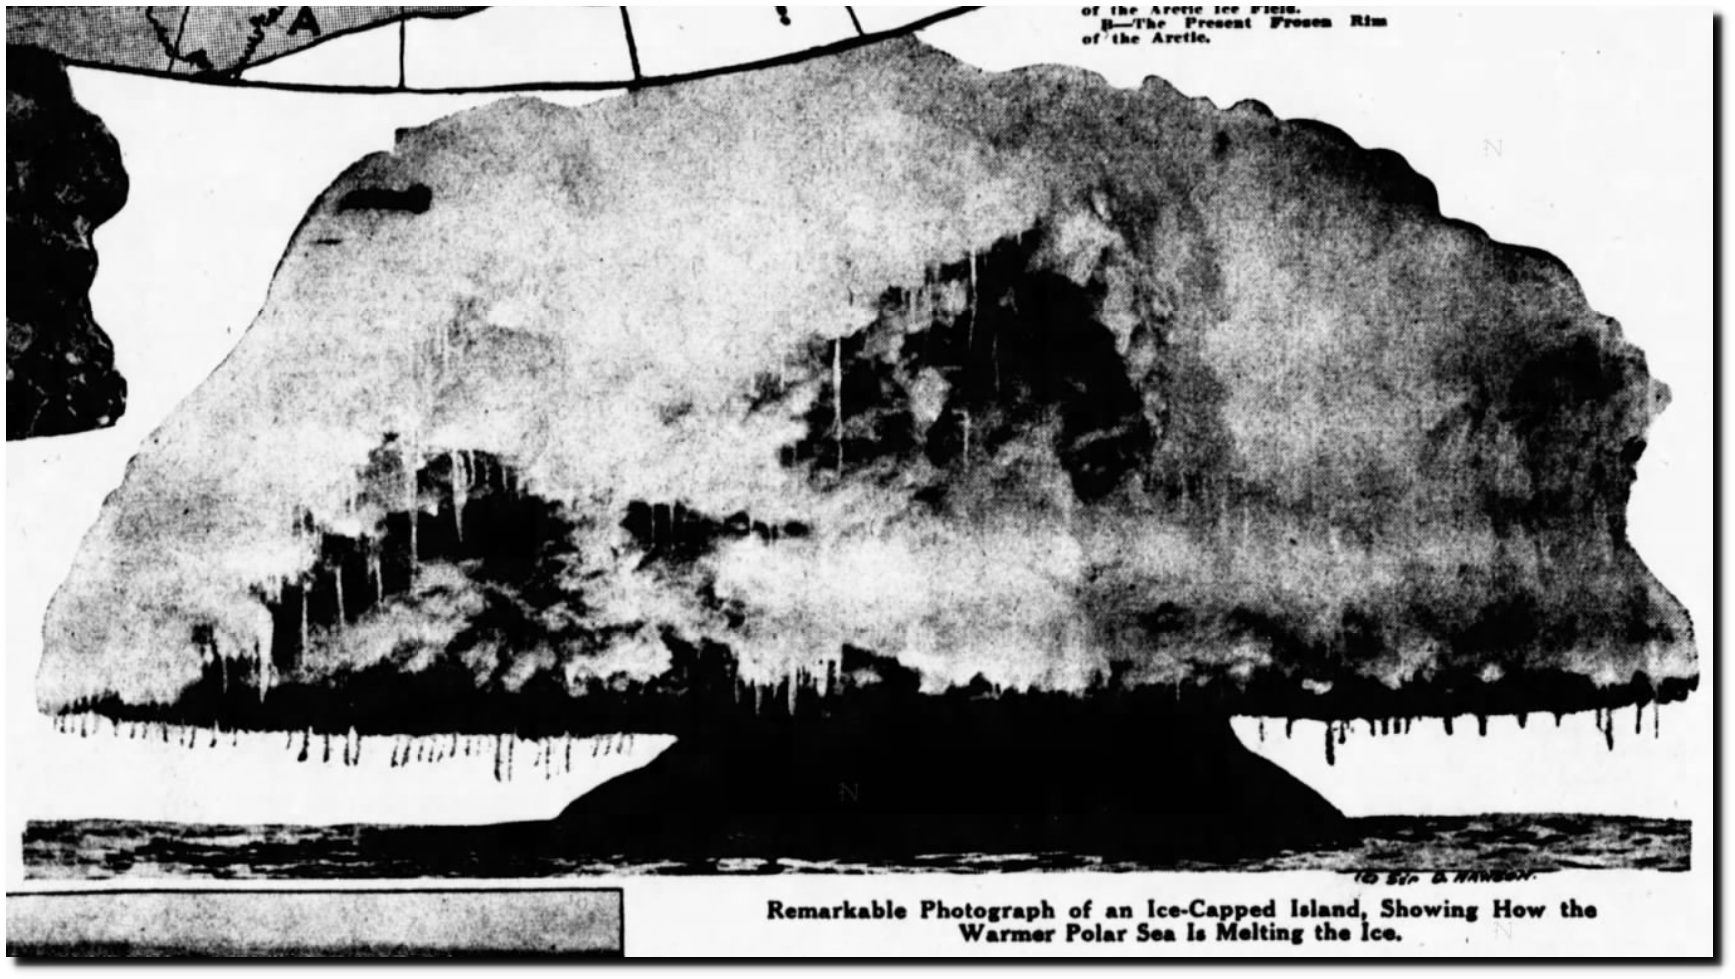
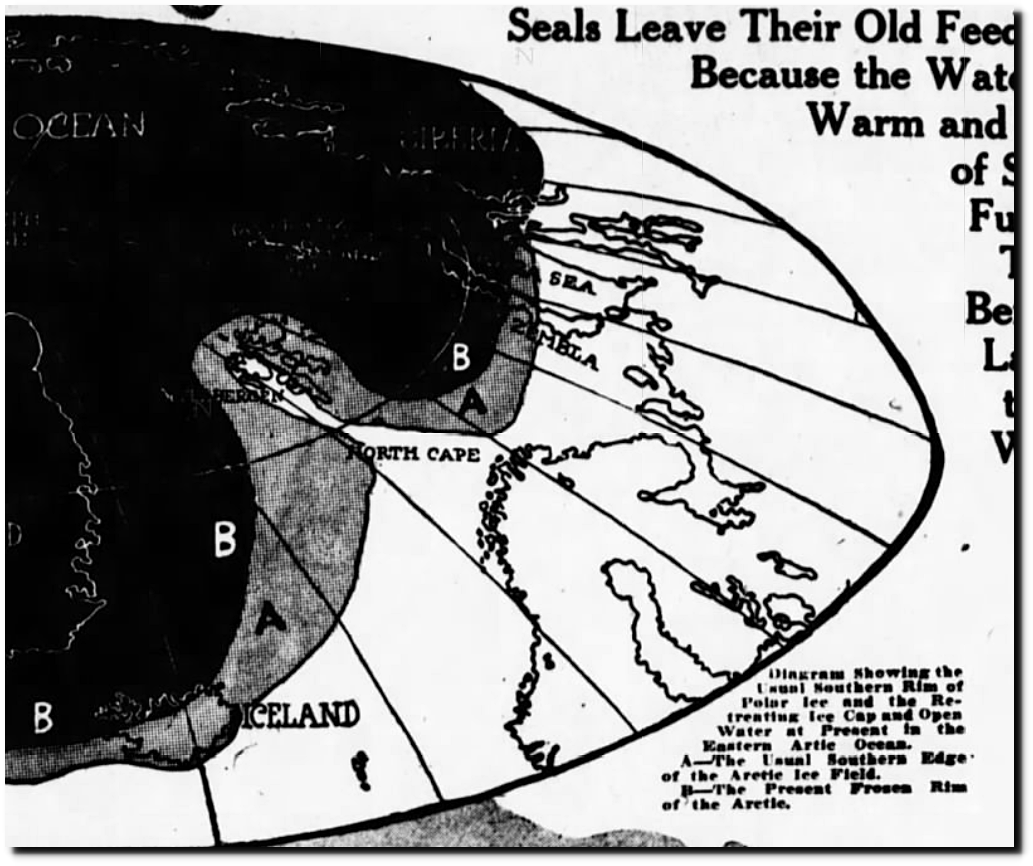
03 Dec 1922, Page 63 – The Washington Times at Newspapers.com
Now there is lots of ice around Svalbard.
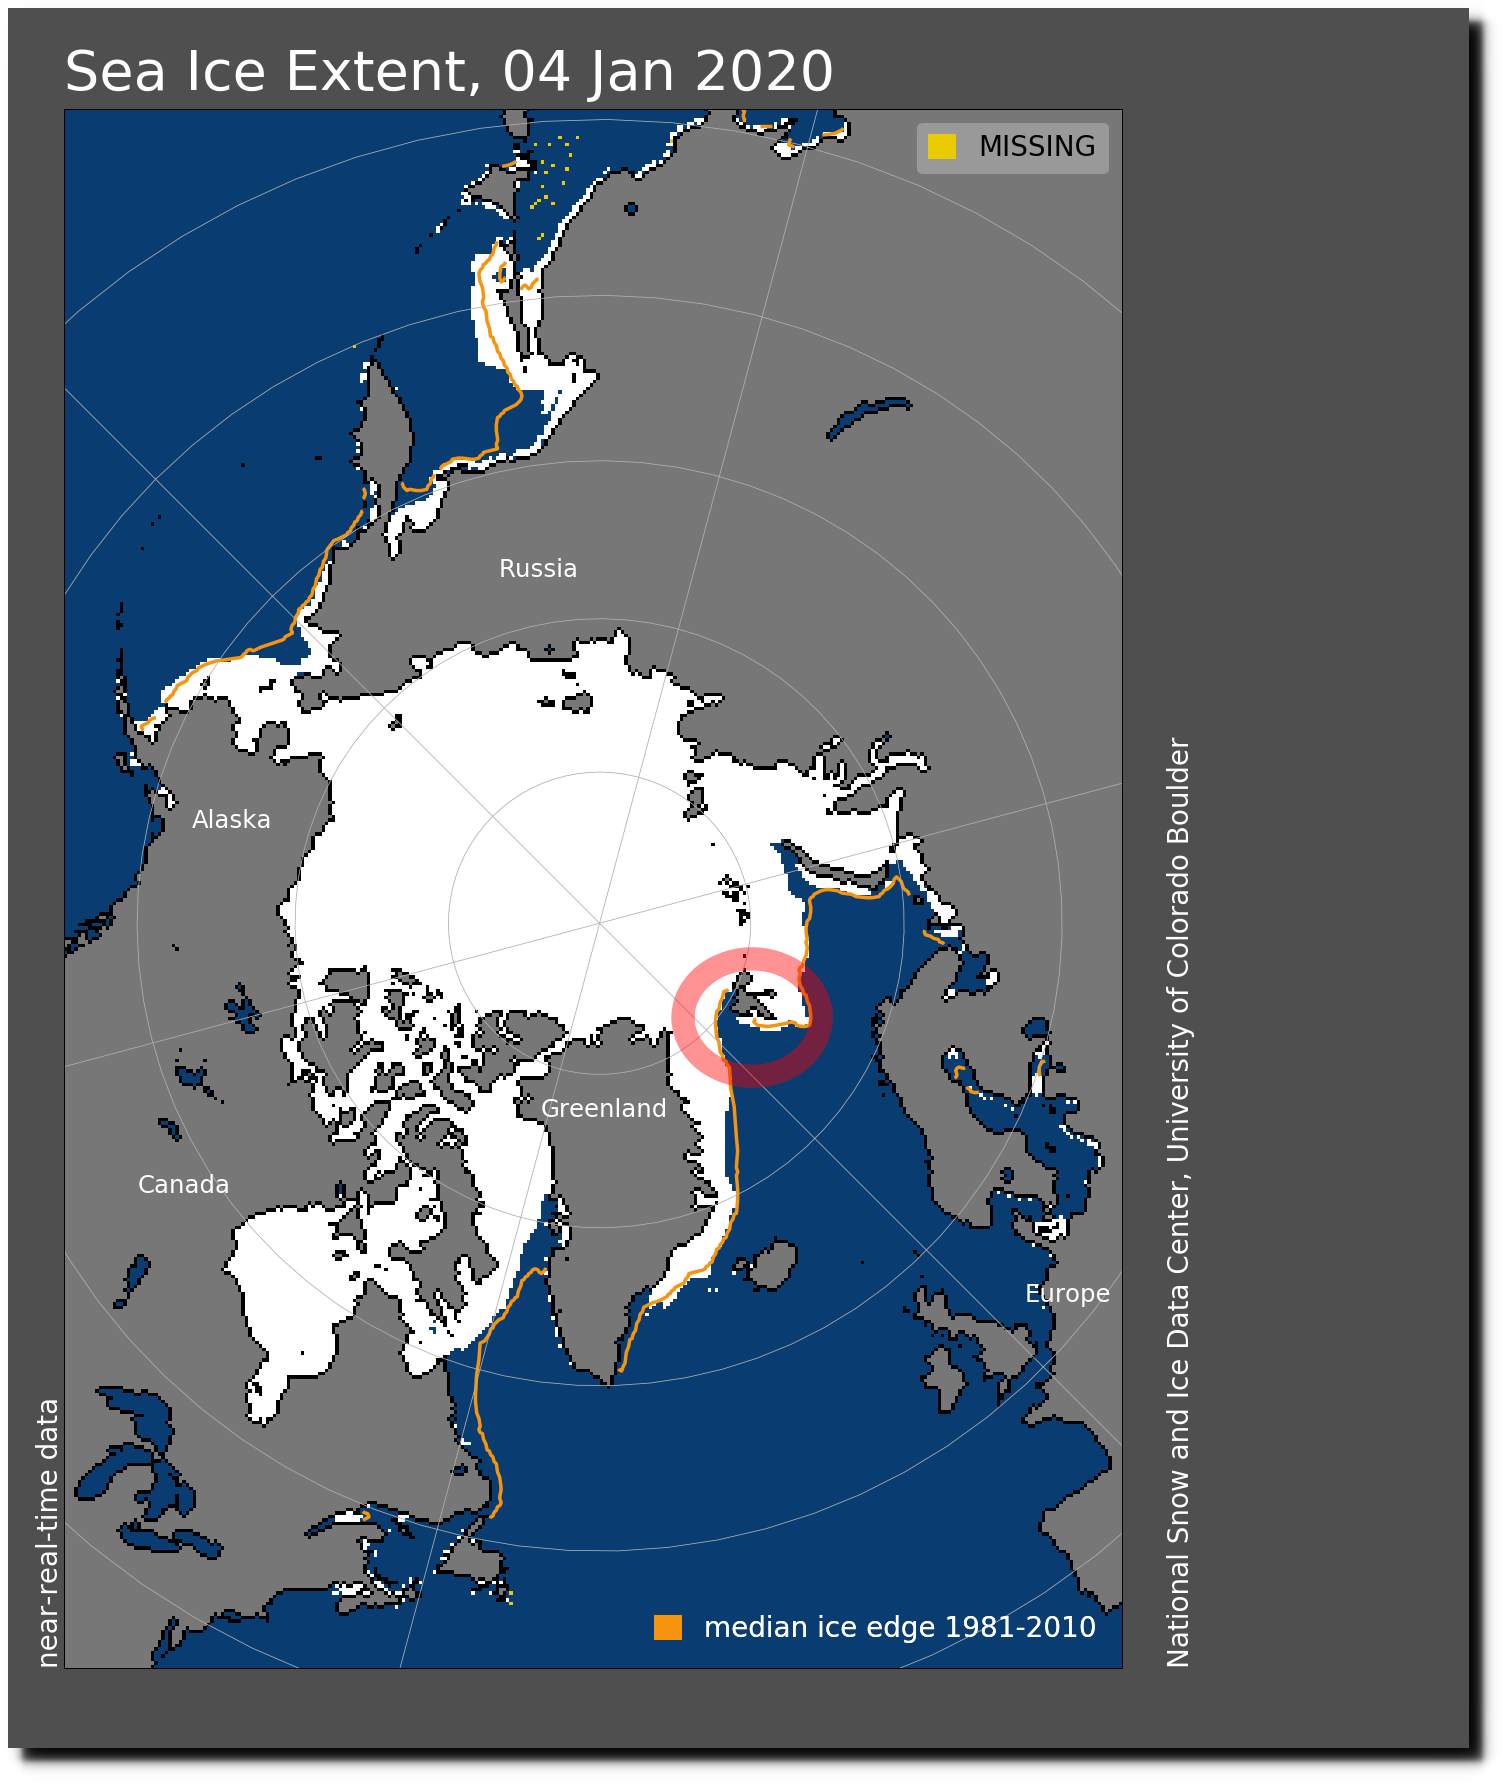
NOAA/G02135/north/daily/images/2020/01_Jan/N_20200104_extn_hires_v3.0.png
Raw data shows that the eastern Arctic was very warm 80 years ago,
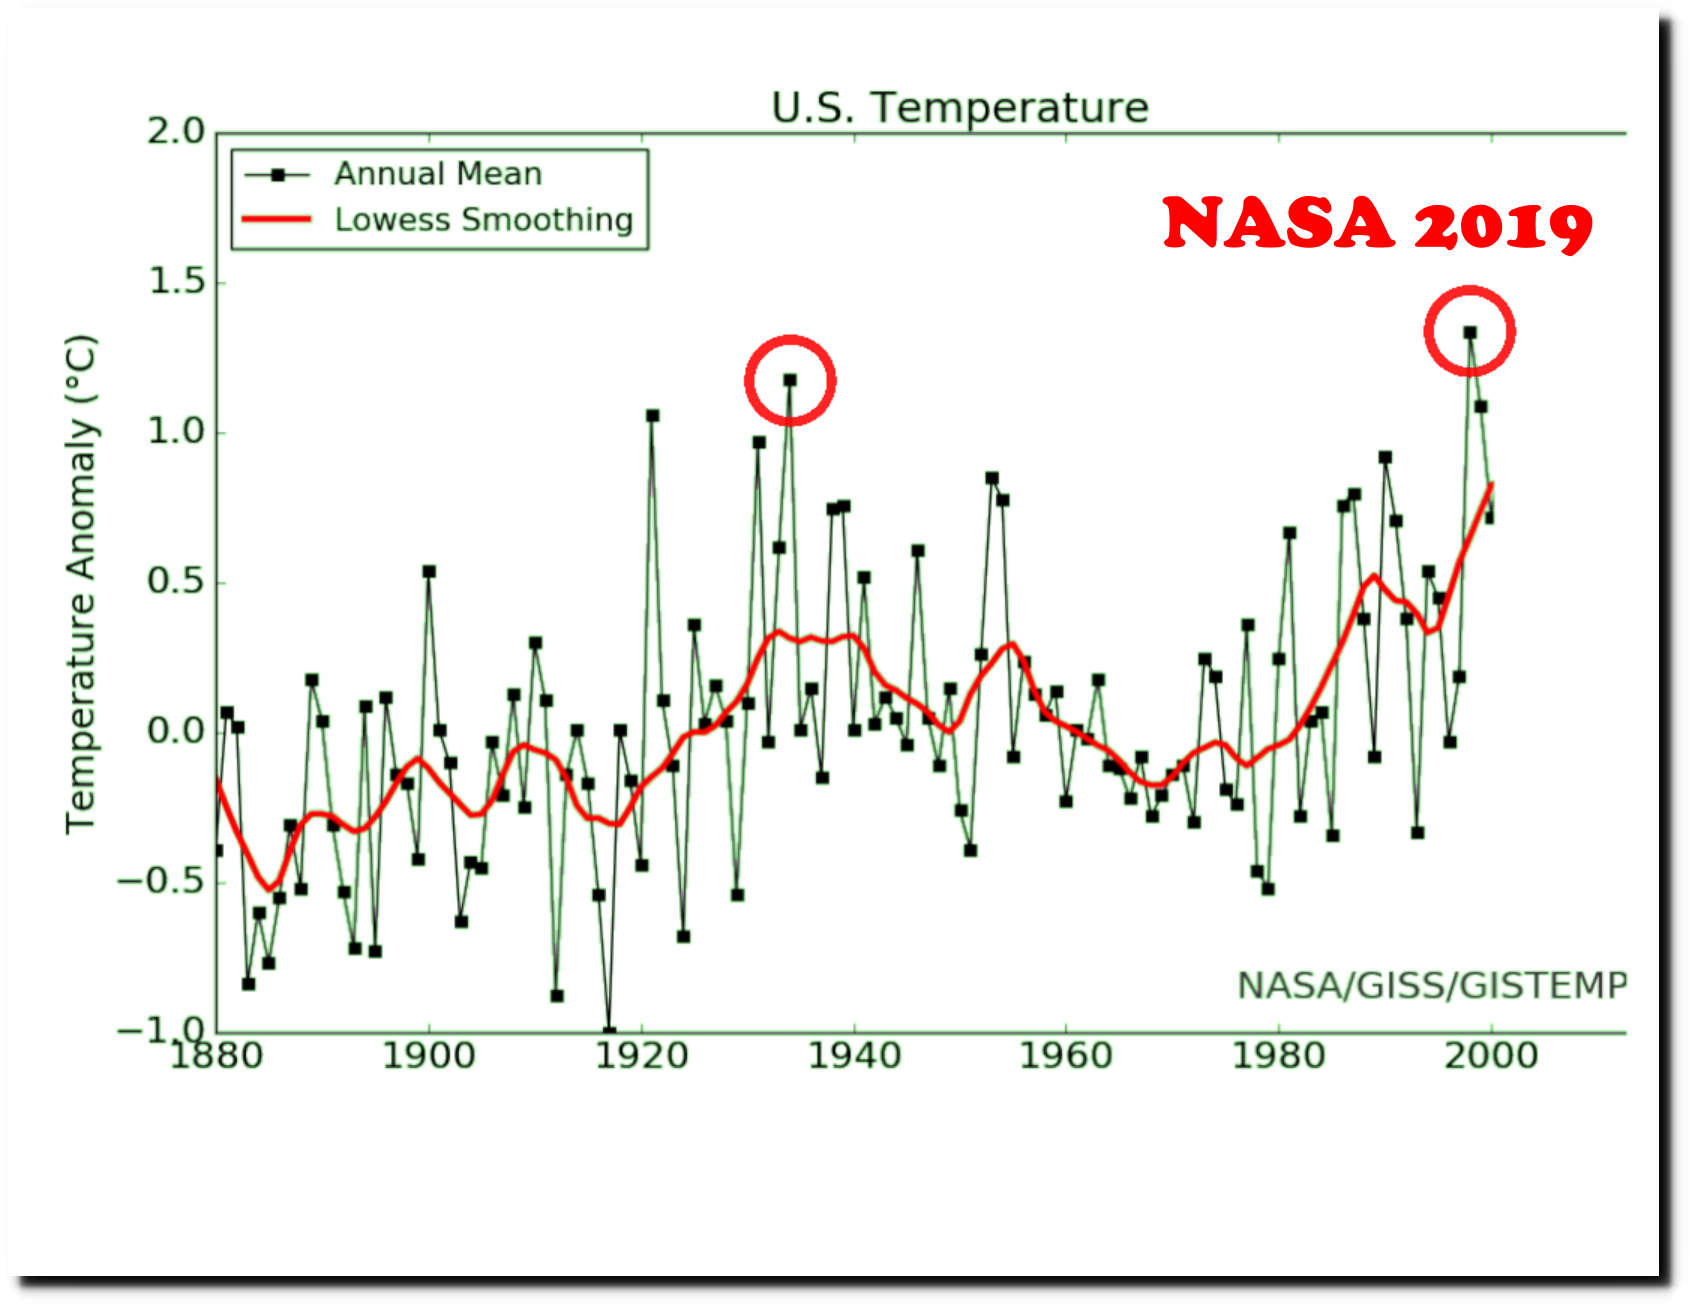
But NASA is constantly tampering with the data, and frequently makes the warmth of the 1940s disappear.
May 2018 Measured Vs. Adjusted
In Climategate emails, the world’s leading climate scientists openly discussed their desire to ease the warmth of the 1940s.
The “thin, rotten ice” of 1921 was preceded by very warm weather in 1921.
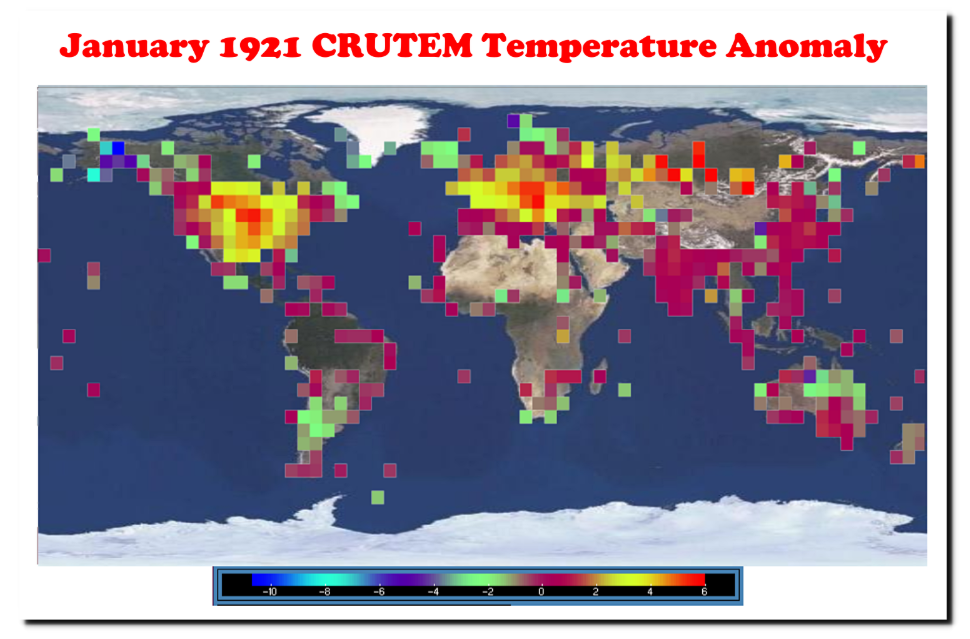
This animation shows CRUTem anomalies for all of 1921.
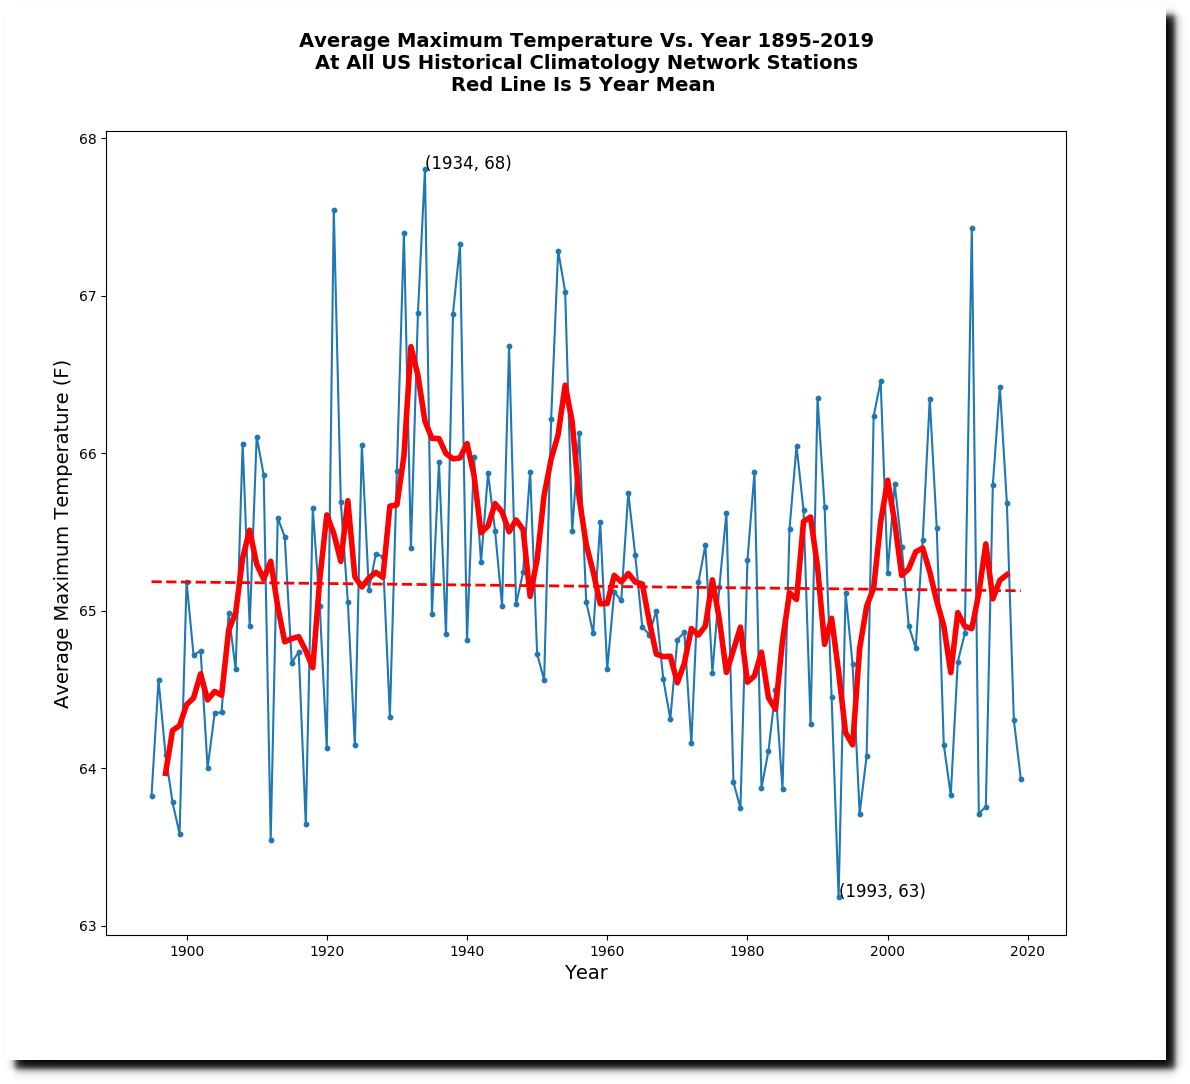
In the US, 1921 was the second warmest year on record, after 1934.
The New York Times reported that Earth has a fever.
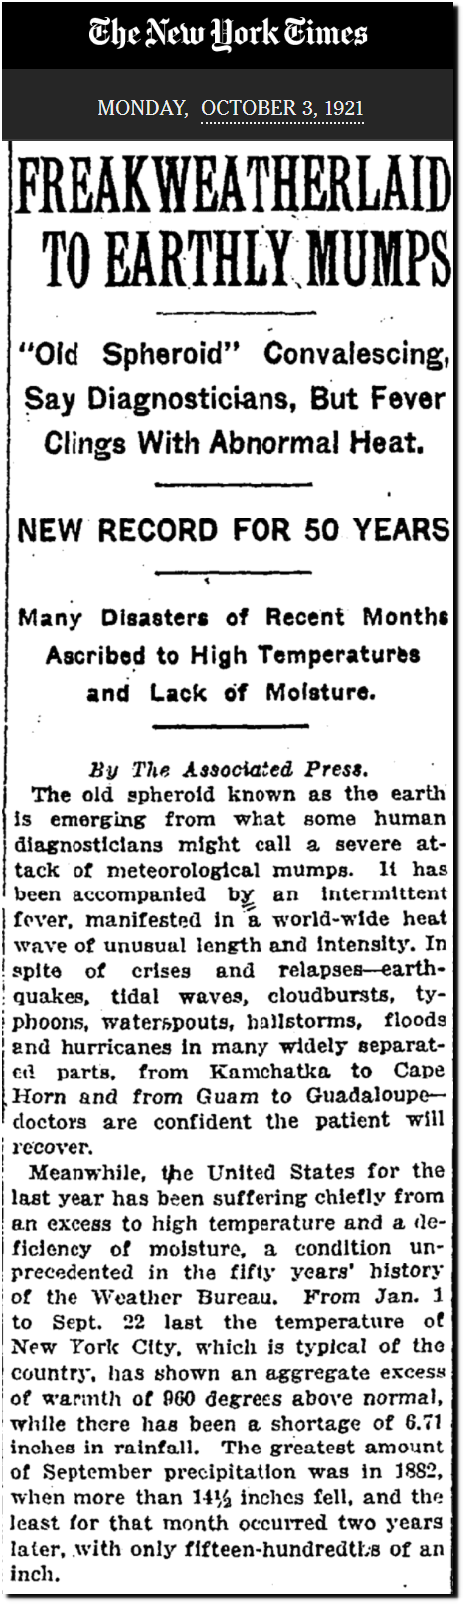
TimesMachine: October 3, 1921 – NYTimes.com
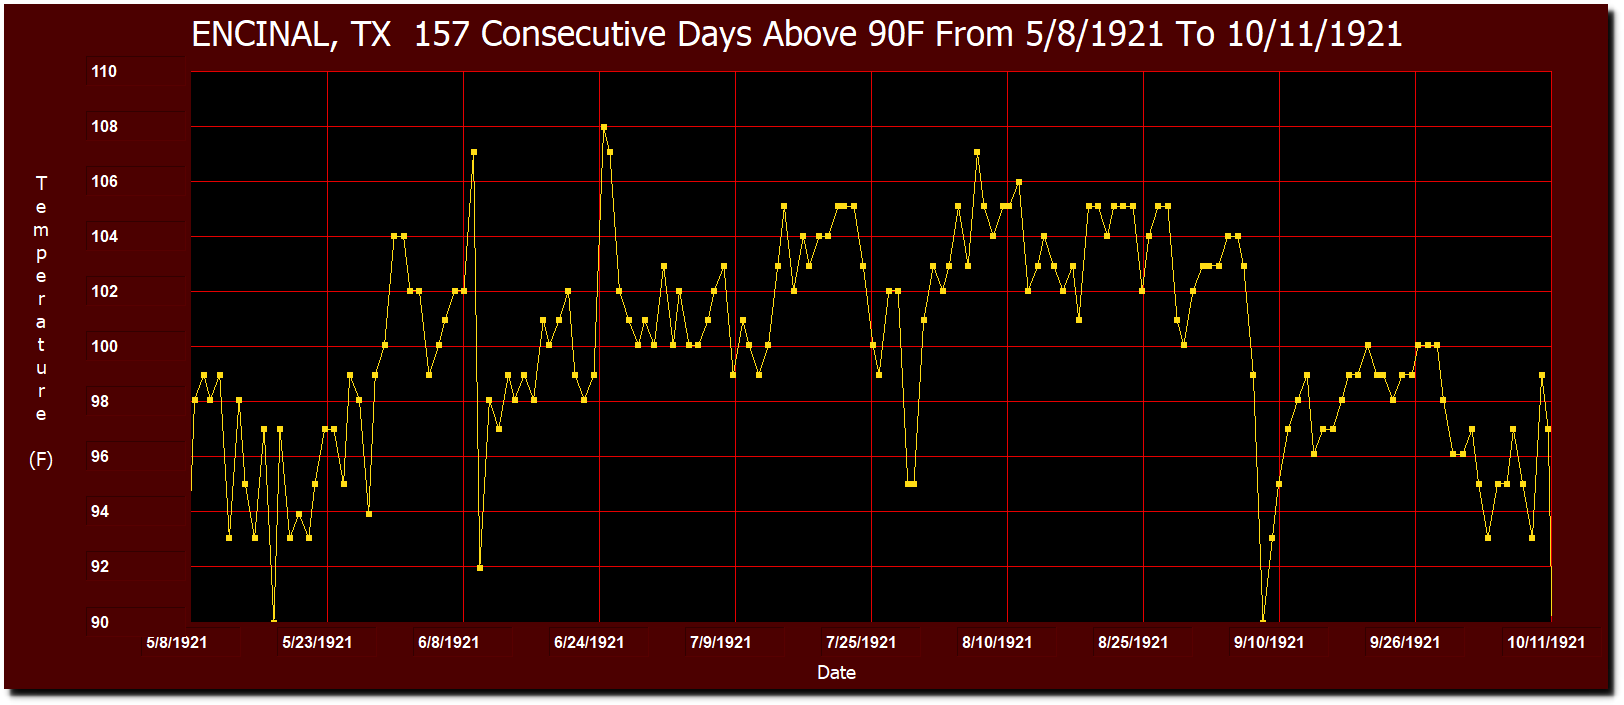
Encinal, Texas had 157 consecutive days above 90F in 1921, the Texas record.
The heat of 1921 and other hot years from the past is inconvenient for government agencies, so they alter the data to make it disappear.
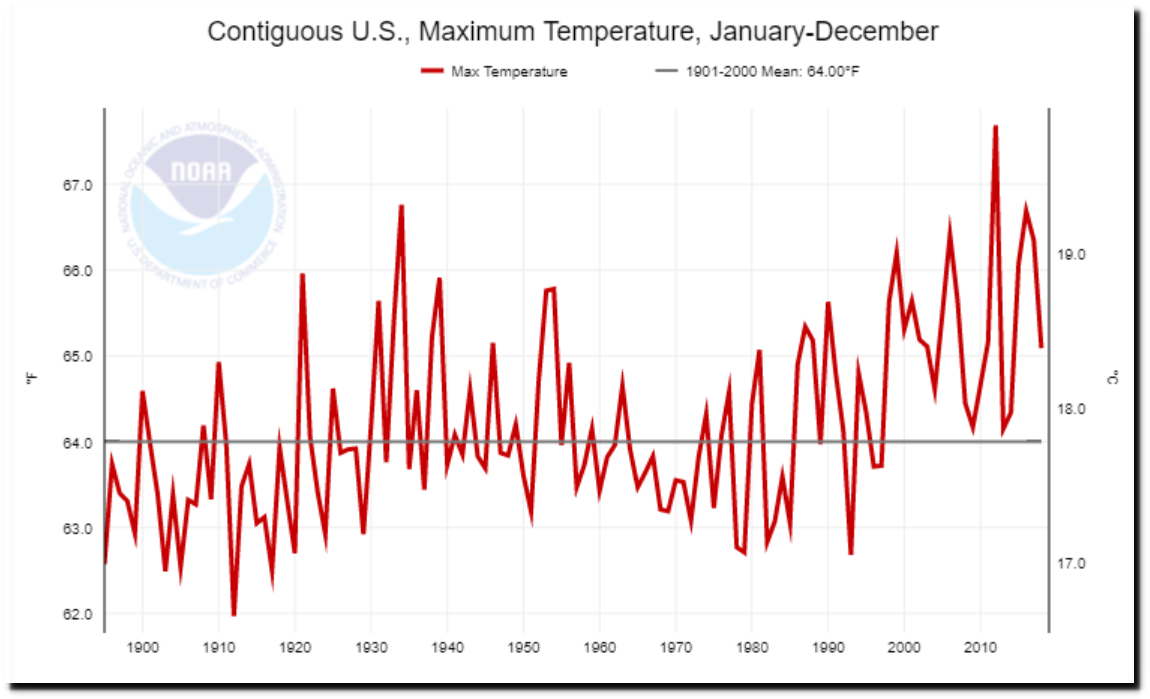
Climate at a Glance | National Centers for Environmental Information (NCEI)
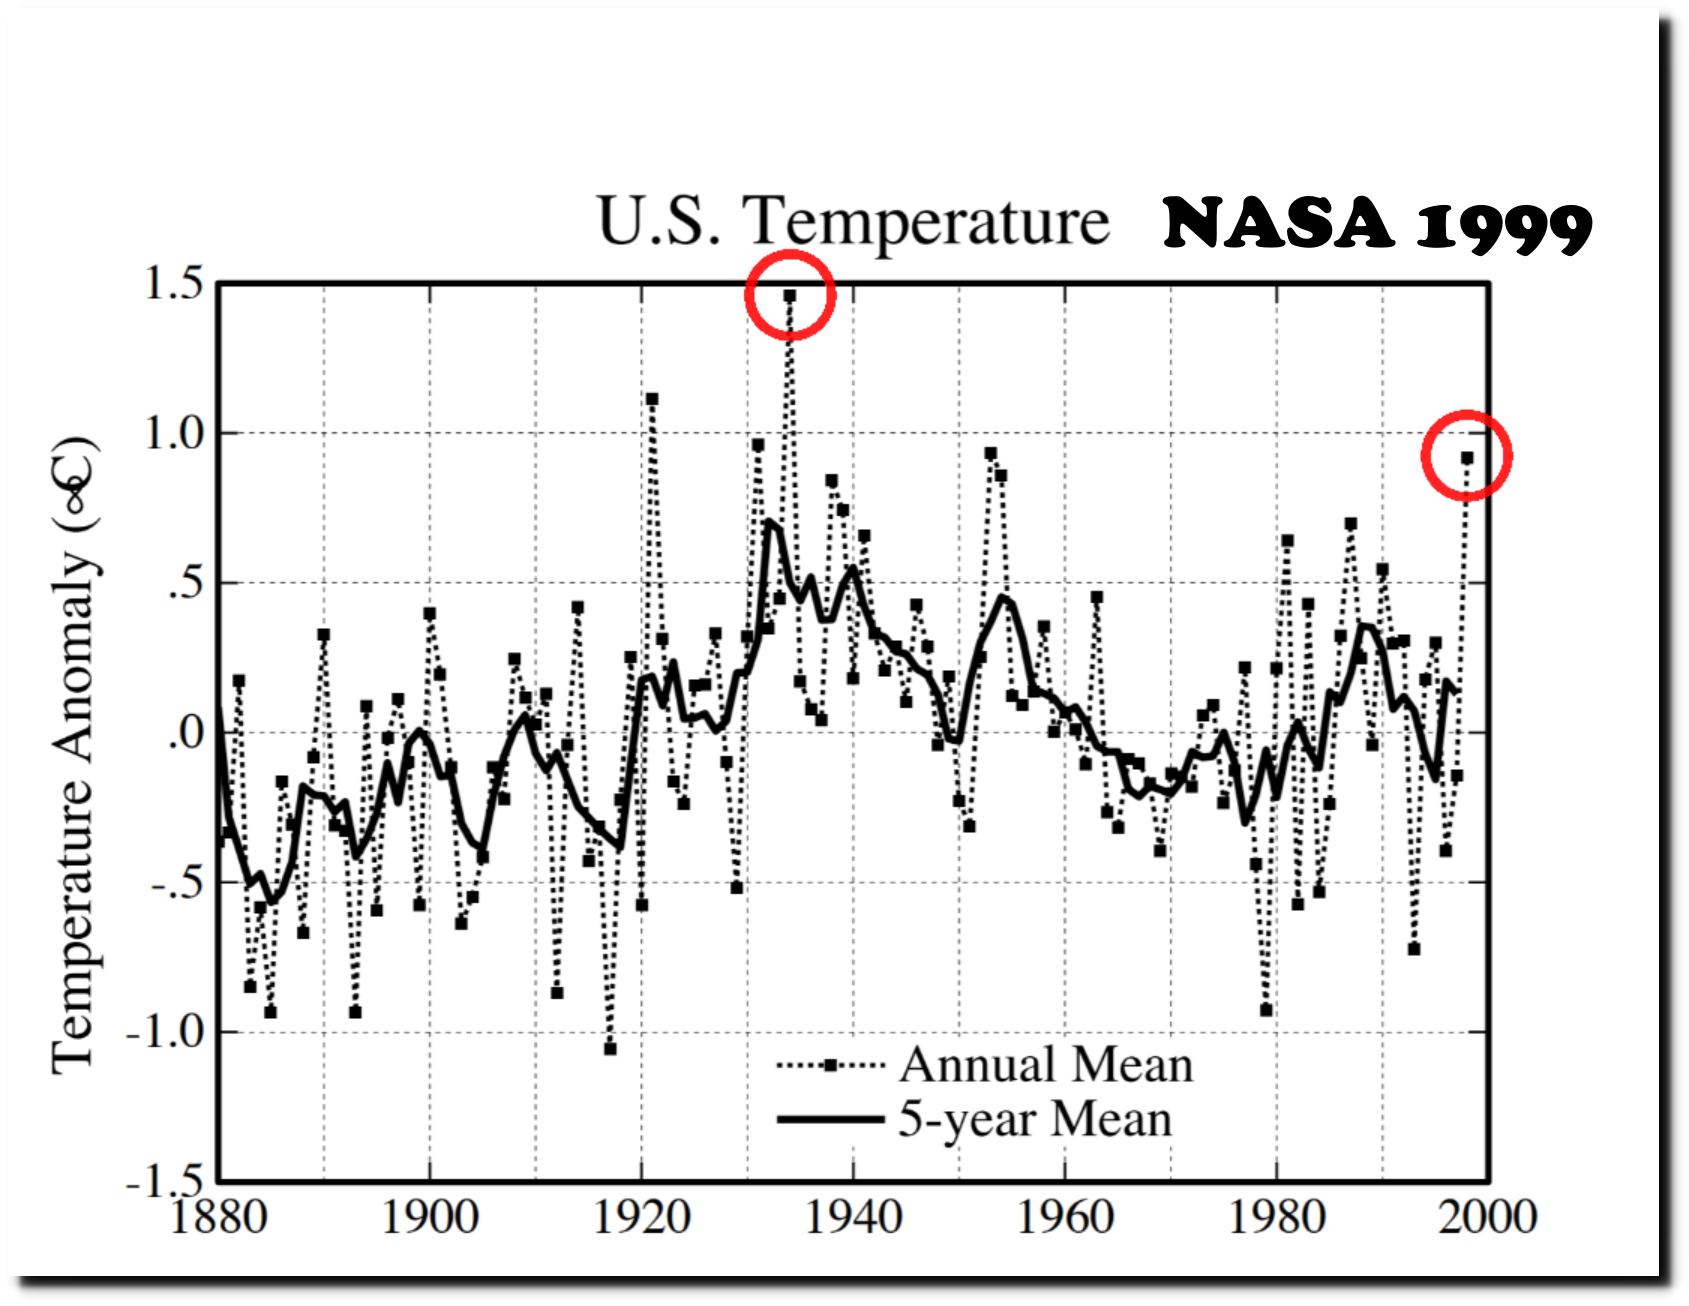
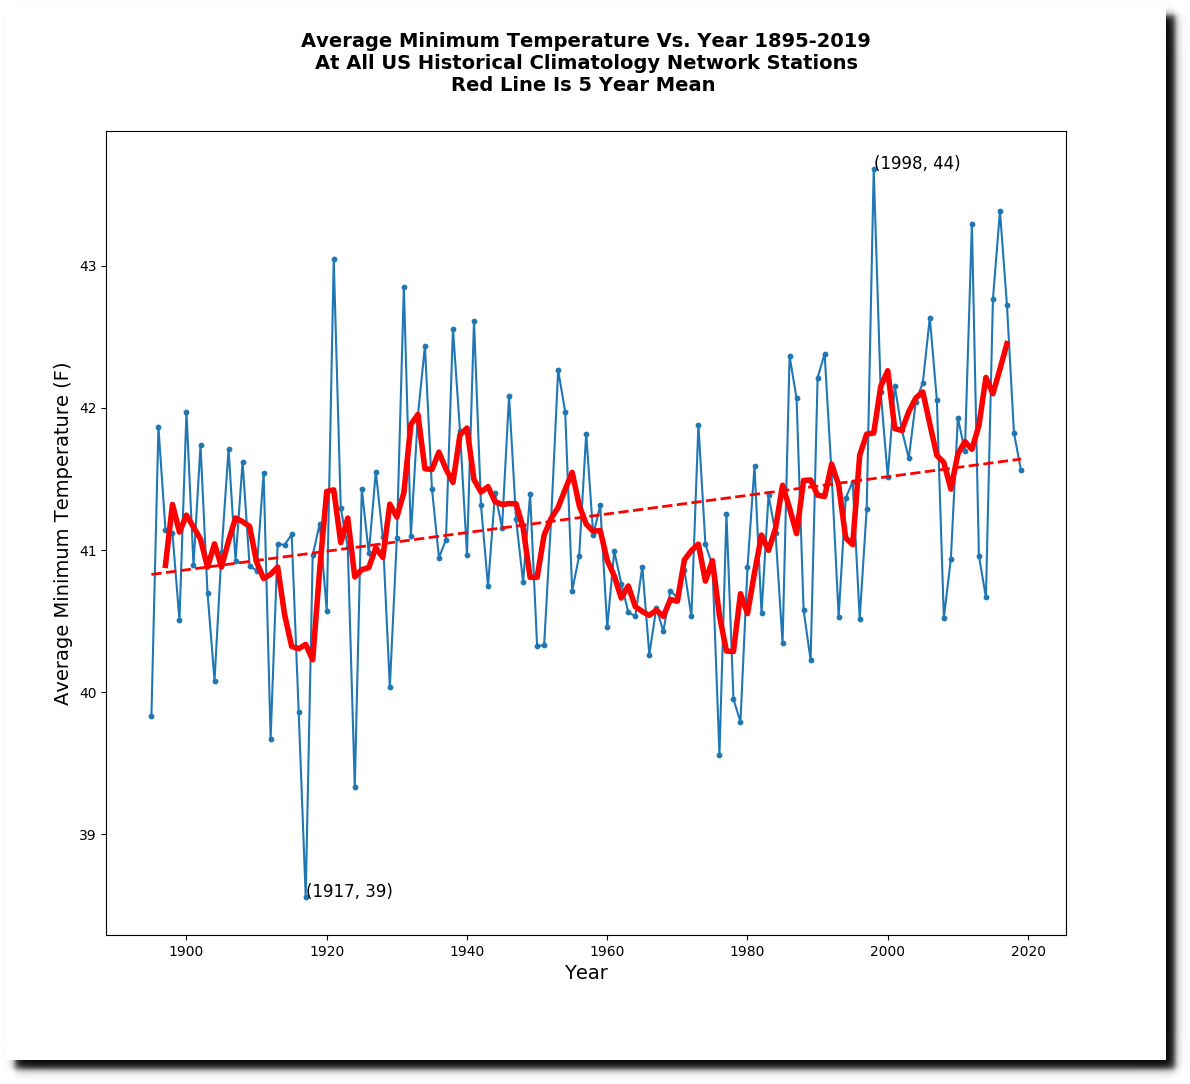
Nighttime temperatures in 1921 were also fourth highest in the US..
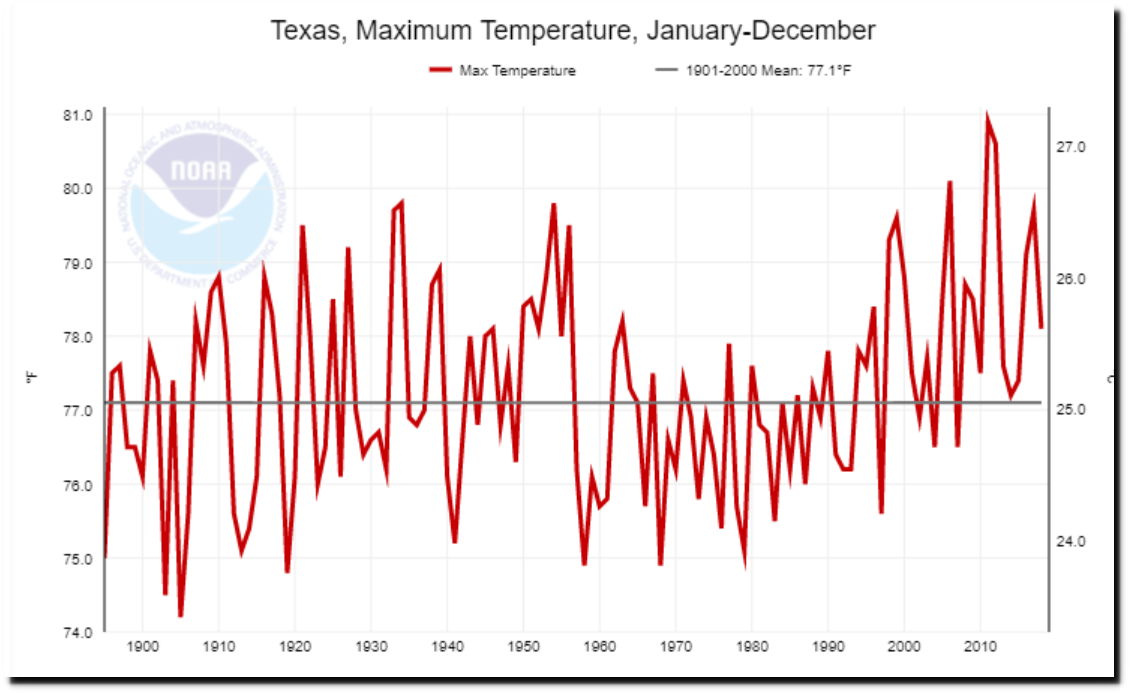
Before data tampering, Texas’ hottest year was 1921.
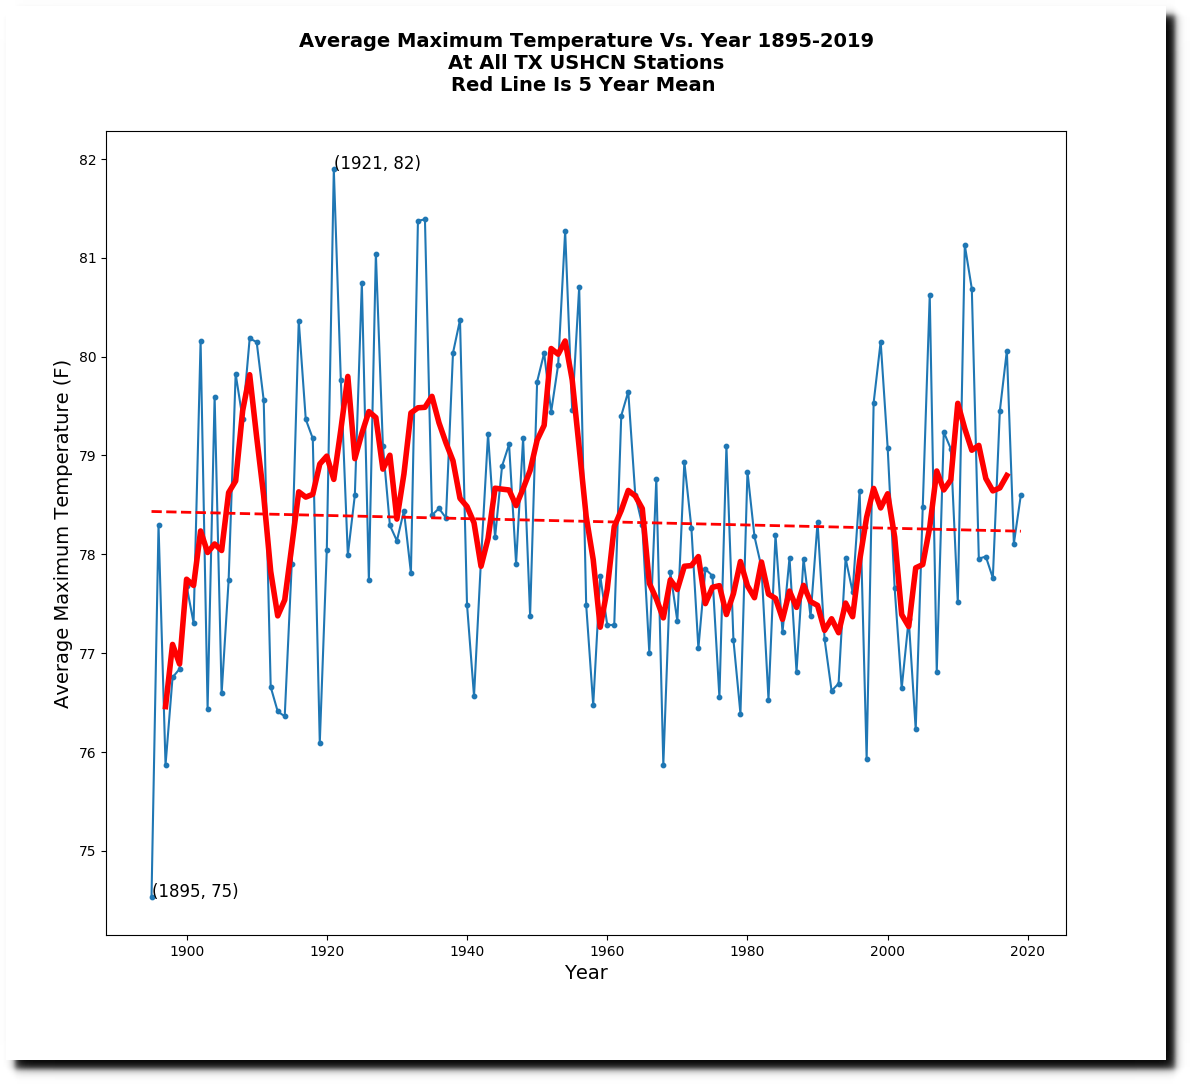
NOAA used to show 1921 as being the hottest year in Texas, but sometime after 2012, they altered the data to make Texas warm past disappear.
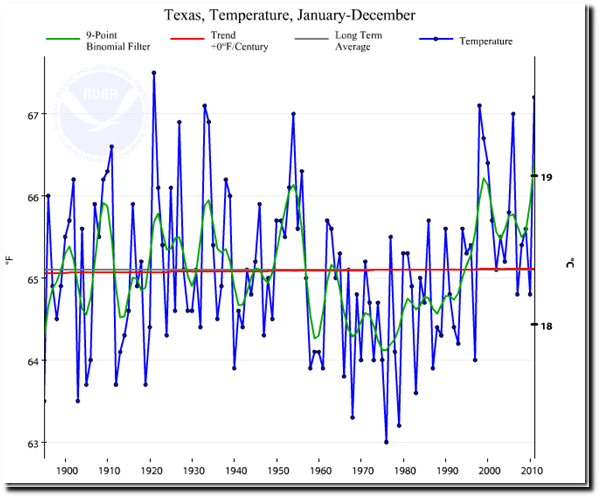
Climate scientists who have been claiming Texas is warming are totally wrong. | Watts Up With That?
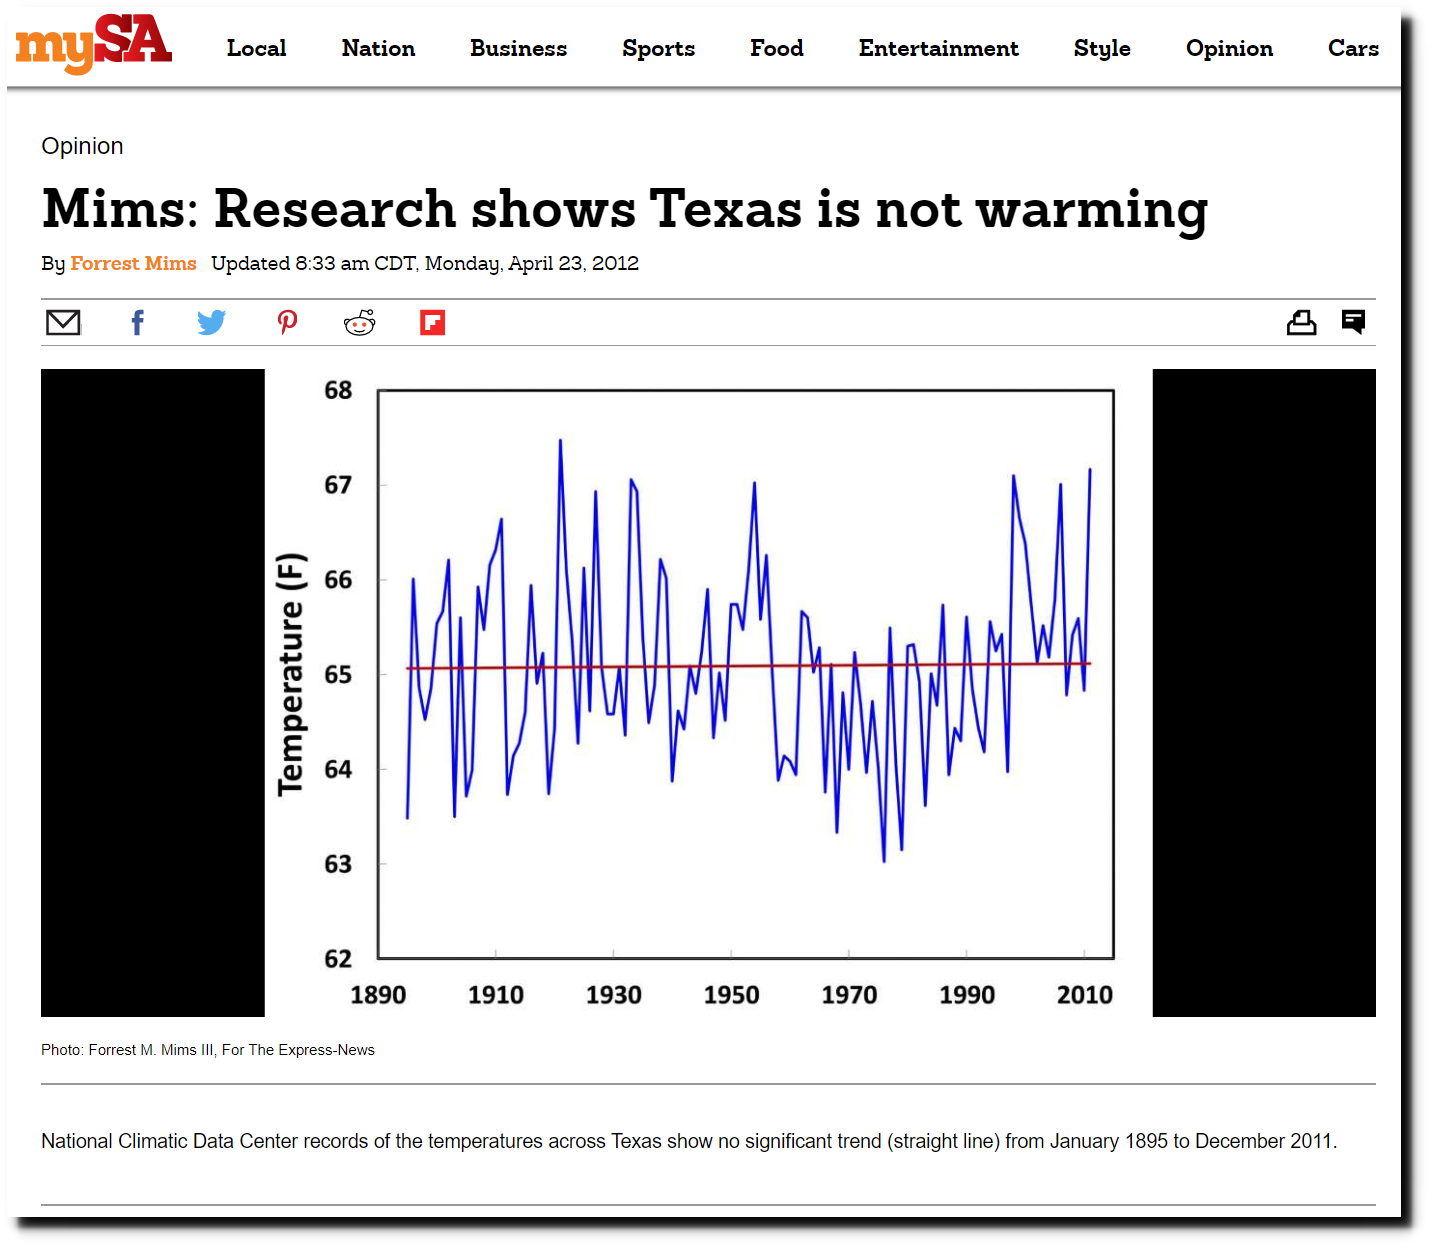
Mims: Research shows Texas is not warming – San Antonio Express-News
Climate at a Glance | National Centers for Environmental Information (NCEI)
Global temperature graphs also make no sense, with thin, rotten ice in 1922, when temperatures were claimed to be cold, and thick multi-year ice in 1983, when temepratures were supposed to be hot.
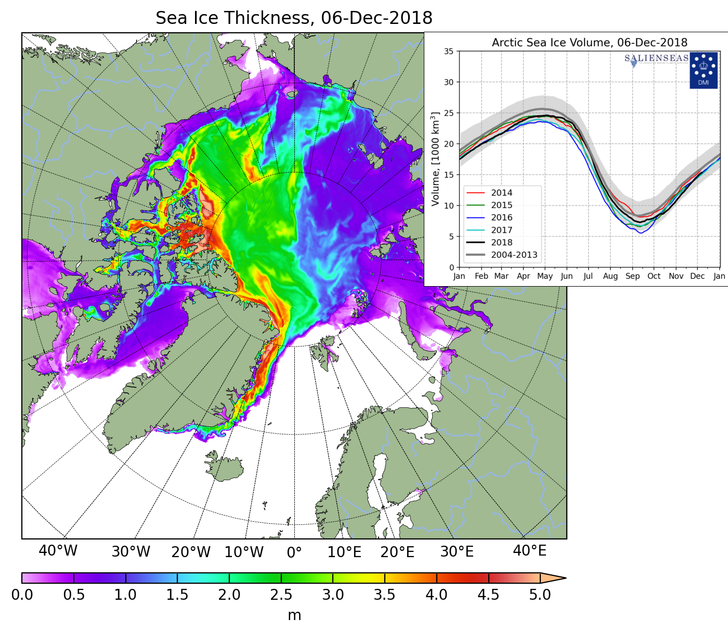
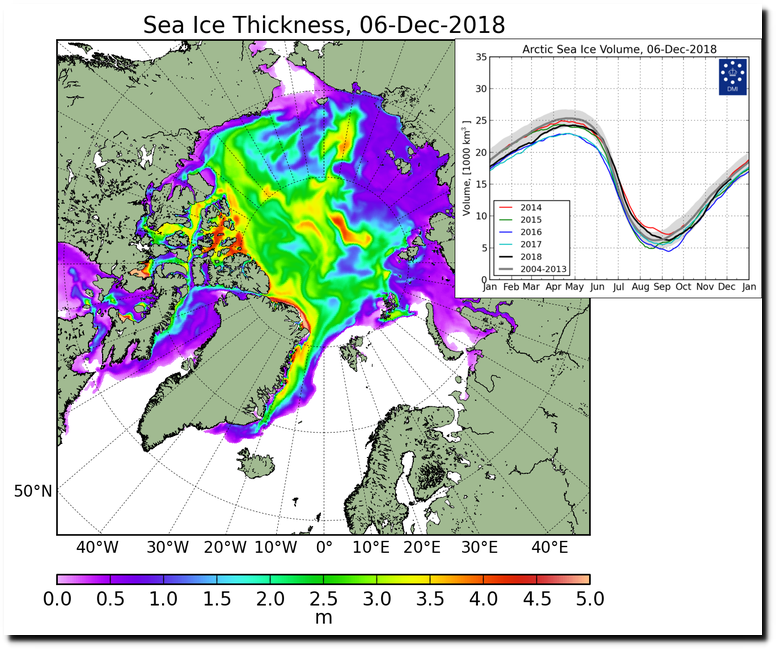
In a December 2018 article, NASA claimed that Arctic sea ice had lost two-thirds of its thickness since 1958.
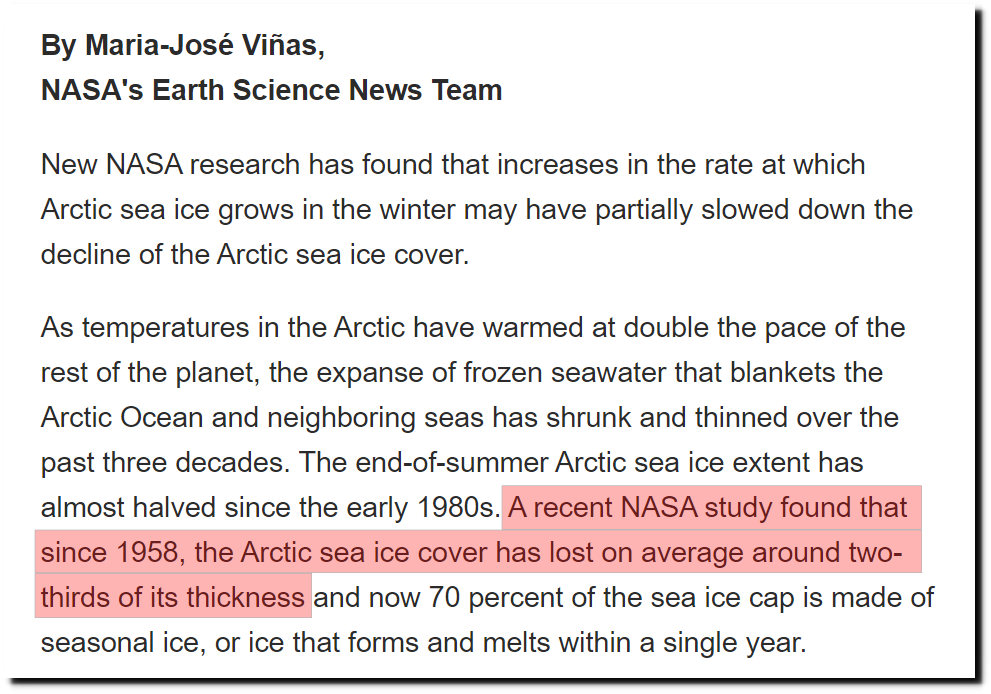
But this New York Times article from 1958 shows that sea ice thickness in 1958 was two meters, same as December, 2018.

The Changing Face of the Arctic; The Changing Face of the Arctic – The New York Times
CICE_combine_thick_SM_EN_20181206.png (758×631)
The decline in Arctic sea ice from the 1920s until the 1950s was widely reported.
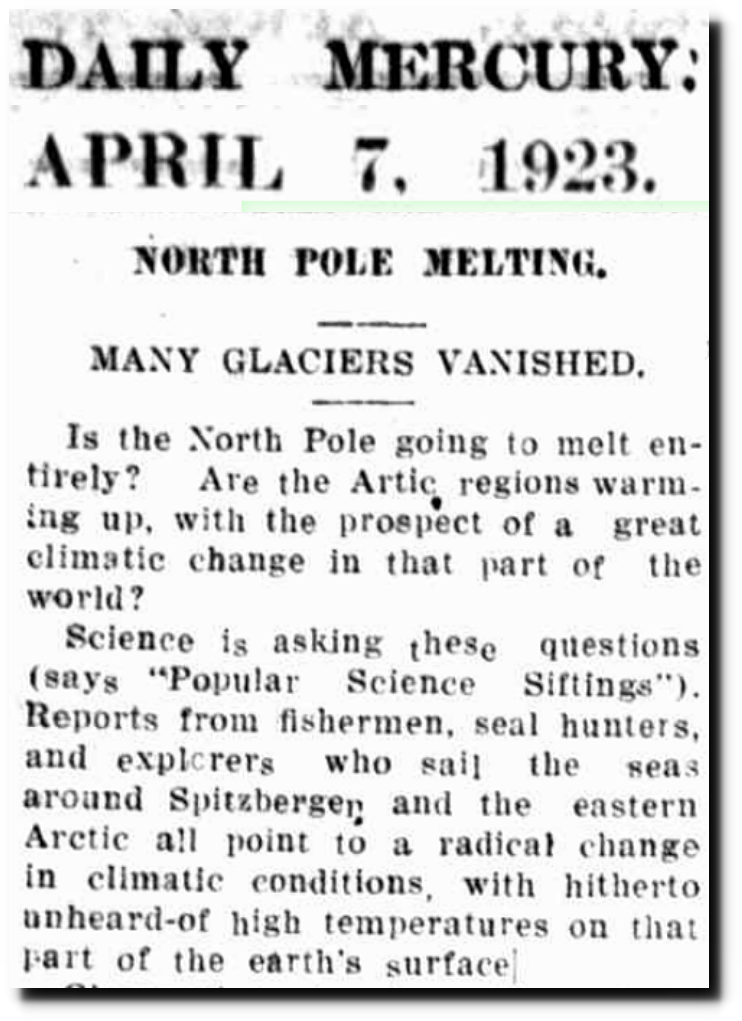
07 Apr 1923 – NORTH POLE MELTING. – Trove
Glaciers in Glacier National Park were forecast to disappear before 1950.
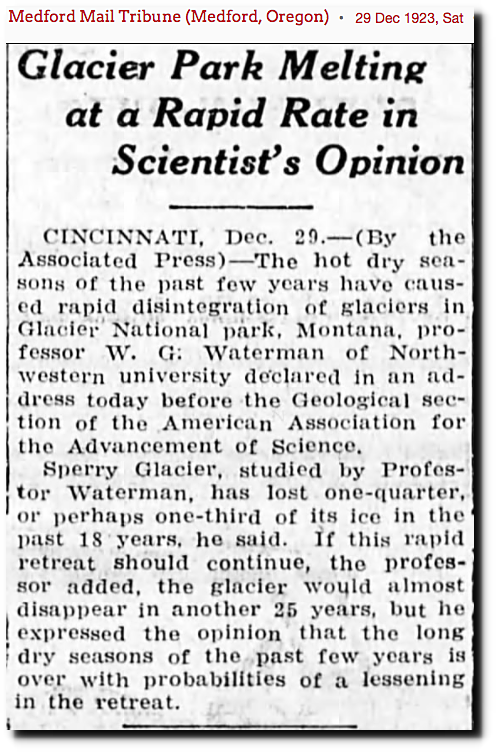
29 Dec 1923, Page 5 – at Newspapers.com
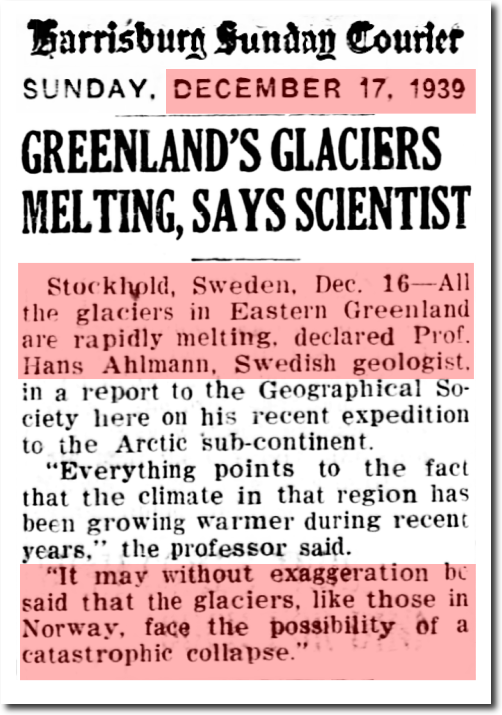
17 Dec 1939, Page 15 – Harrisburg Sunday Courier at Newspapers.com
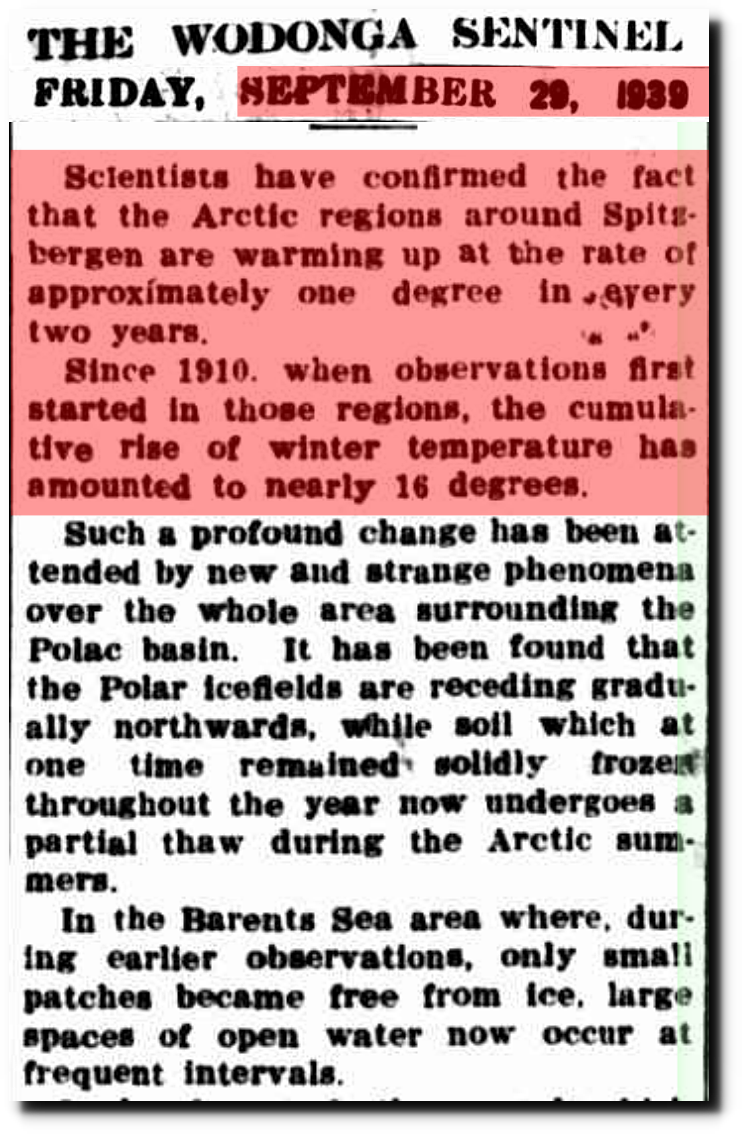
29 Sep 1939 – What is The World Coming To? – Trove
Current Melting of Greenland’s Ice Mimicks 1920s-1940s Event | NSF – National Science Foundation
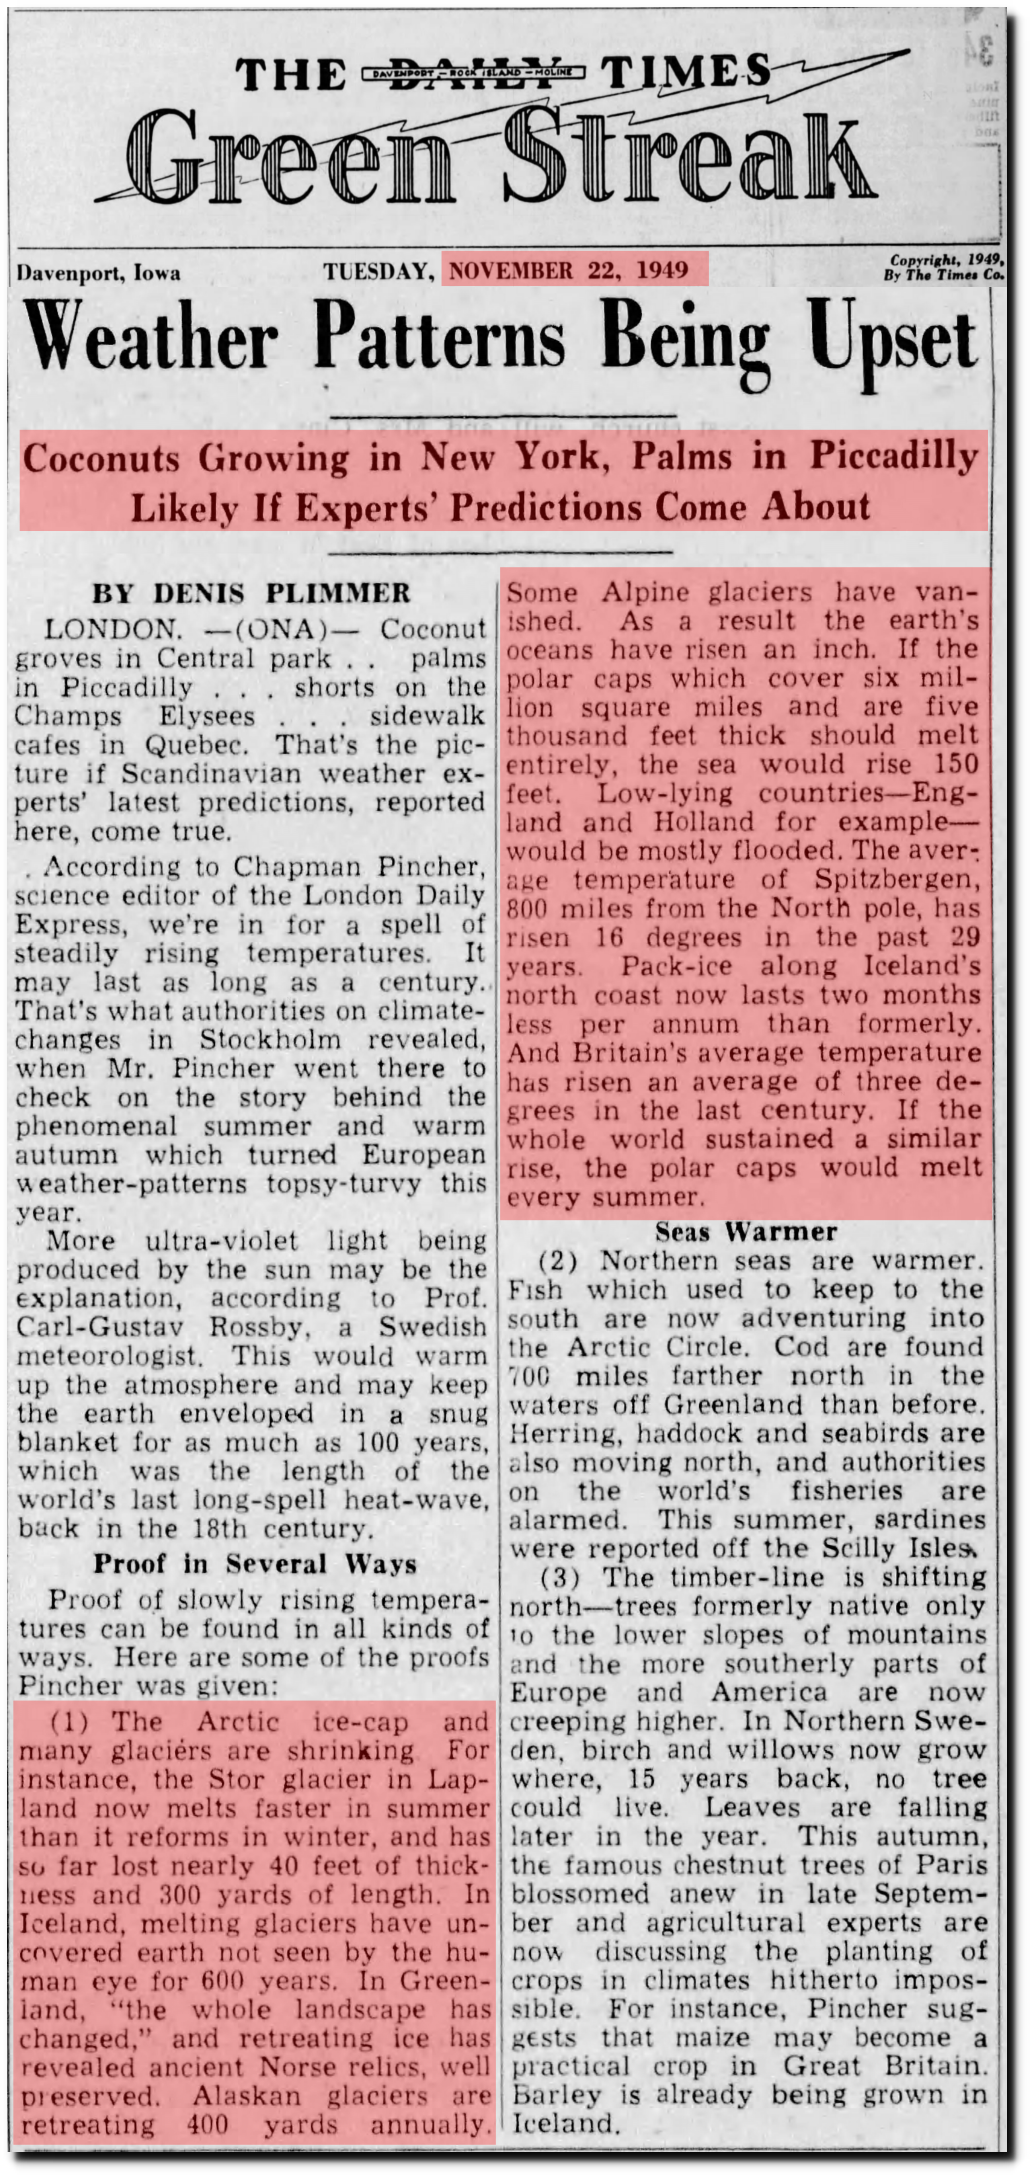 22 Nov 1949, 23 – The Daily Times at Newspapers.com
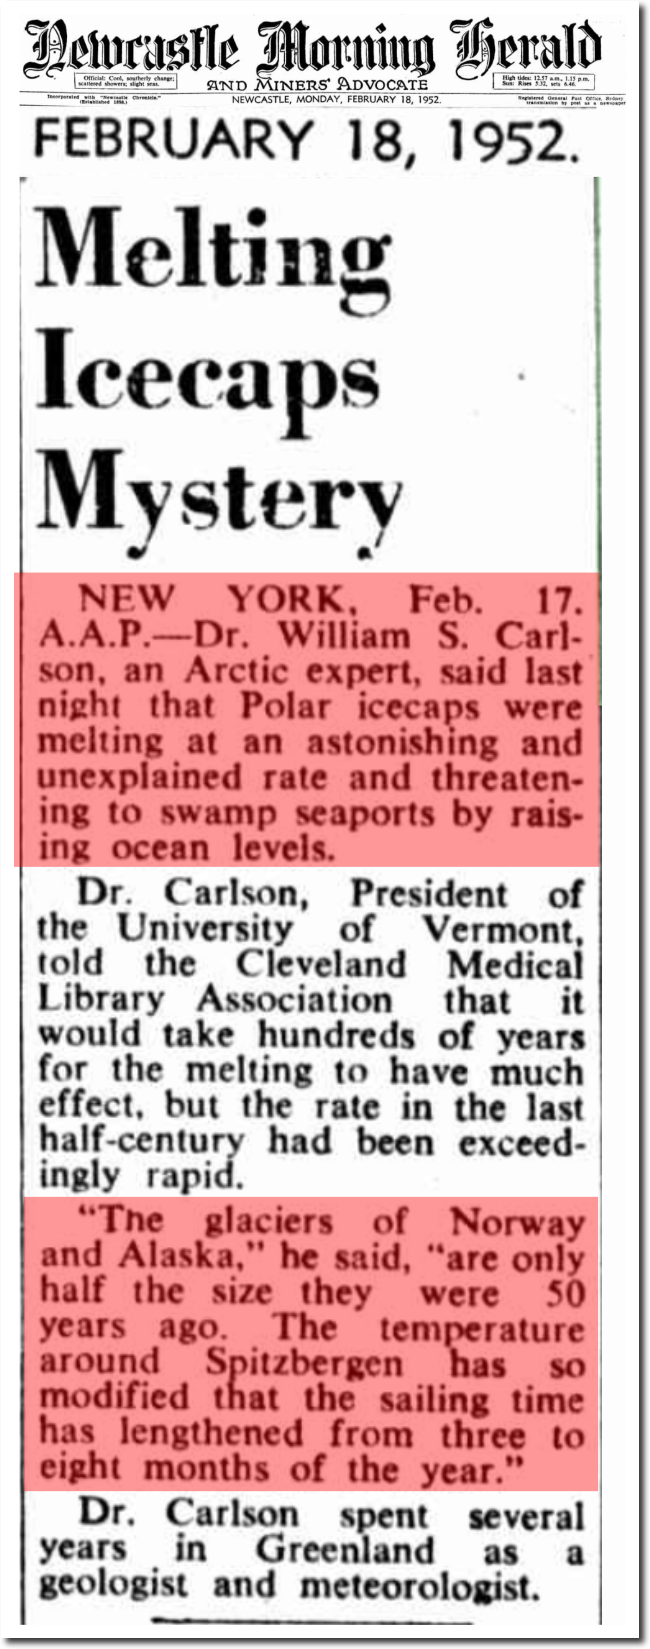
18 Feb 1952 – Melting Icecaps Mystery – Trove
The subsequent cooling and increase in sea ice after after the 1950s, was also widely reported.

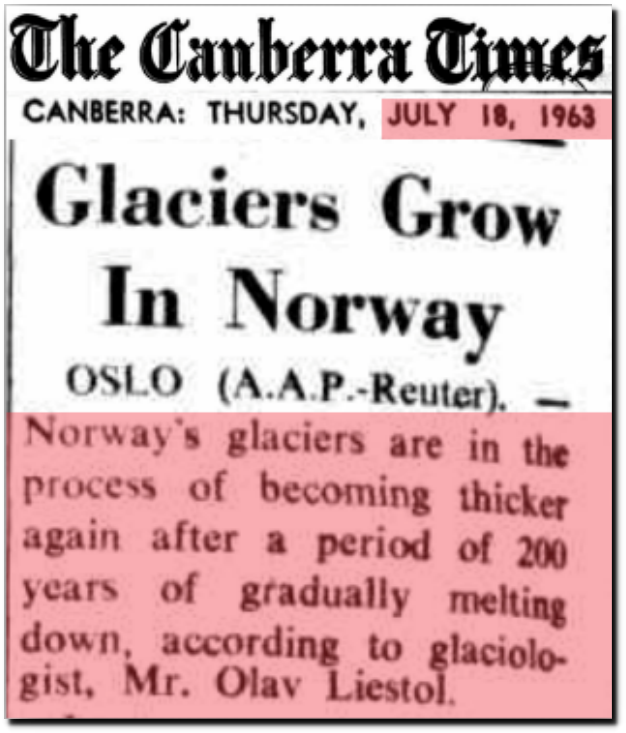
18 Jul 1963 – Glaciers Grow In Norway
U.S. and Soviet Press Studies of a Colder Arctic – The New York Times
14 Apr 1973, Page 8 – Iowa City Press-Citizen
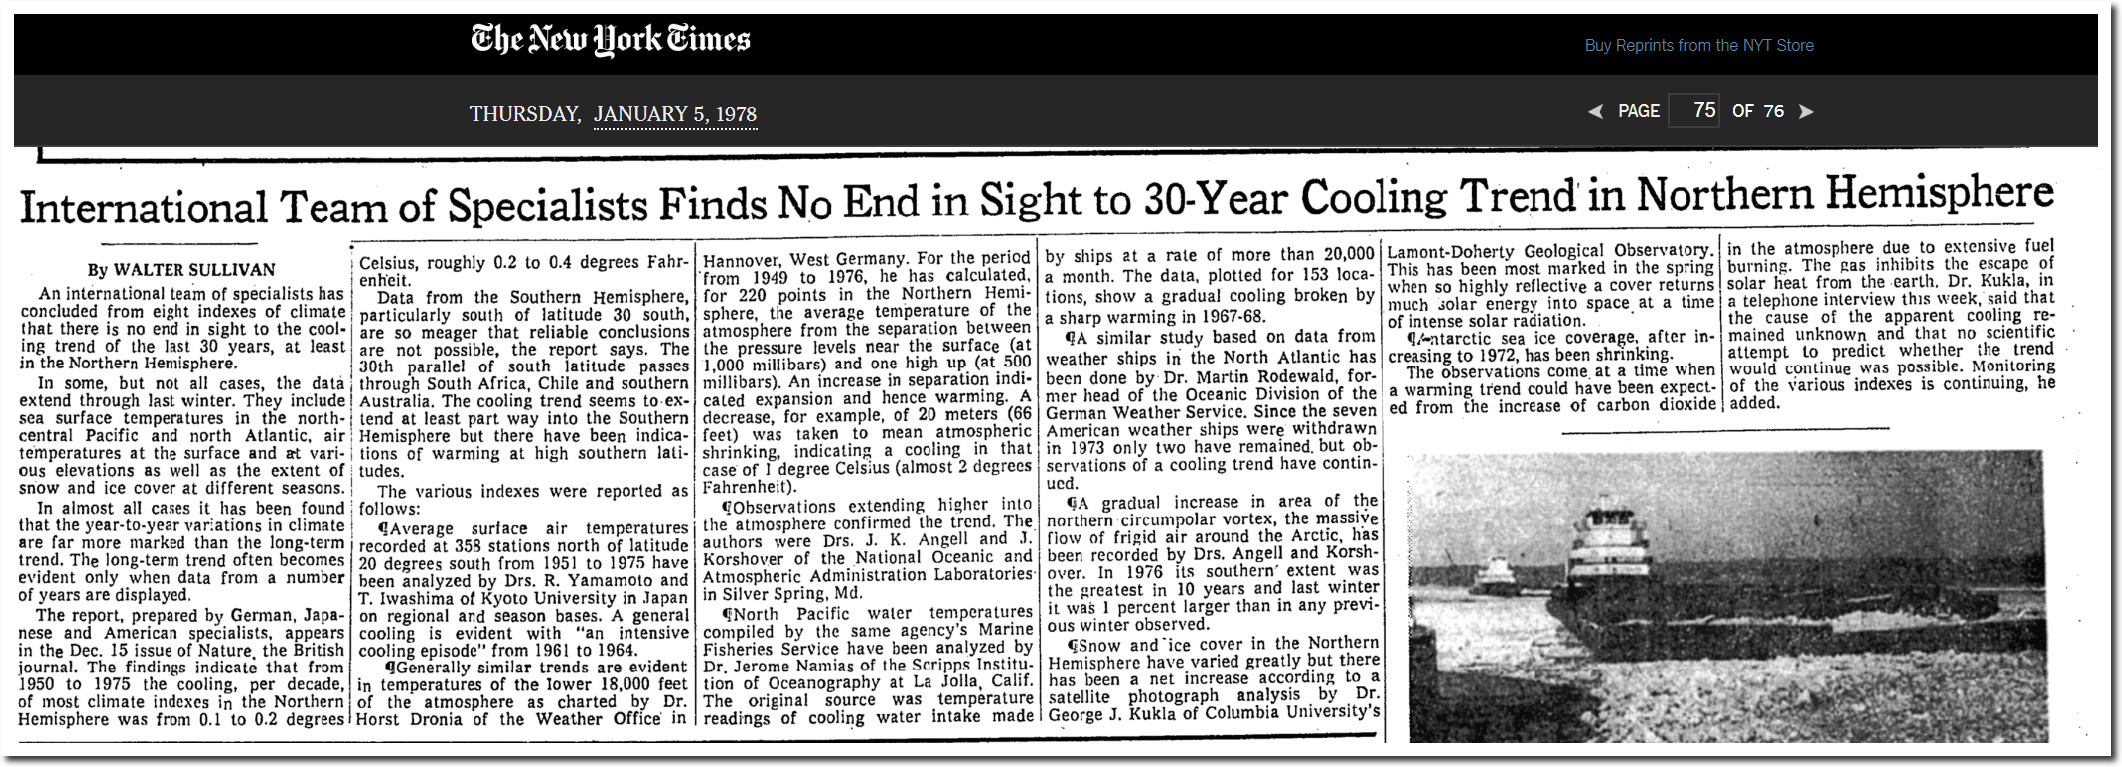
International Team of Specialists Finds No End in Sight to 30?Year Cooling Trend in Northern Hemisphere
By WALTER SULLIVAN JAN. 5, 1978
A gradual increase in area of the northern circumpolar vortex, the massive flow of frigid air around the Arctic, has been recorded by Drs. Angell and Korshover. In 1976 its southern’ extent was the greatest in 10 years and last winter it was 1 percent larger than in any previous winter observed.
Snow and ice cover in the Northern Hemisphere have varied greatly but there has been a net increase according to a satellite photograph analysis by Dr George J. Kukla of Columbia University’s Lamont?Doherty Geological Observatory. This has been most marked in the spring when so highly reflective a cover returns much solar energy into space at a time of intense solar radiation.
Nothing about Arctic alarmism or the official government temperature record makes any sense, but facts don’t matter to climate alarmists.

National Geographic says Greenland glaciers are growing, and simultaneously melting at the fastest rate in 350 years. 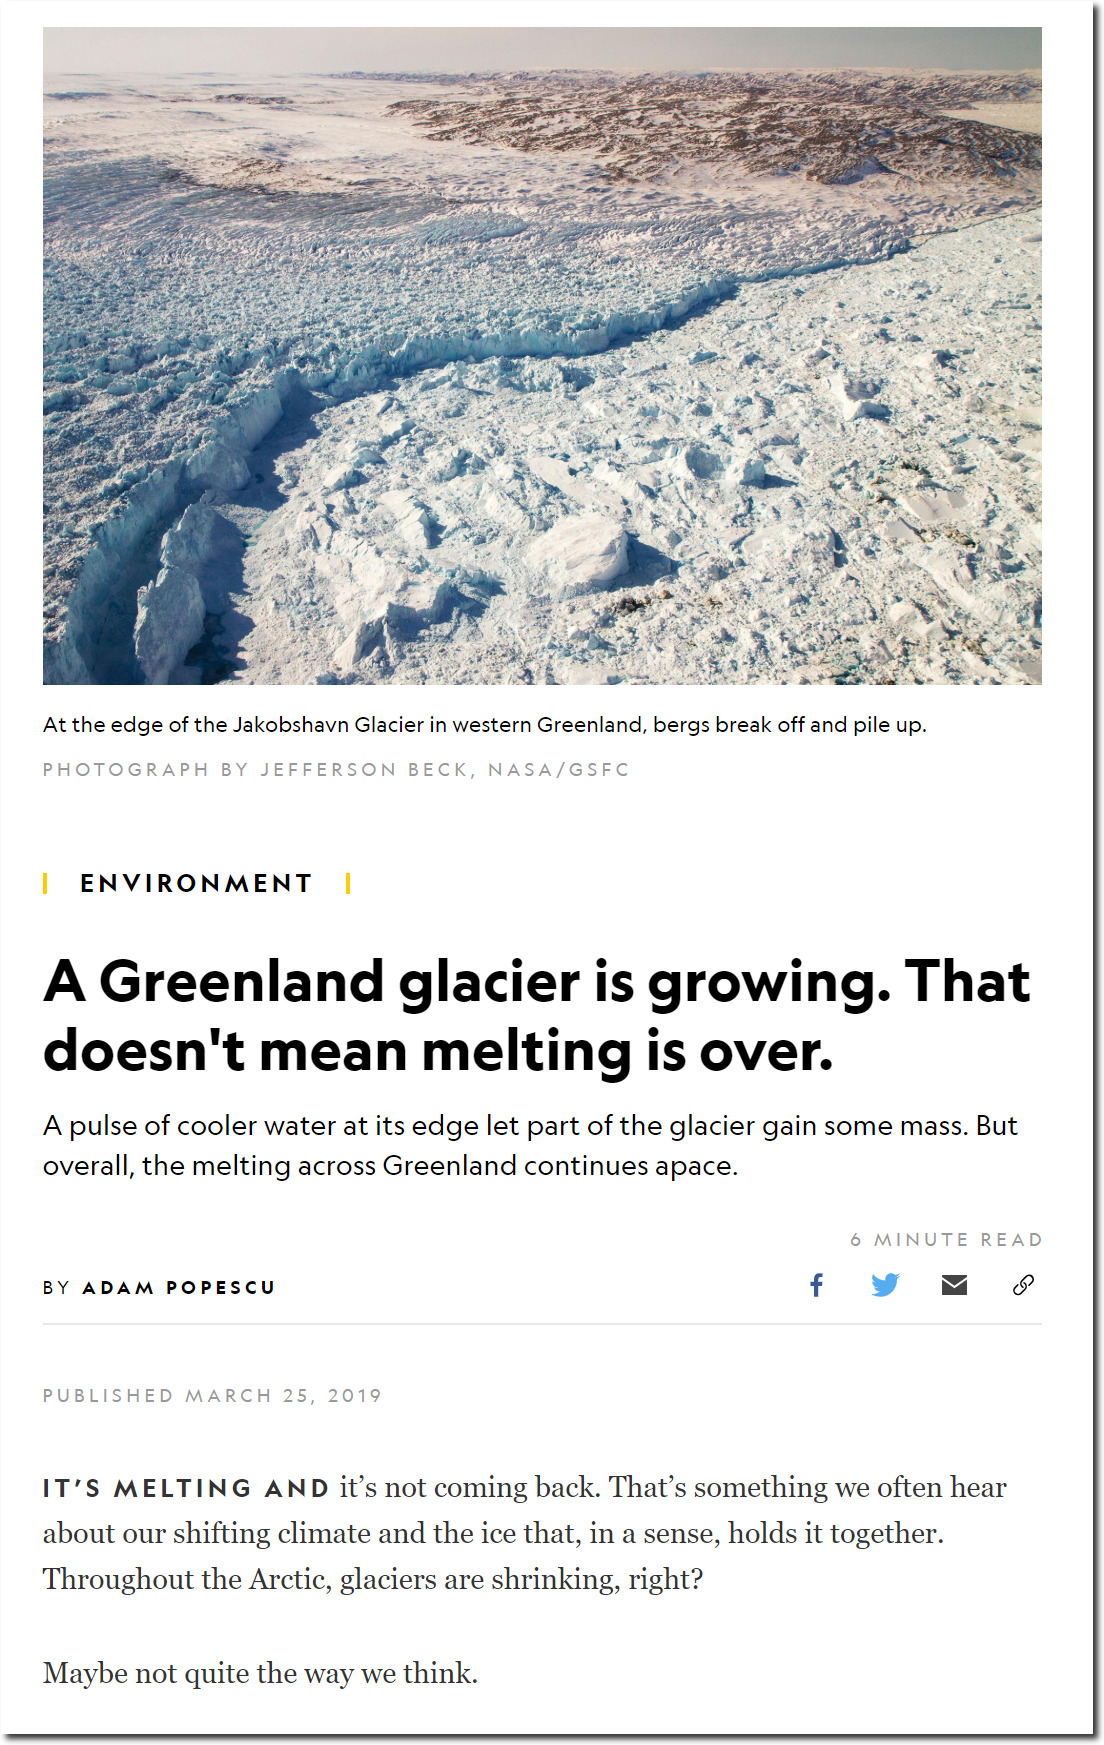
A Greenland glacier is growing. That’s not good news
Not only are the glaciers growing, but they are also shrinking at a record rate.
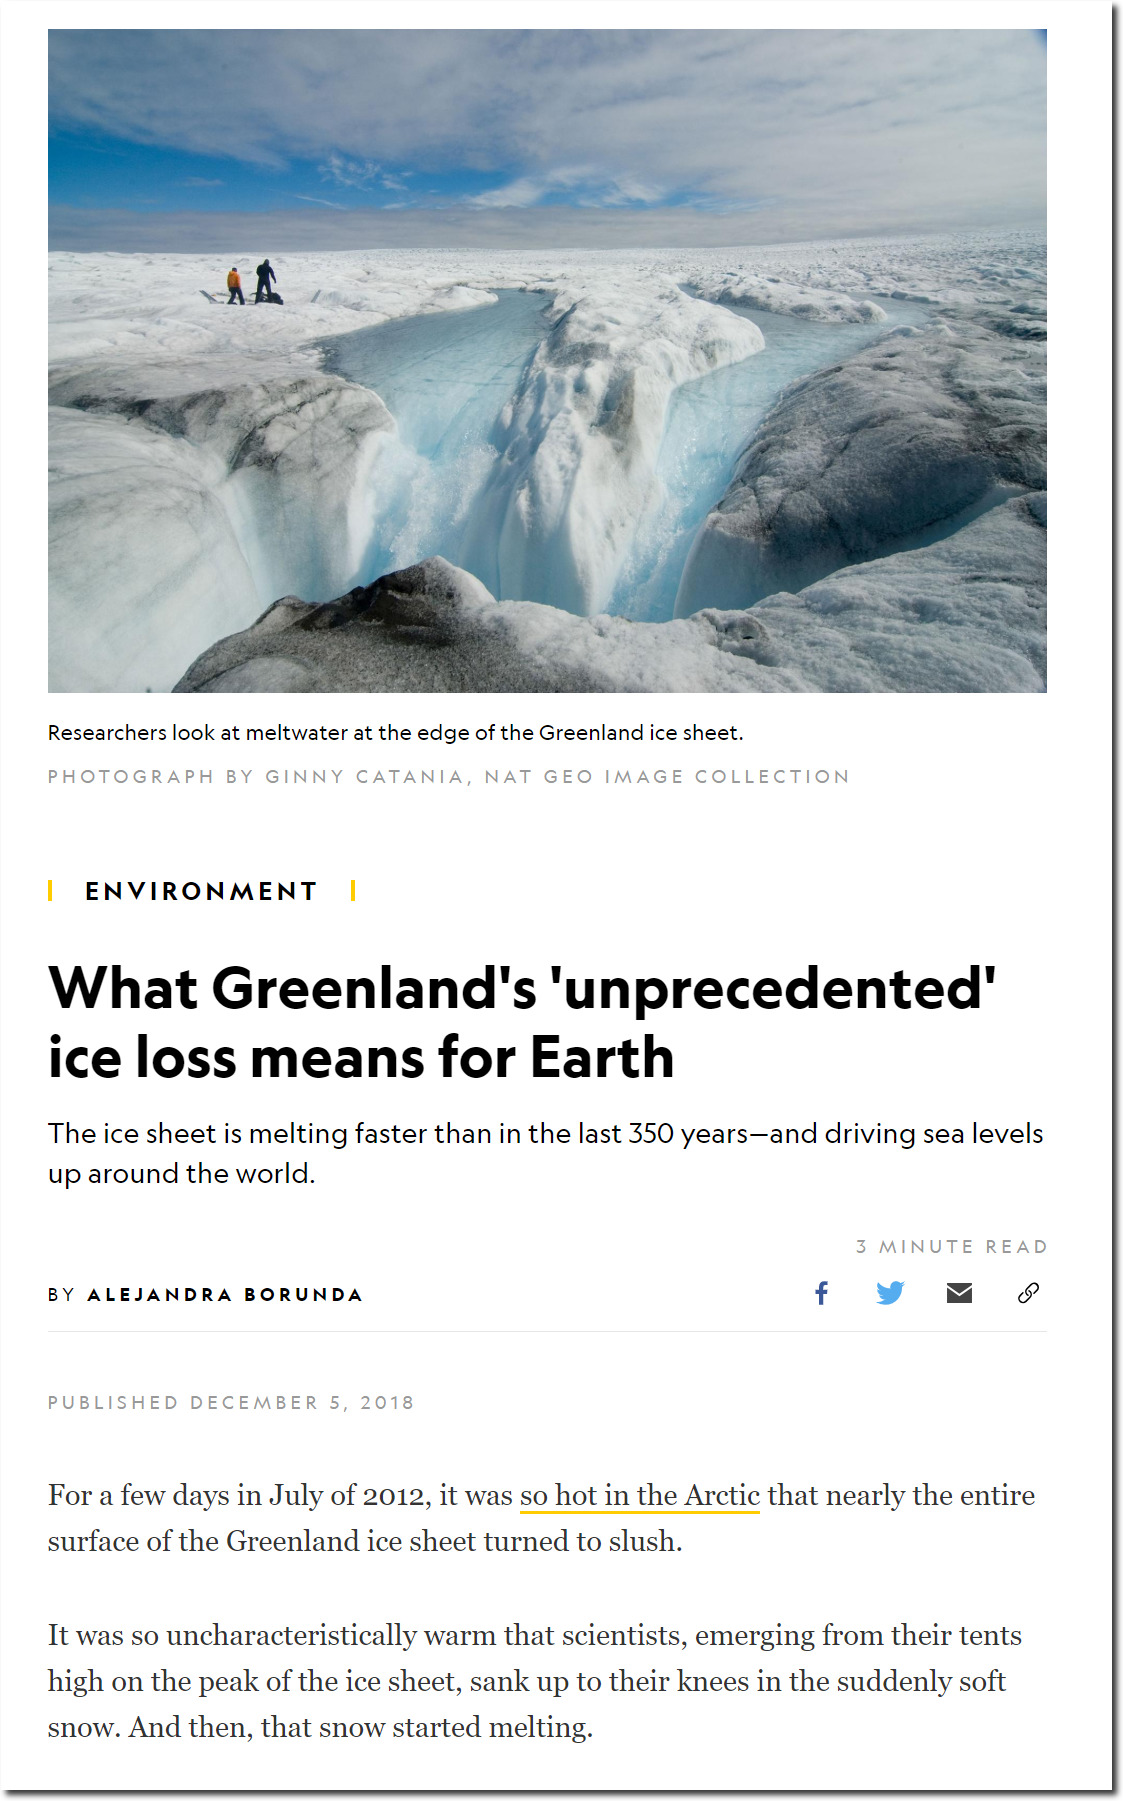
Greenland’s ice is melting faster than it has in 350 years—what it means
Posted in Uncategorized
Leave a comment
Climate Change In Australia
Eighty years ago, massive fires in Victoria forced people to flee to the beach.
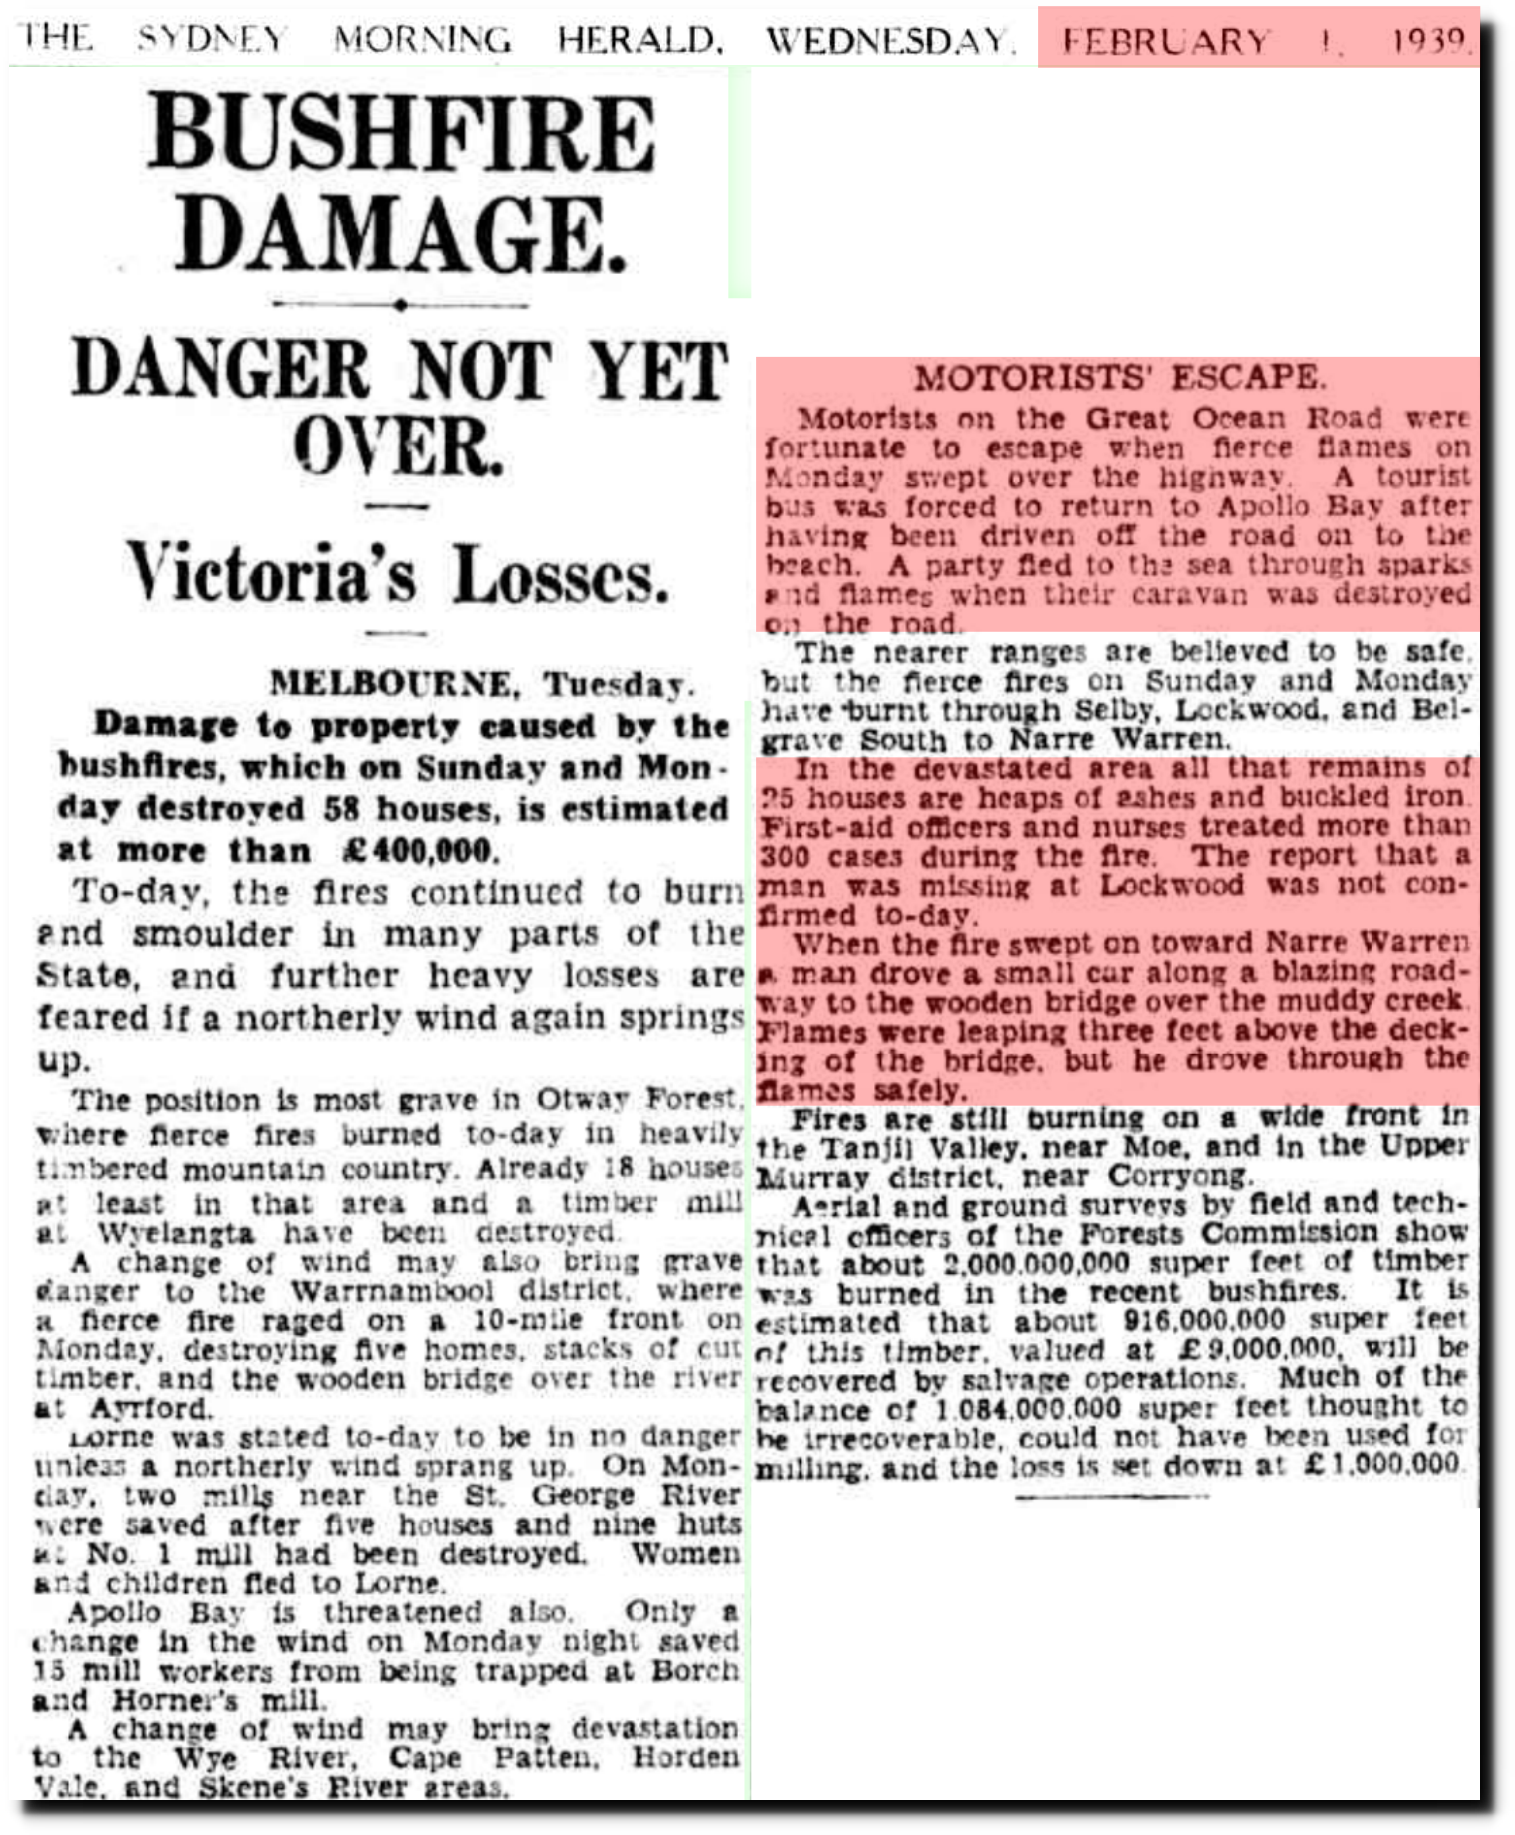
01 Feb 1939 – BUSHFIRE DAMAGE. – Trove
But the climate has changed over the past 80 years.
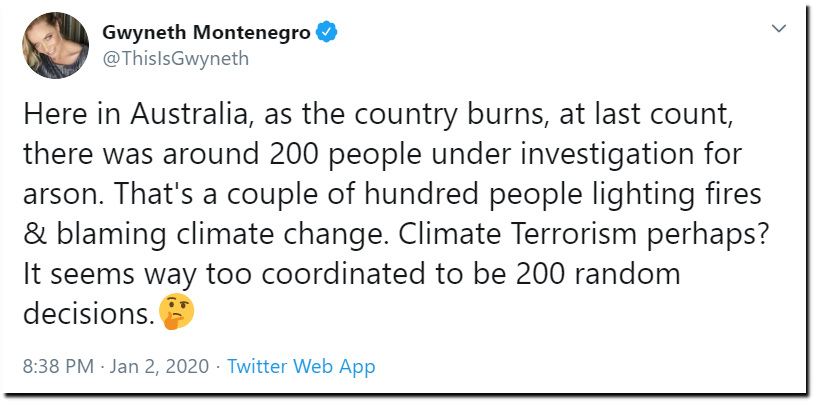
Climate Terrorism perhaps? It seems way too coordinated to be 200 random decisions.
Posted in Uncategorized
Leave a comment
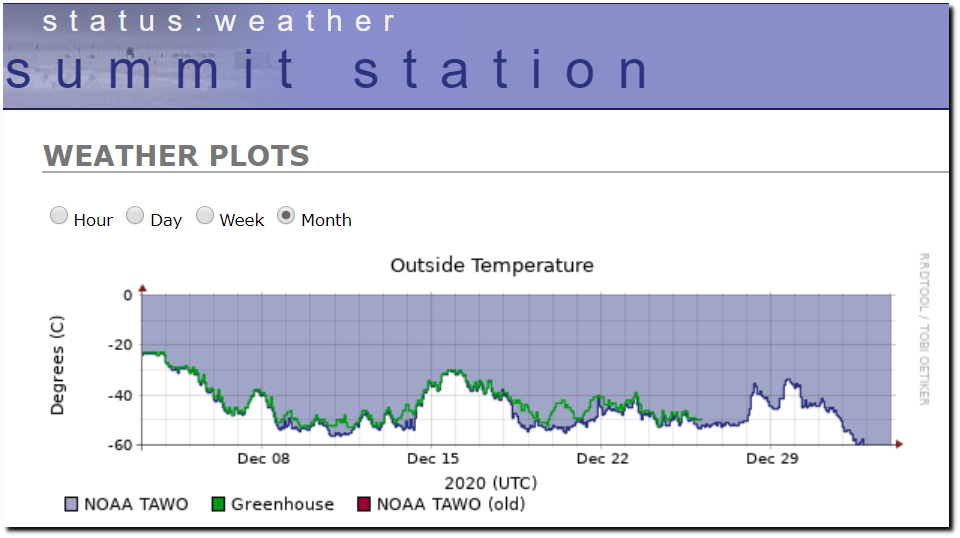
Greenland Burning!
Off-scale cold in Greenland, as the press reports record warmth and announces a tipping point.

Posted in Uncategorized
Leave a comment