
Disrupting the Borg is expensive and time consuming!

Google Search
-
Recent Posts
- Analyzing The Western Water Crisis
- Gaslighting 1924
- “Why Do You Resist?”
- Climate Attribution Model
- Fact Checking NASA
- Fact Checking Grok
- Fact Checking The New York Times
- New Visitech Features
- Ice-Free Arctic By 2014
- Debt-Free US Treasury Forecast
- Analyzing Big City Crime (Part 2)
- Analyzing Big City Crime
- UK Migration Caused By Global Warming
- Climate Attribution In Greece
- “Brown: ’50 days to save world'”
- The Catastrophic Influence of Bovine Methane Emissions on Extraterrestrial Climate Patterns
- Posting On X
- Seventeen Years Of Fun
- The Importance Of Good Tools
- Temperature Shifts At Blue Hill, MA
- CO2²
- Time Of Observation Bias
- Climate Scamming For Profit
- Climate Scamming For Profit
- Back To The Future
March 2026 M T W T F S S 1 2 3 4 5 6 7 8 9 10 11 12 13 14 15 16 17 18 19 20 21 22 23 24 25 26 27 28 29 30 31 Recent Comments
- Bob G on Analyzing The Western Water Crisis
- arn on Analyzing The Western Water Crisis
- Bob G on Analyzing The Western Water Crisis
- Bob G on Analyzing The Western Water Crisis
- Bob G on Analyzing The Western Water Crisis
- Hank Phillips on Analyzing The Western Water Crisis
- Hank Phillips on Analyzing The Western Water Crisis
- Hank Phillips on Analyzing The Western Water Crisis
- Hank Phillips on Analyzing The Western Water Crisis
- Bob G on Analyzing The Western Water Crisis
NOAA Blocks Access To Their Temperature Data
Perhaps NOAA is tired of people being able to access untampered temperature data, and have blocked access to their public ftp site. They want a private connection to a public (pub) web page.

ftp://ftp.ncdc.noaa.gov/pub/data/ghcn/daily/
Hopefully this is a temporary situation.
Posted in Uncategorized
Leave a comment
More Spectacular Climate Fraud From Climate Central
Climate Central says North American snow cover is on the decline, and it is due in part to winter precipitation falling as rain rather than snow. They say their data comes from Rutgers University.
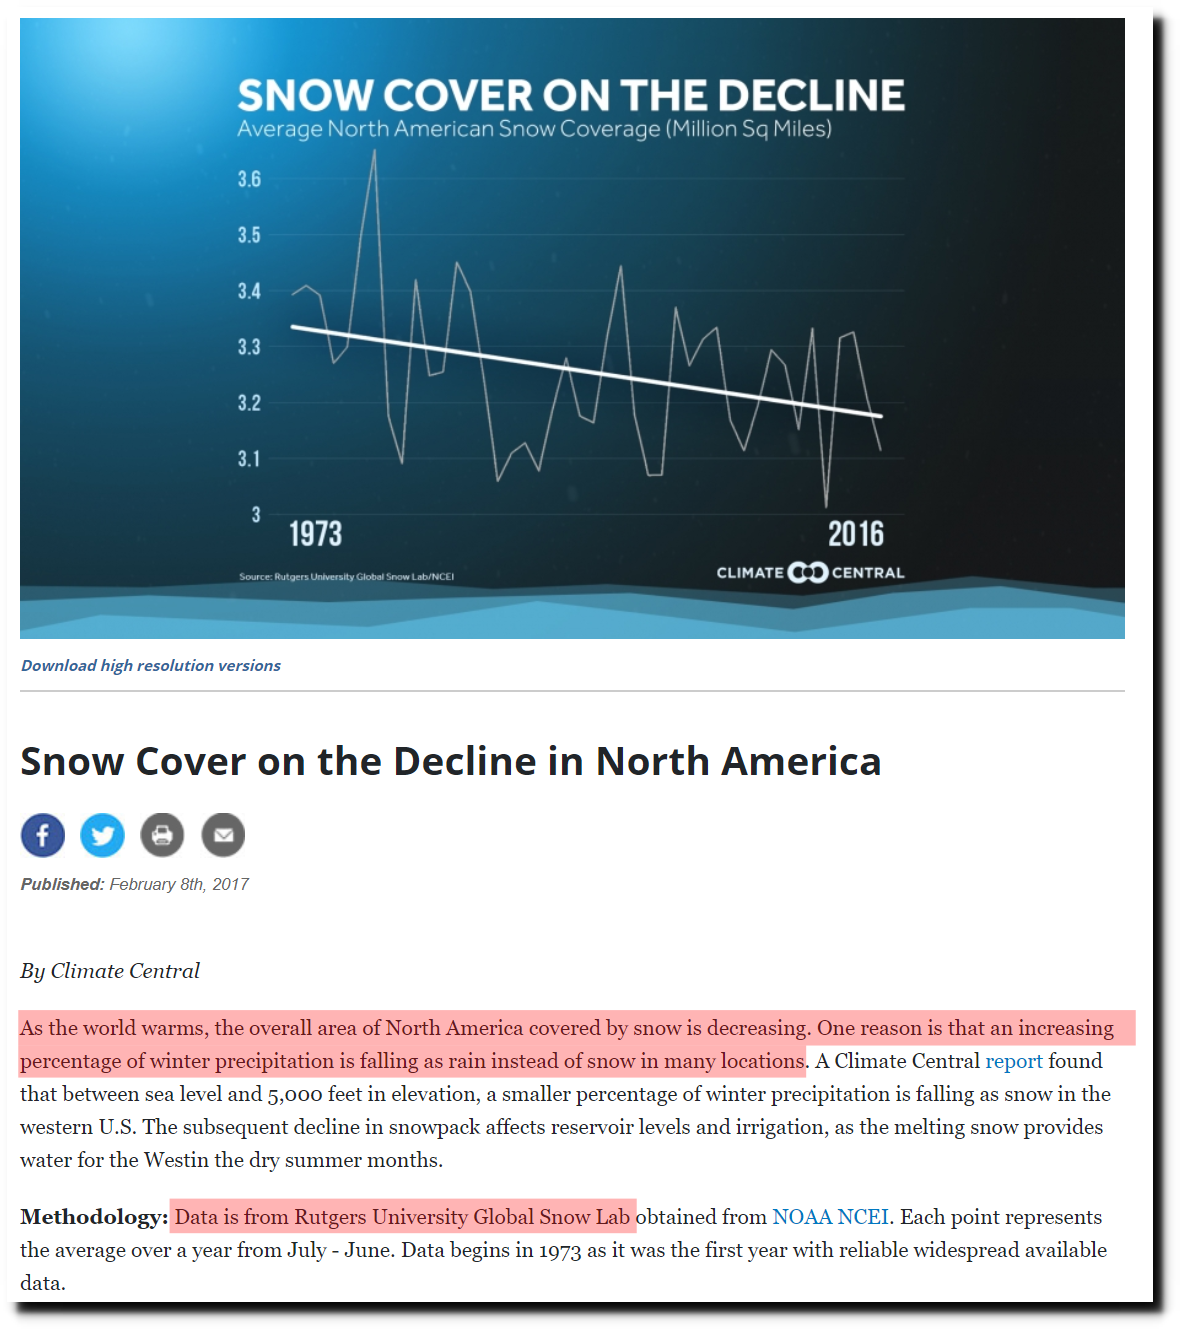
Snow Cover on the Decline in North America | Climate Central
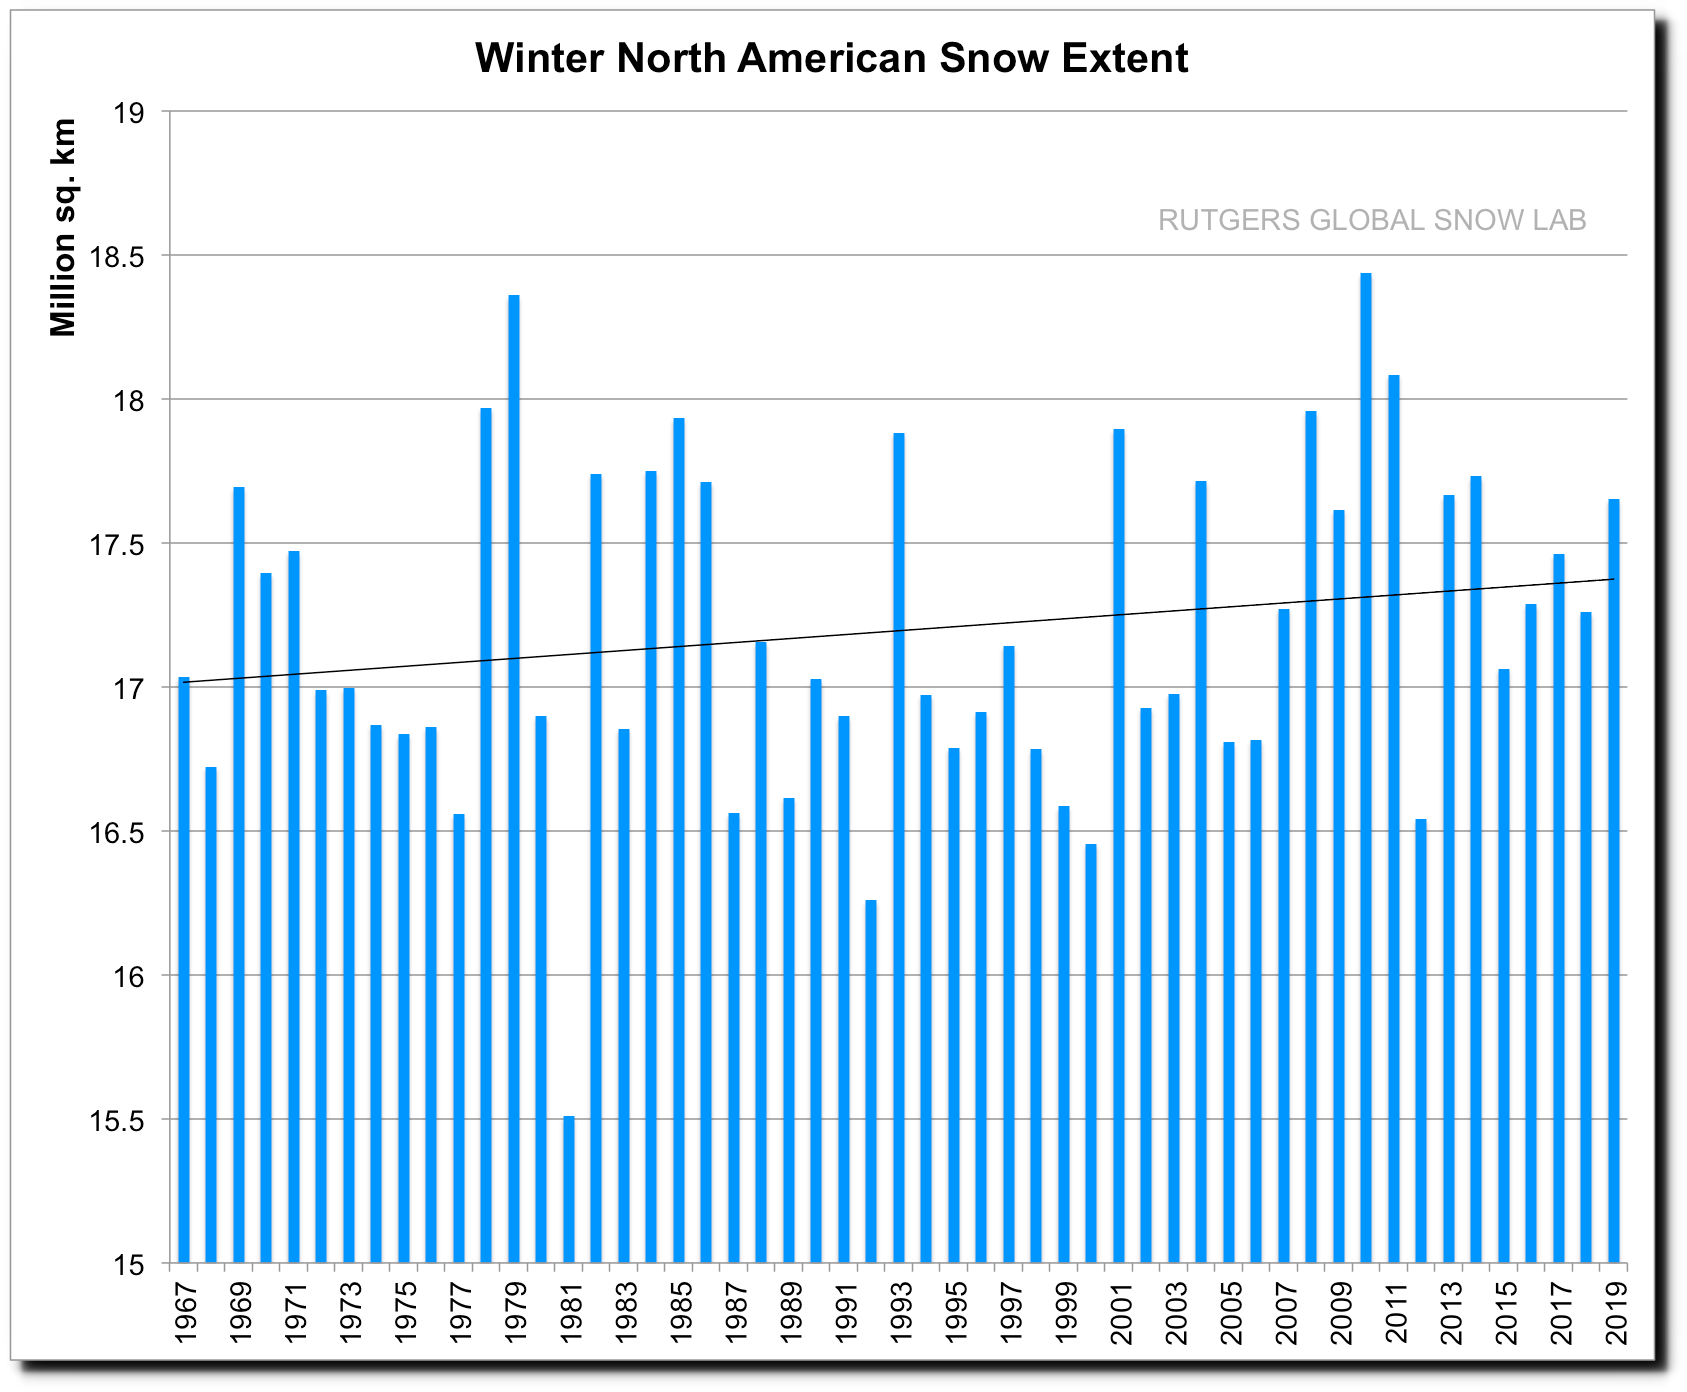
The actual data from Rutgers University shows 50 years of increasing winter snow extent. Climate Central is simply making things up – like they normally do.
Same story with Autumn snow cover. Last year had the highest extent on record.
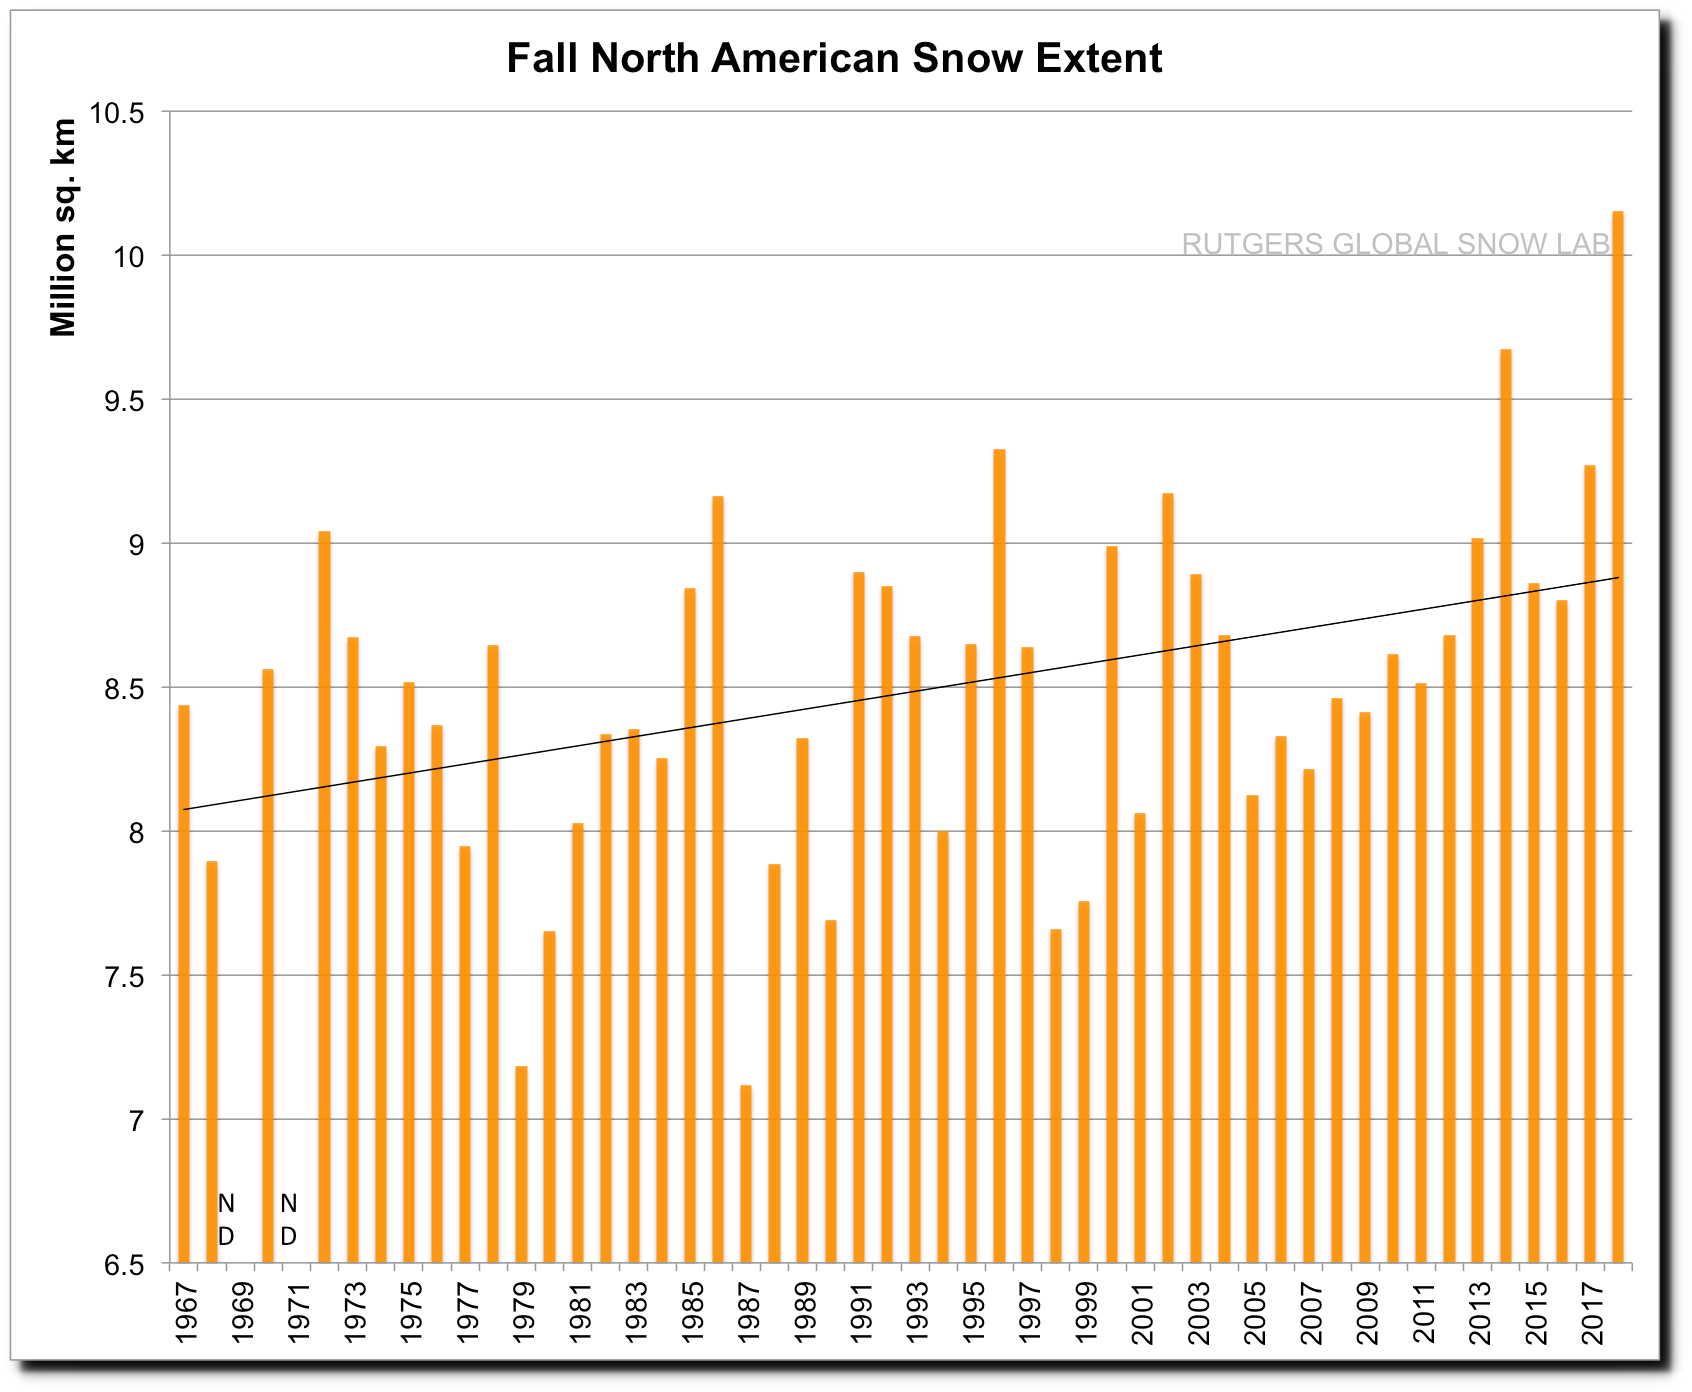
The only season which has a downwards trend is spring, but six of the last nine springs have had above average extent.

The complete data set from Reuters shows that snow extent has been increasing since CO2 hit 350 PPM in 1988, and has been continuously above average for the past few years.
The Rutgers data for North America shows no trend since 1973, the date which Climate Central used for their trend.
Rutgers University Climate Lab :: Global Snow Lab
Last ski season produced record skiing in the US and Europe
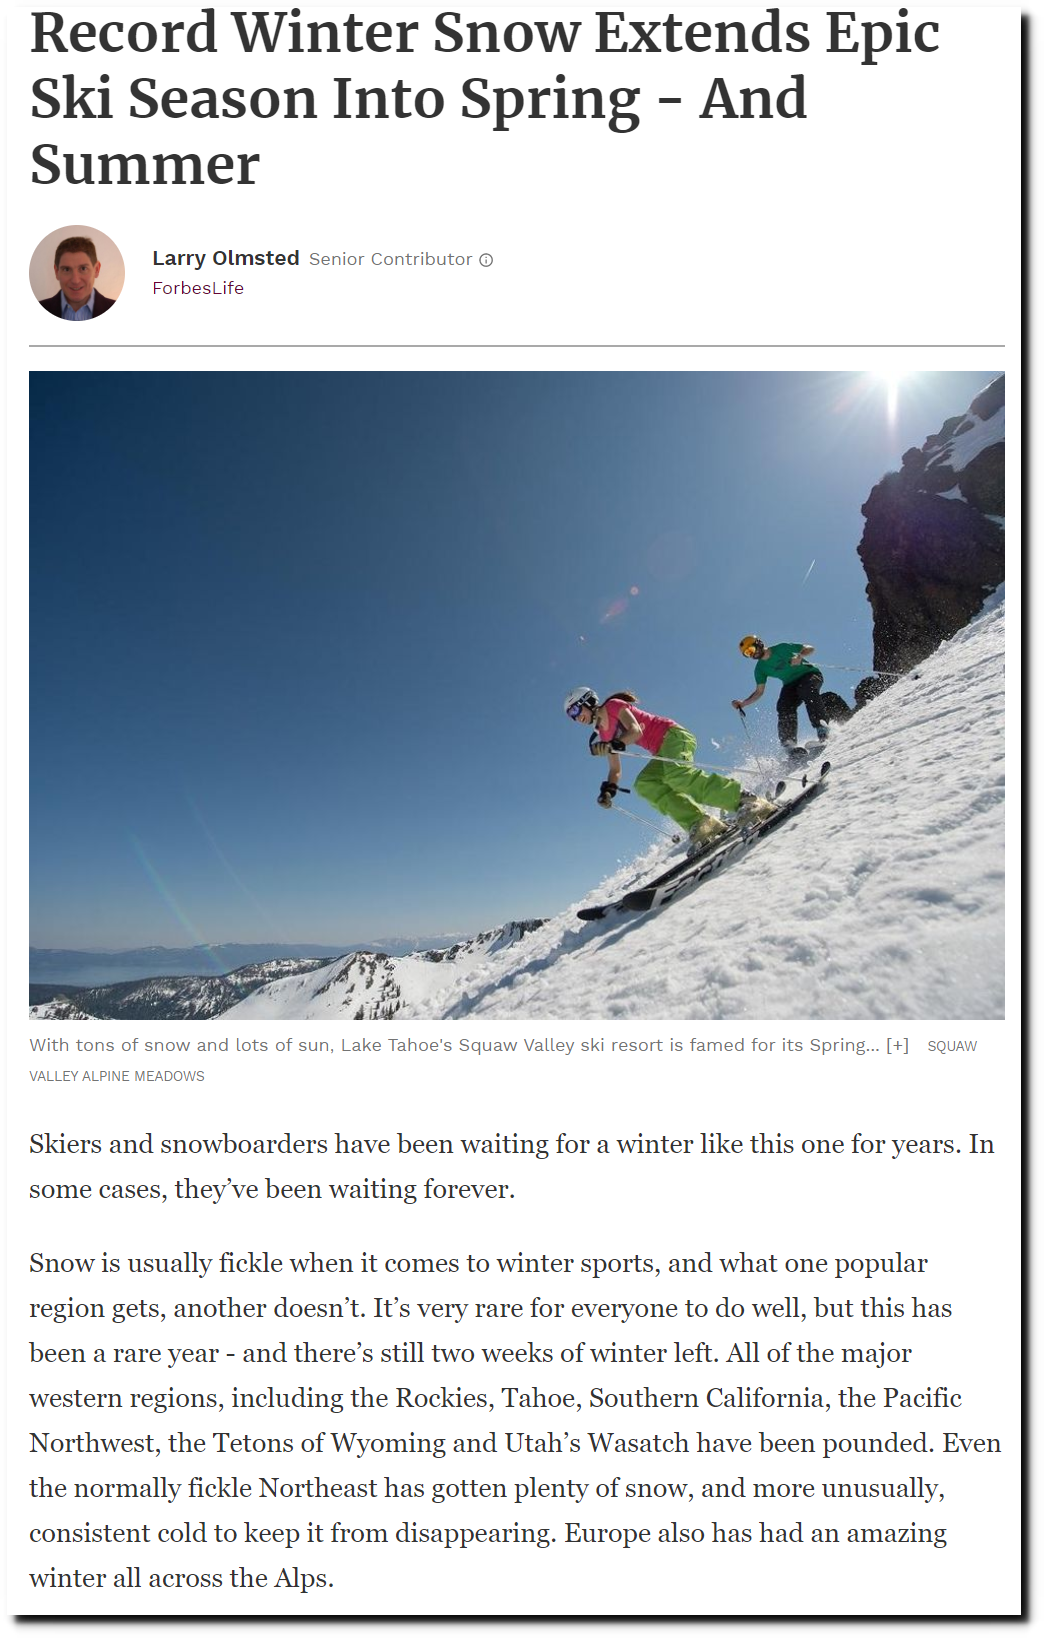
Record Winter Snow Extends Epic Ski Season Into Spring – And Summer
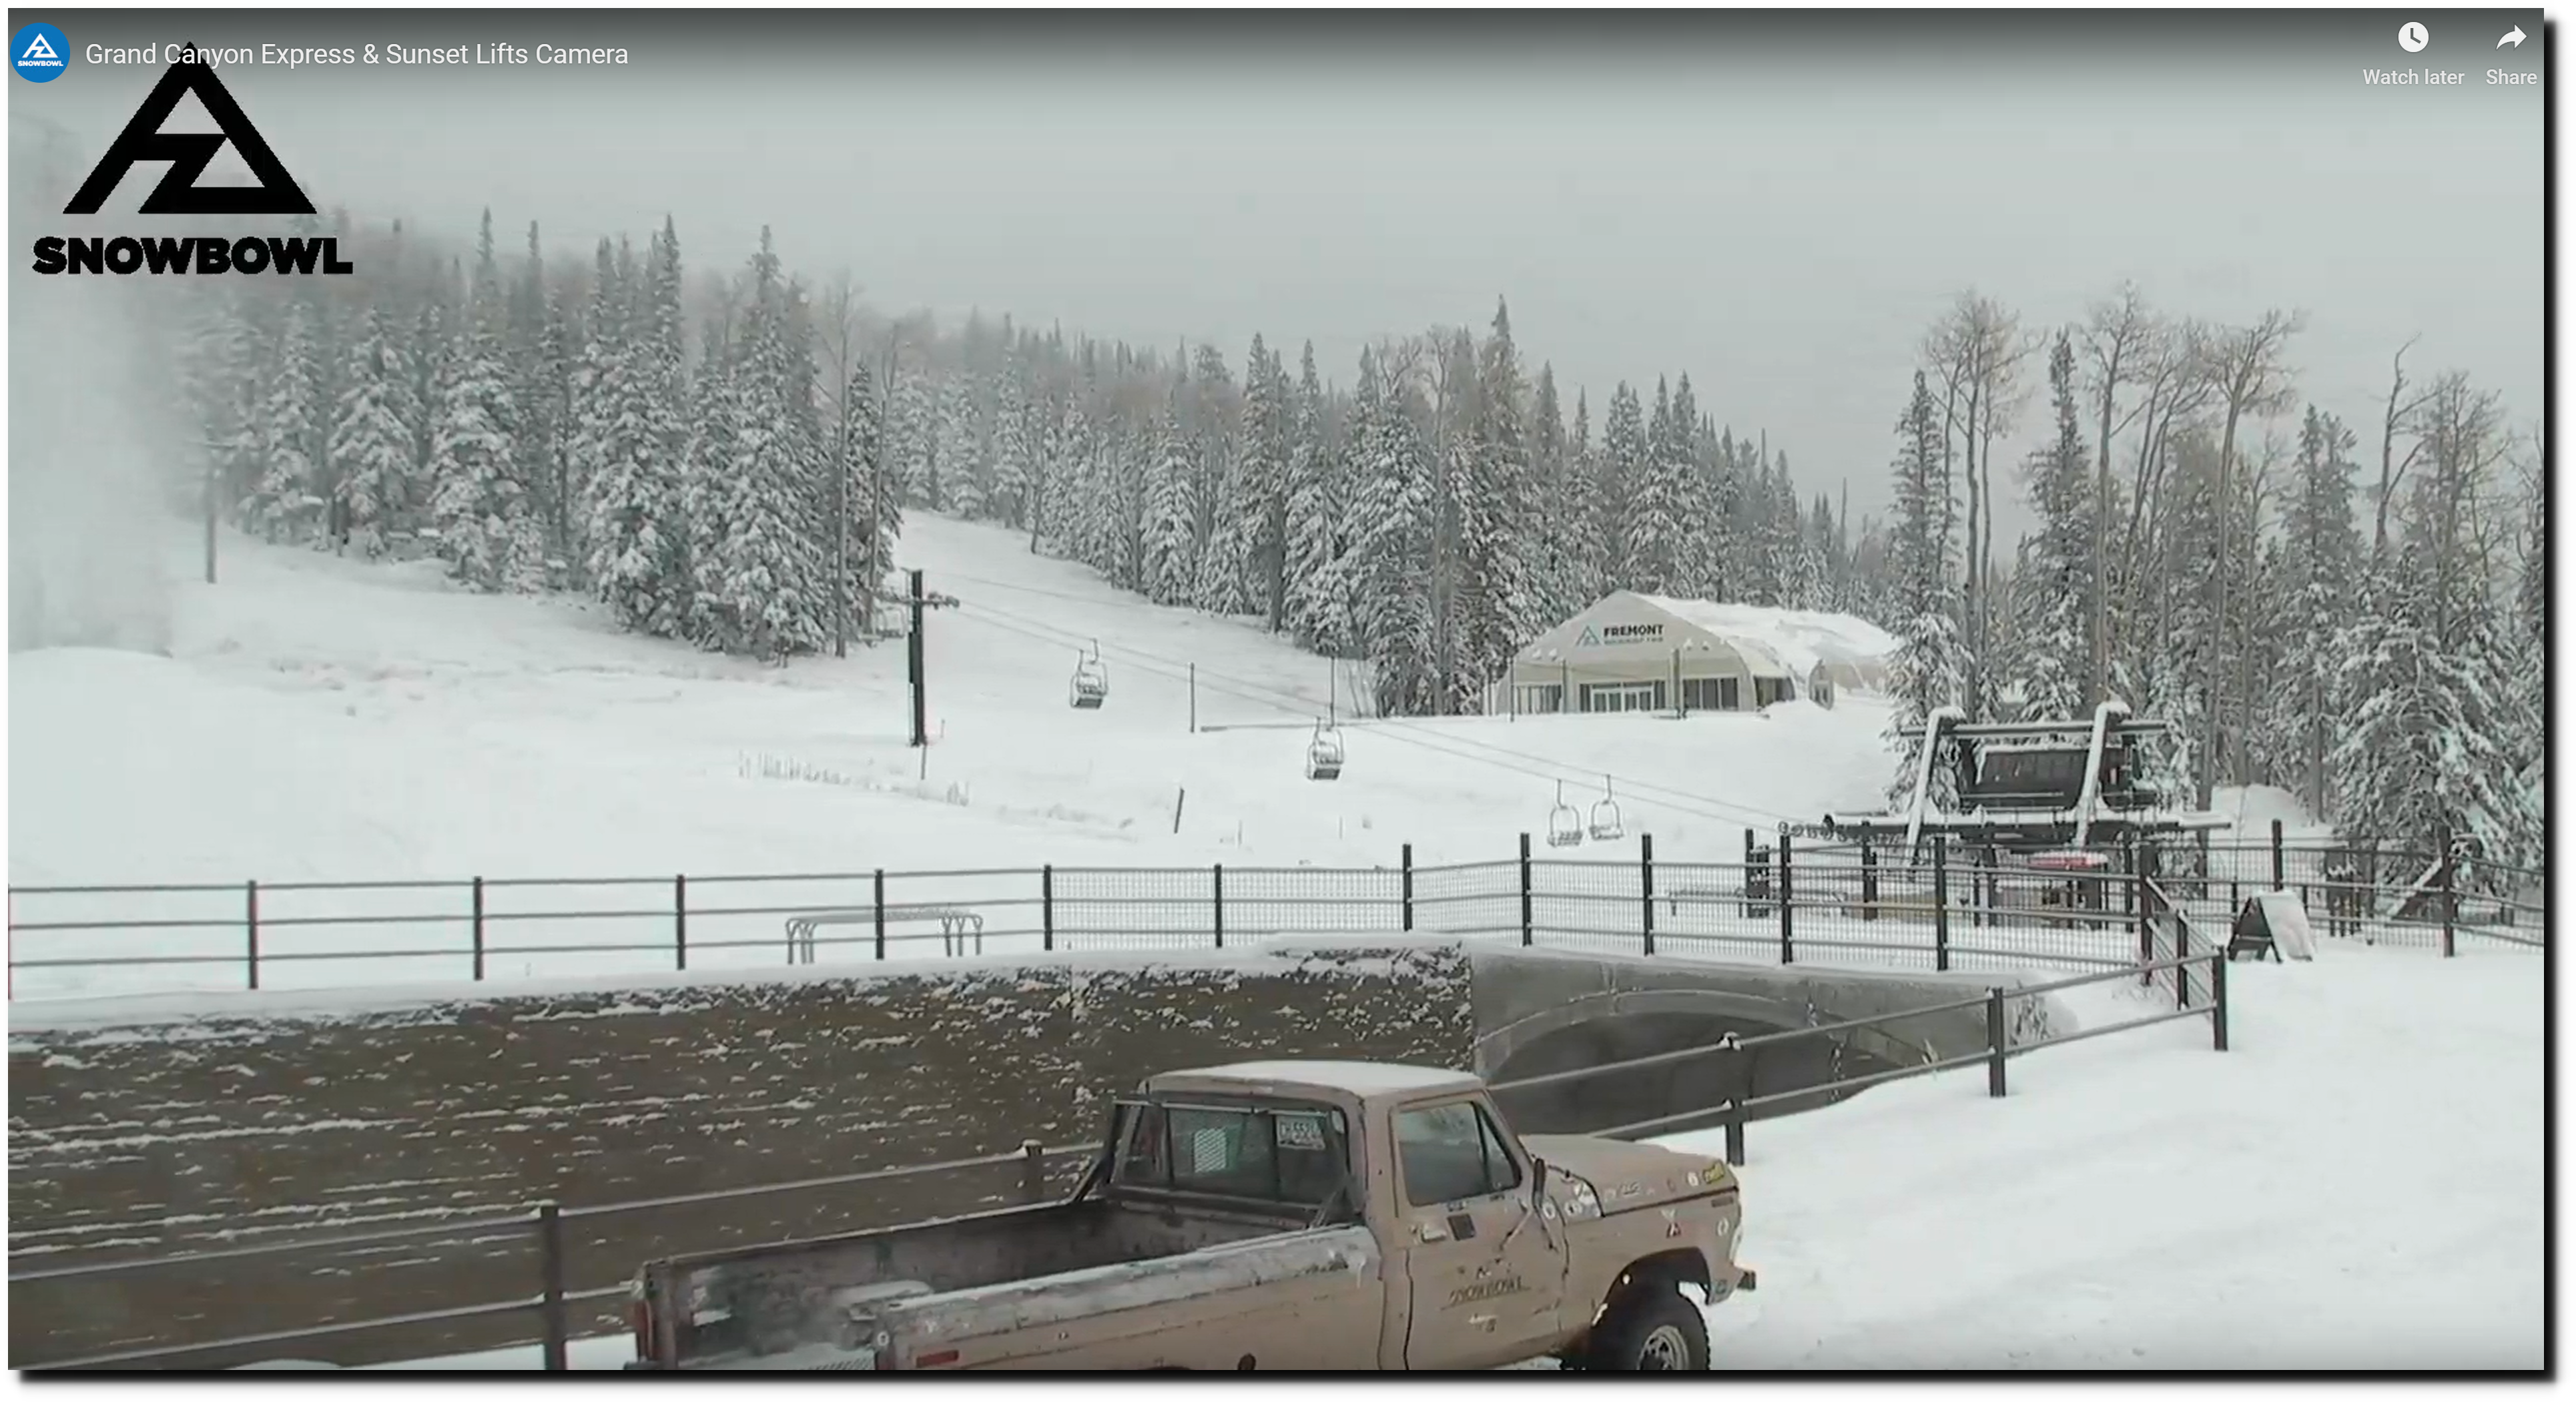
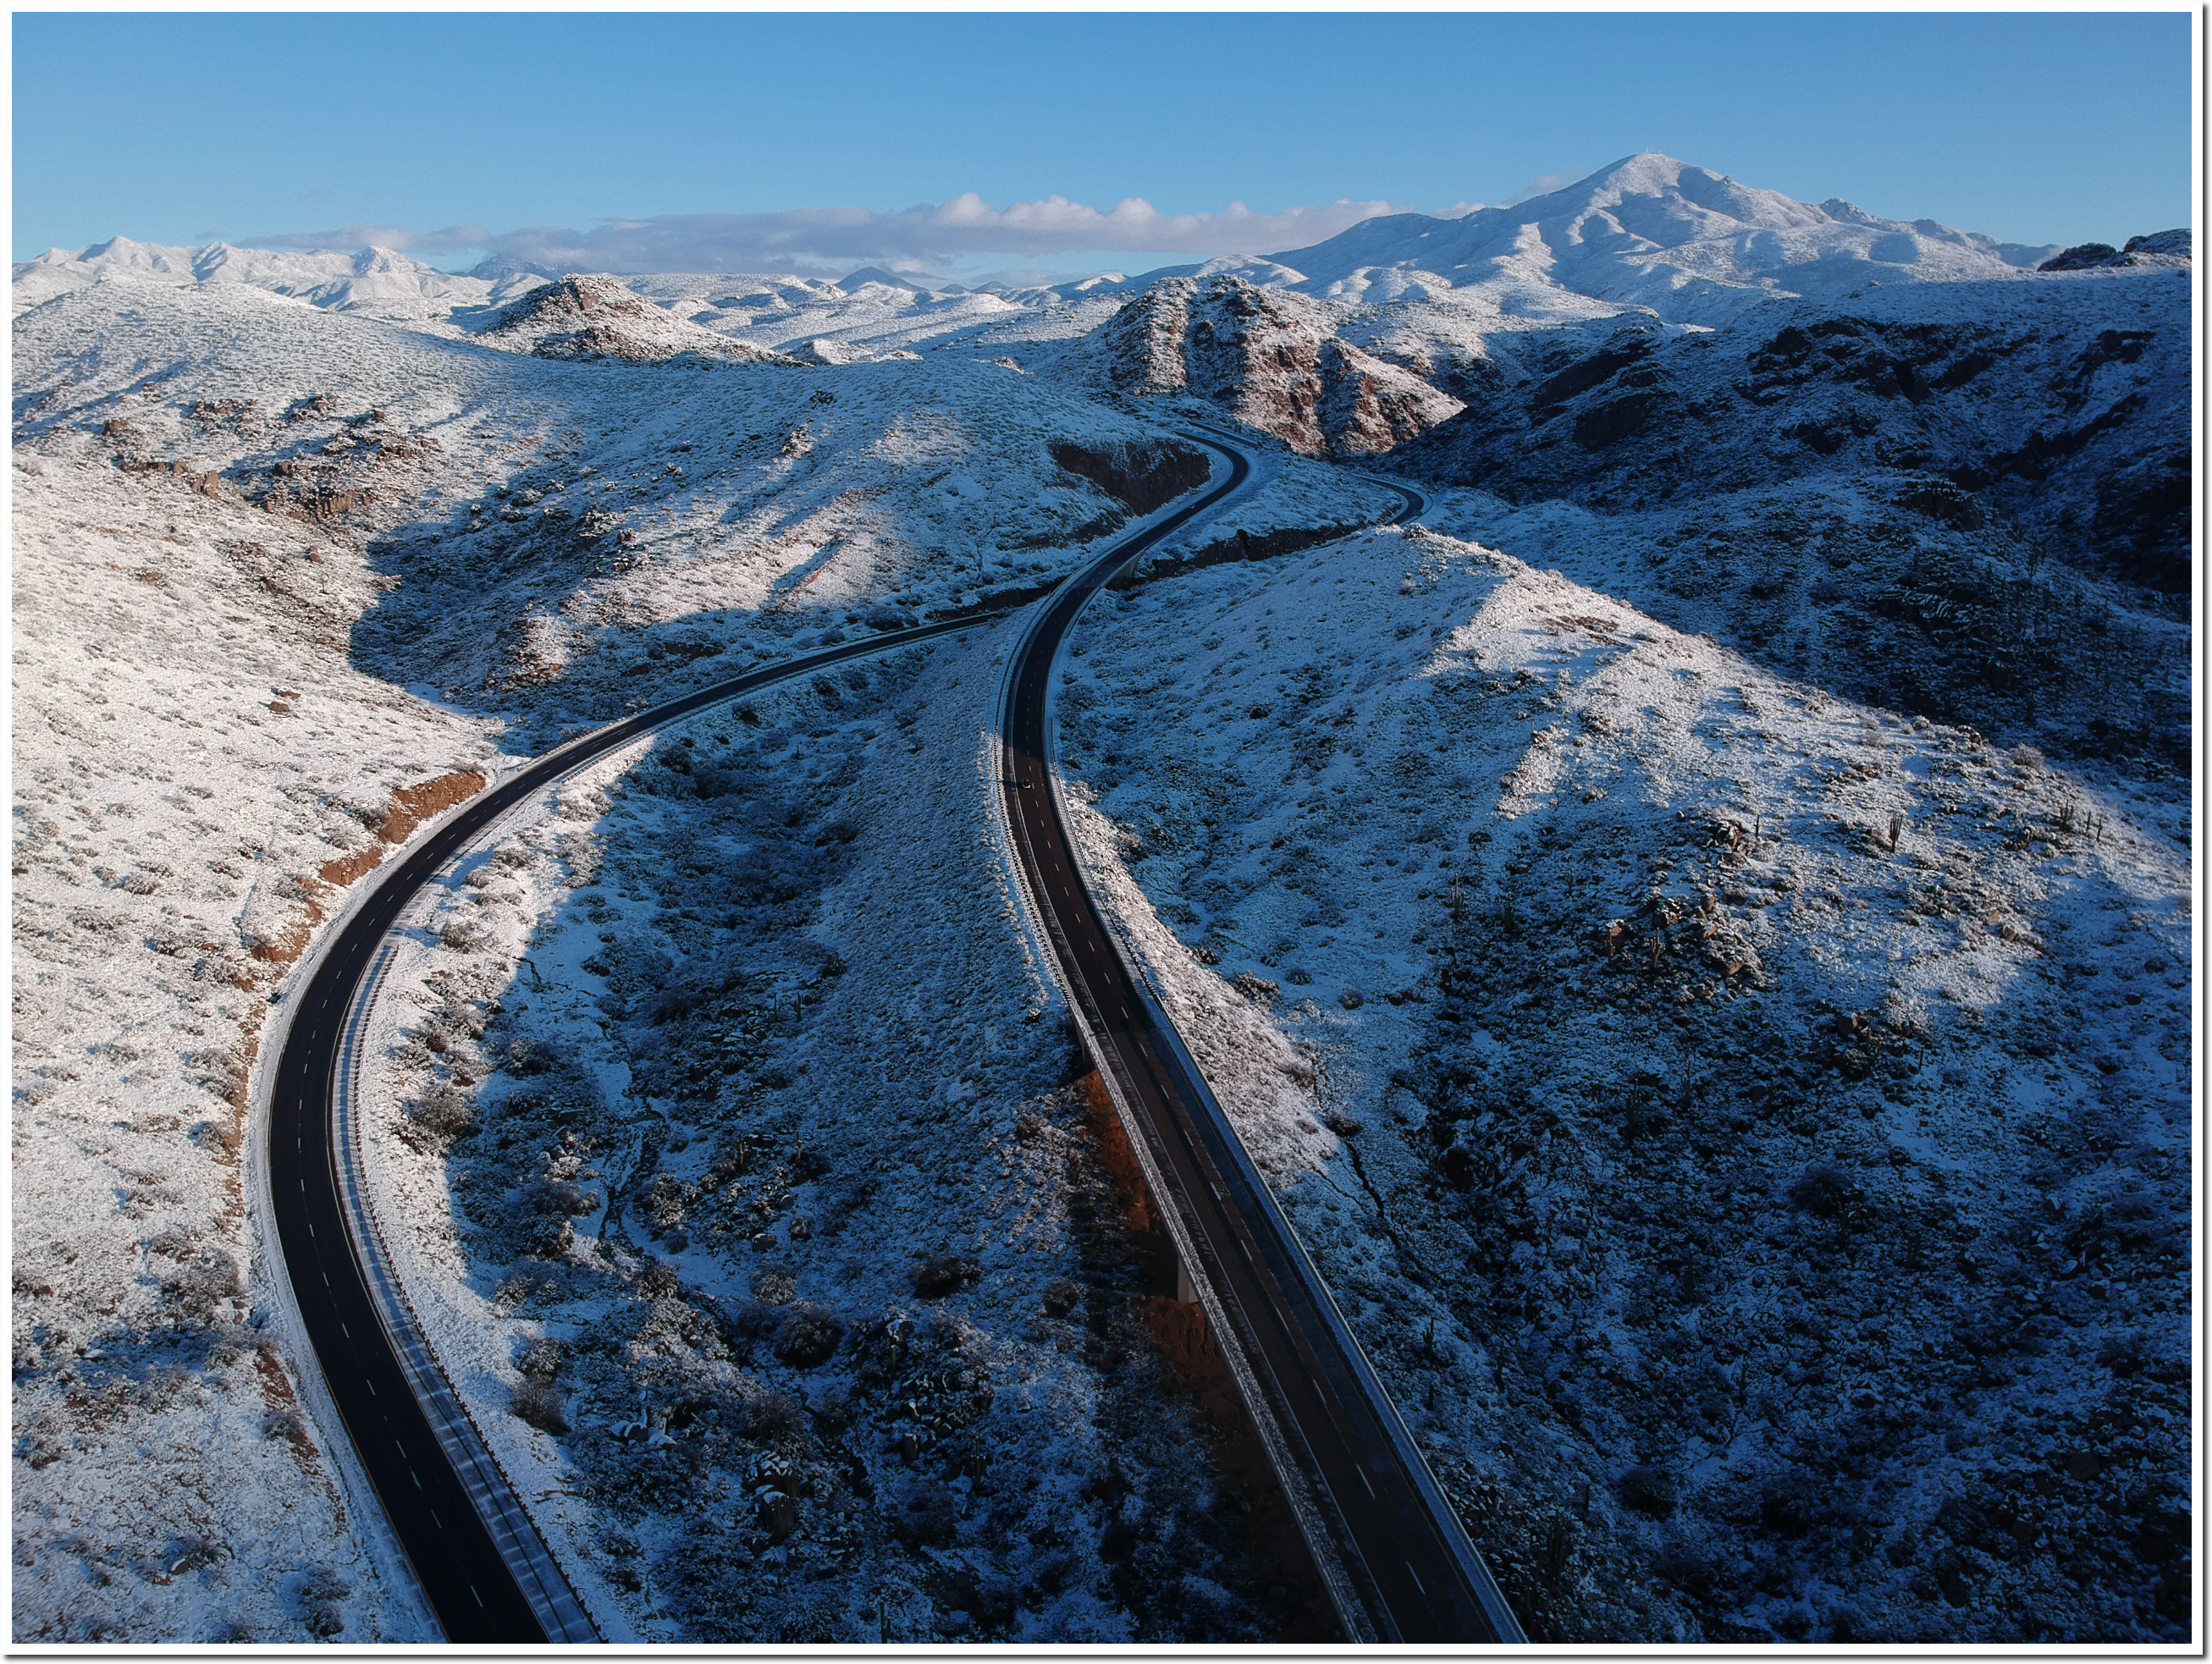
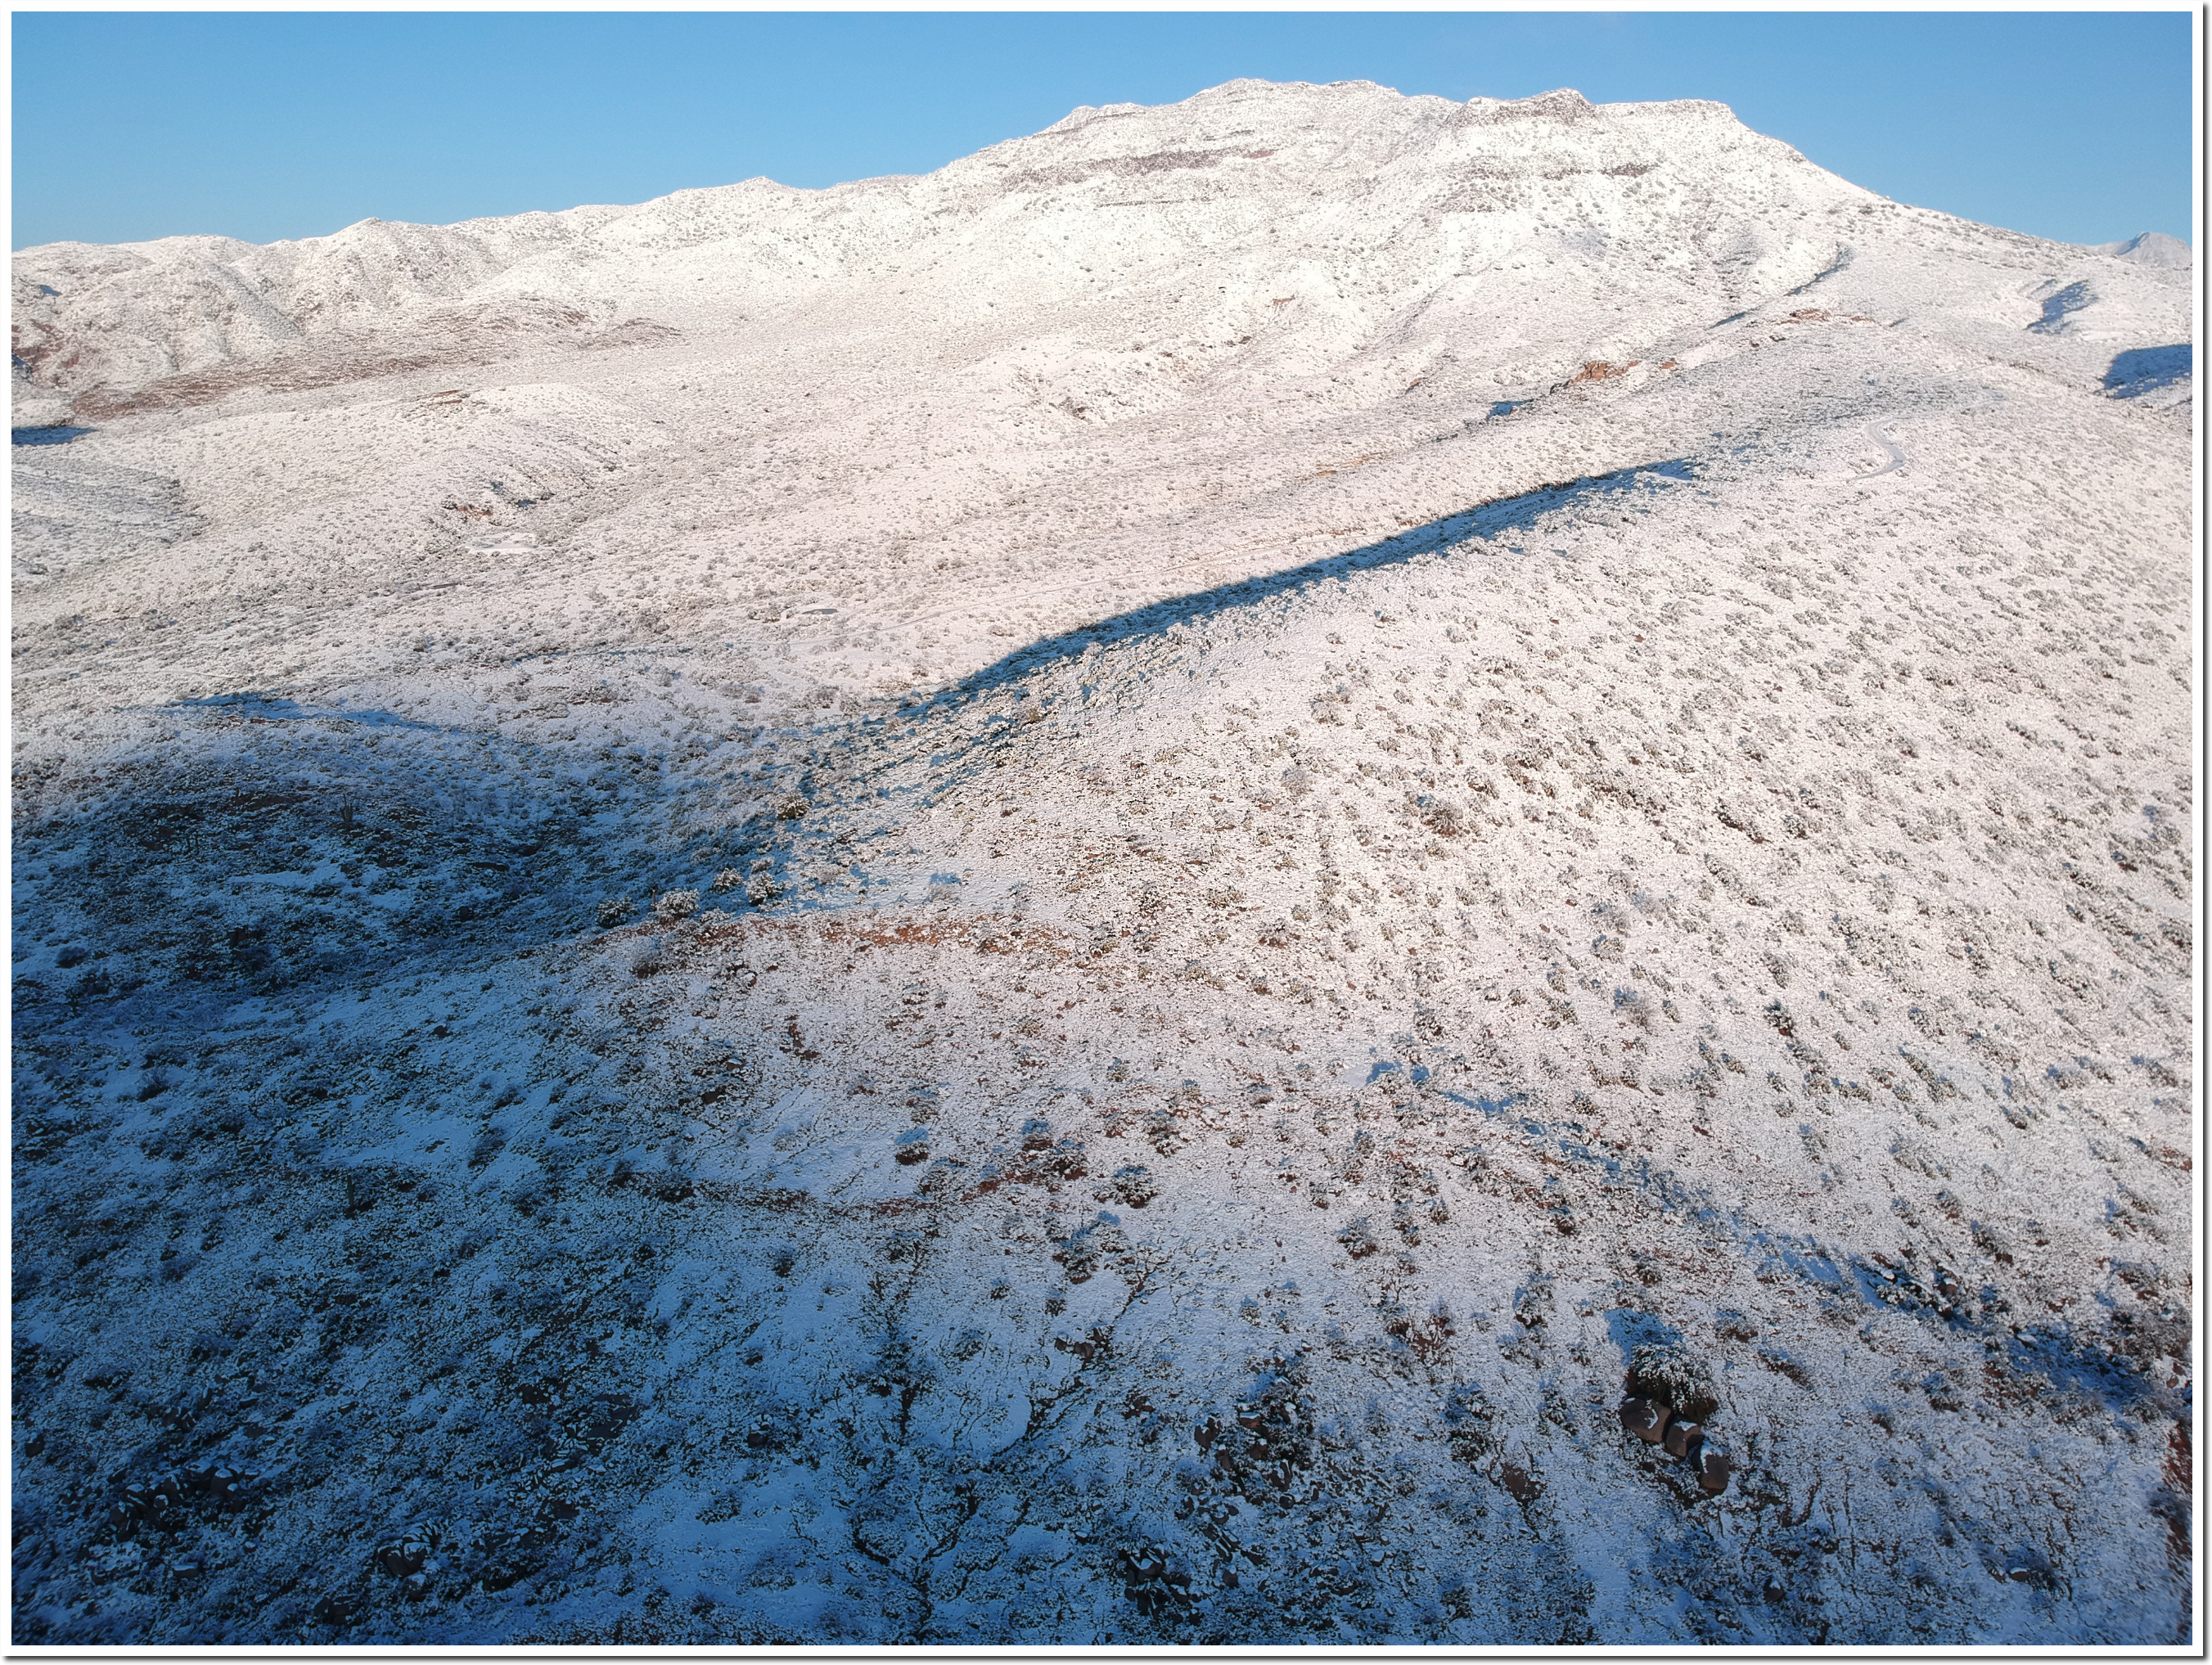
Arizona had their snowiest day on record earlier this year.
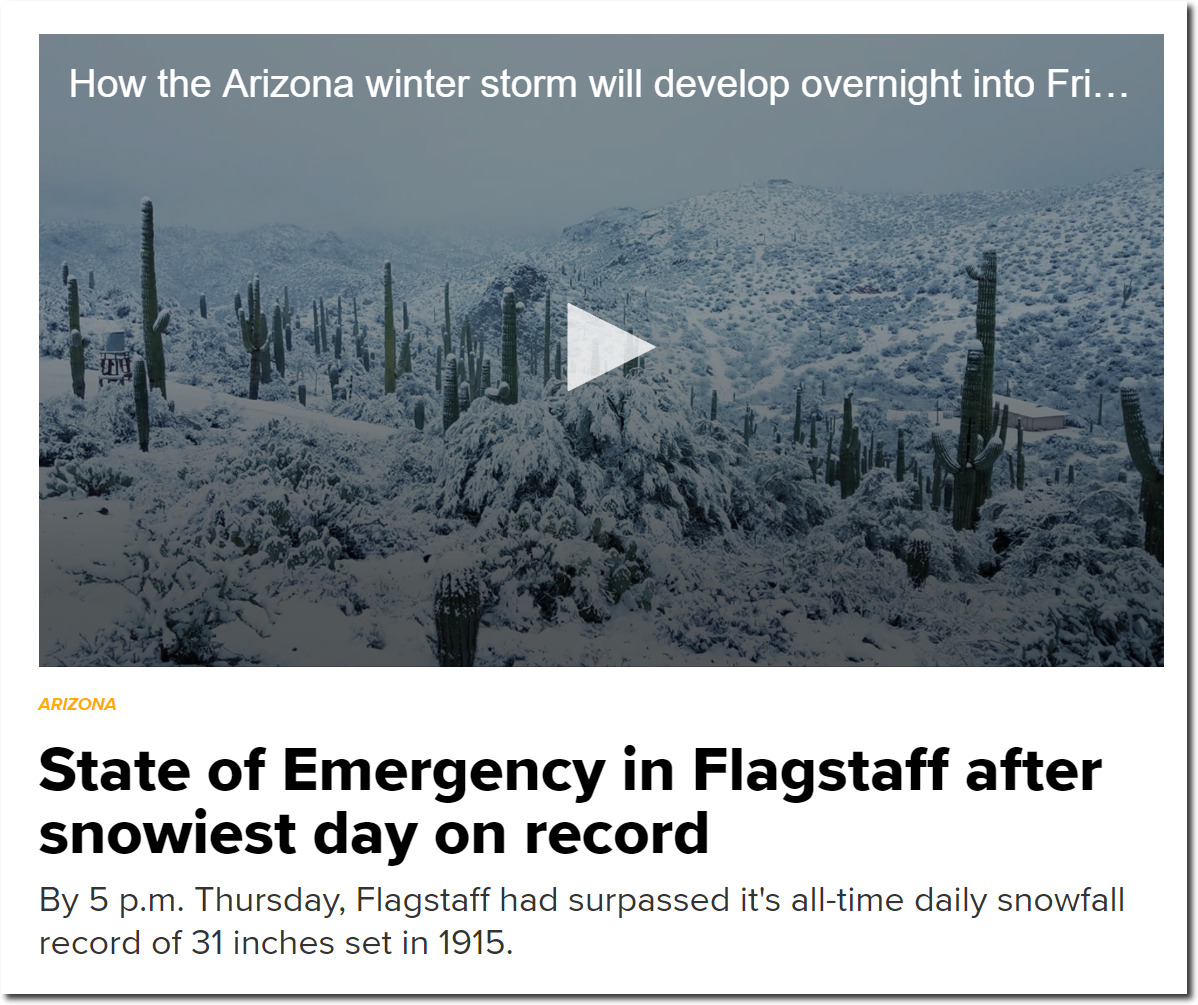
State of Emergency in Flagstaff after snowiest day on record | 12news.com
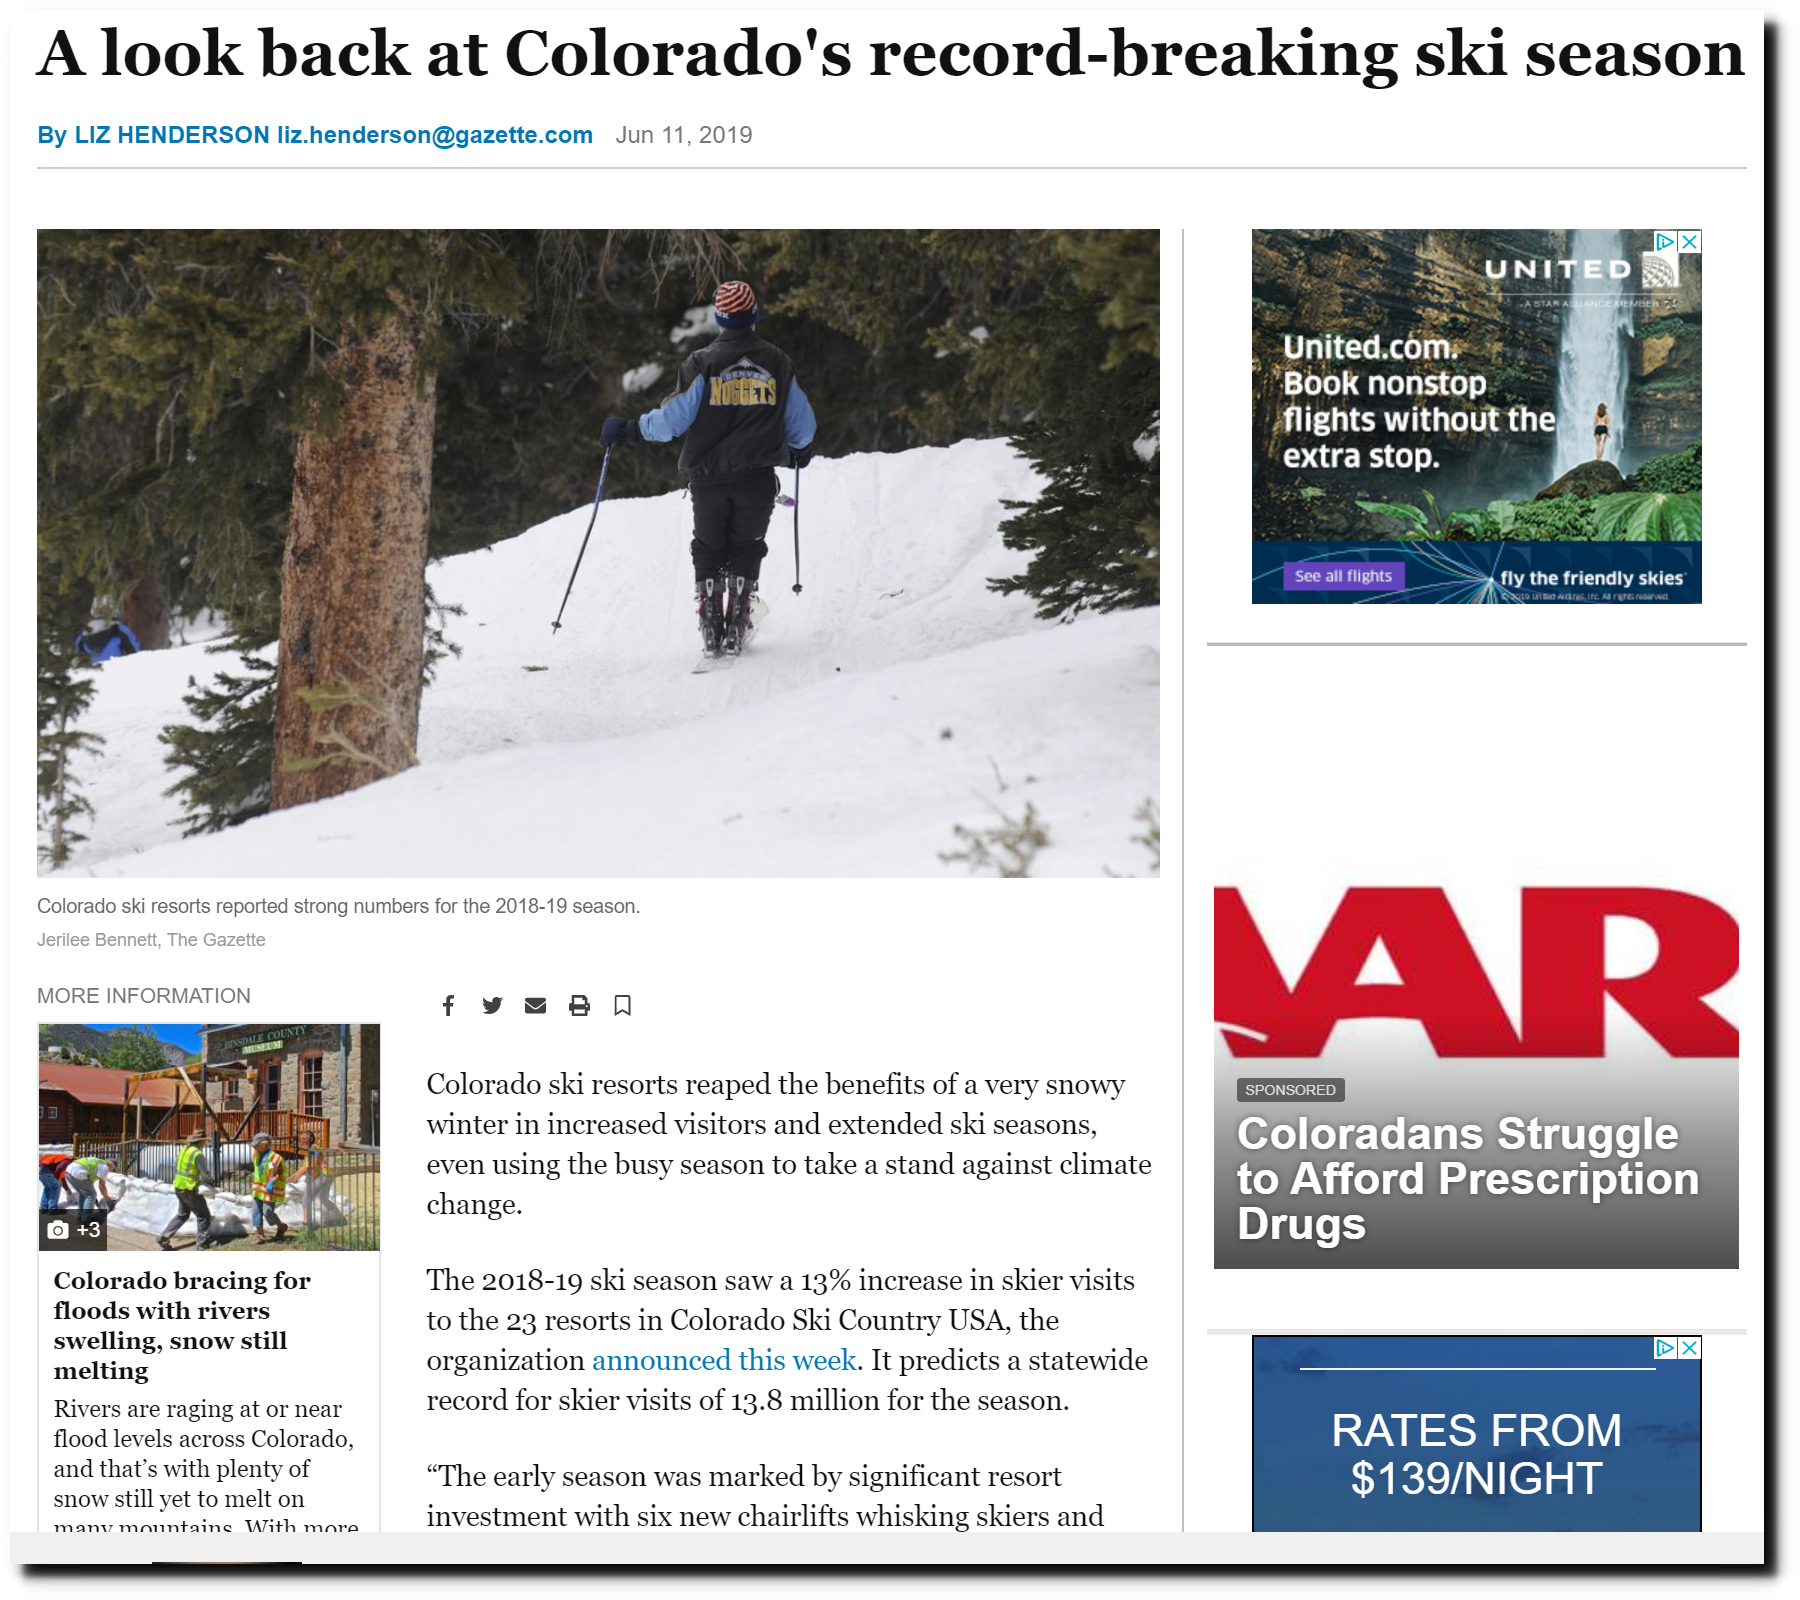
A look back at Colorado’s record-breaking ski season | Colorado Springs News | gazette.com
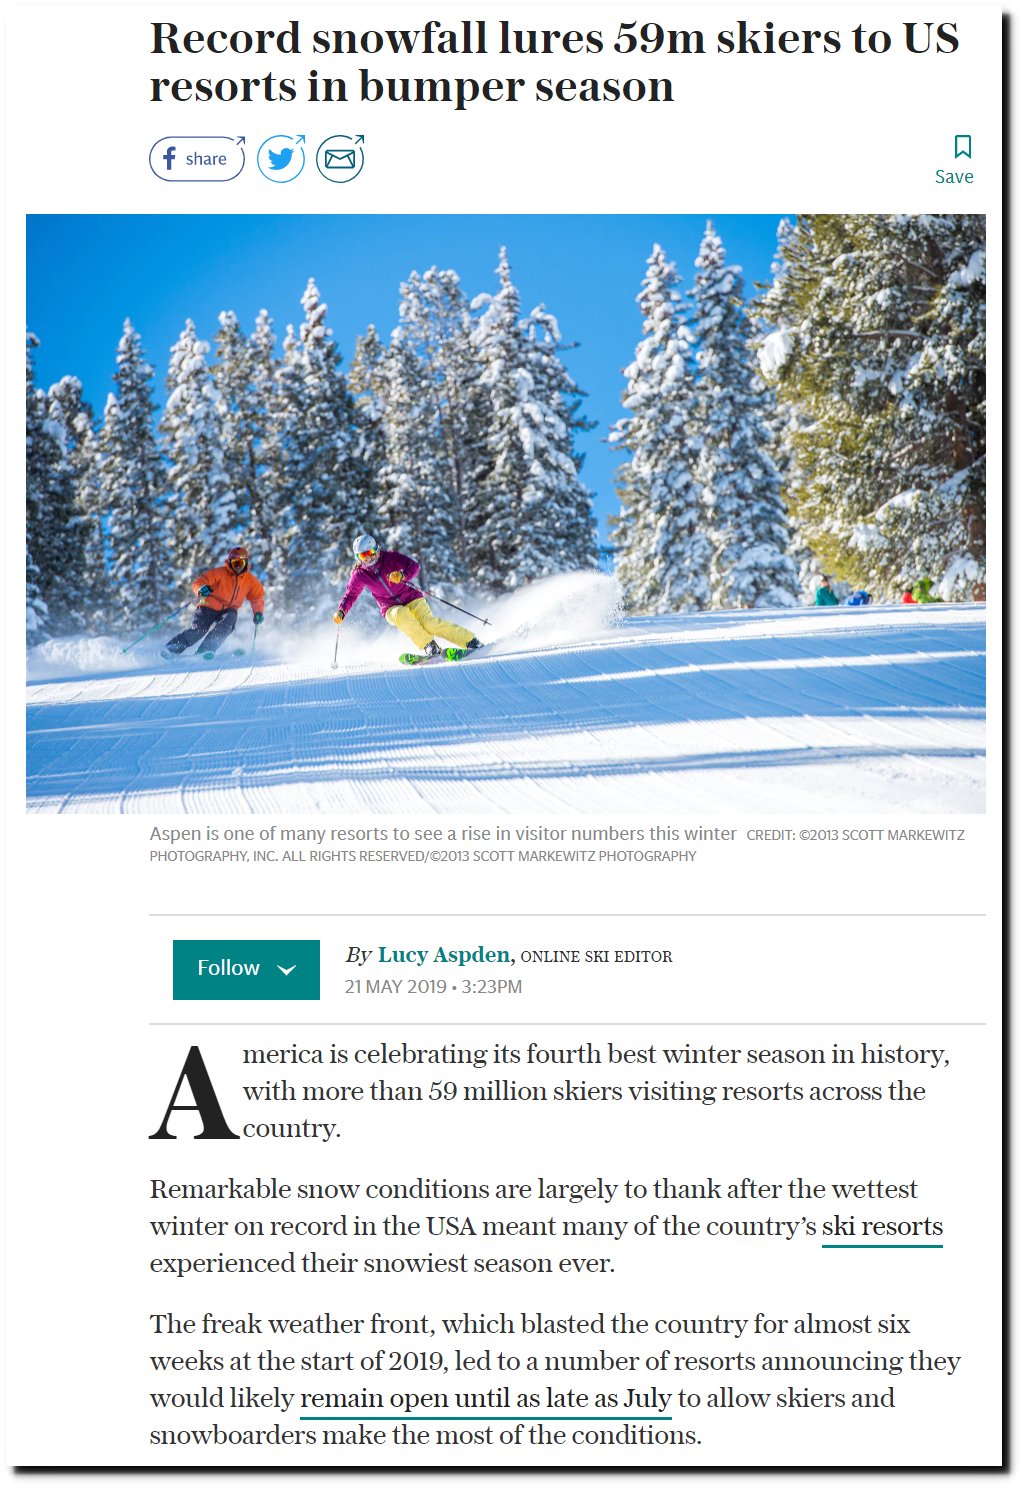
Record snowfall lures 59m skiers to US resorts in bumper season
Arizona had their longest ski season on record.
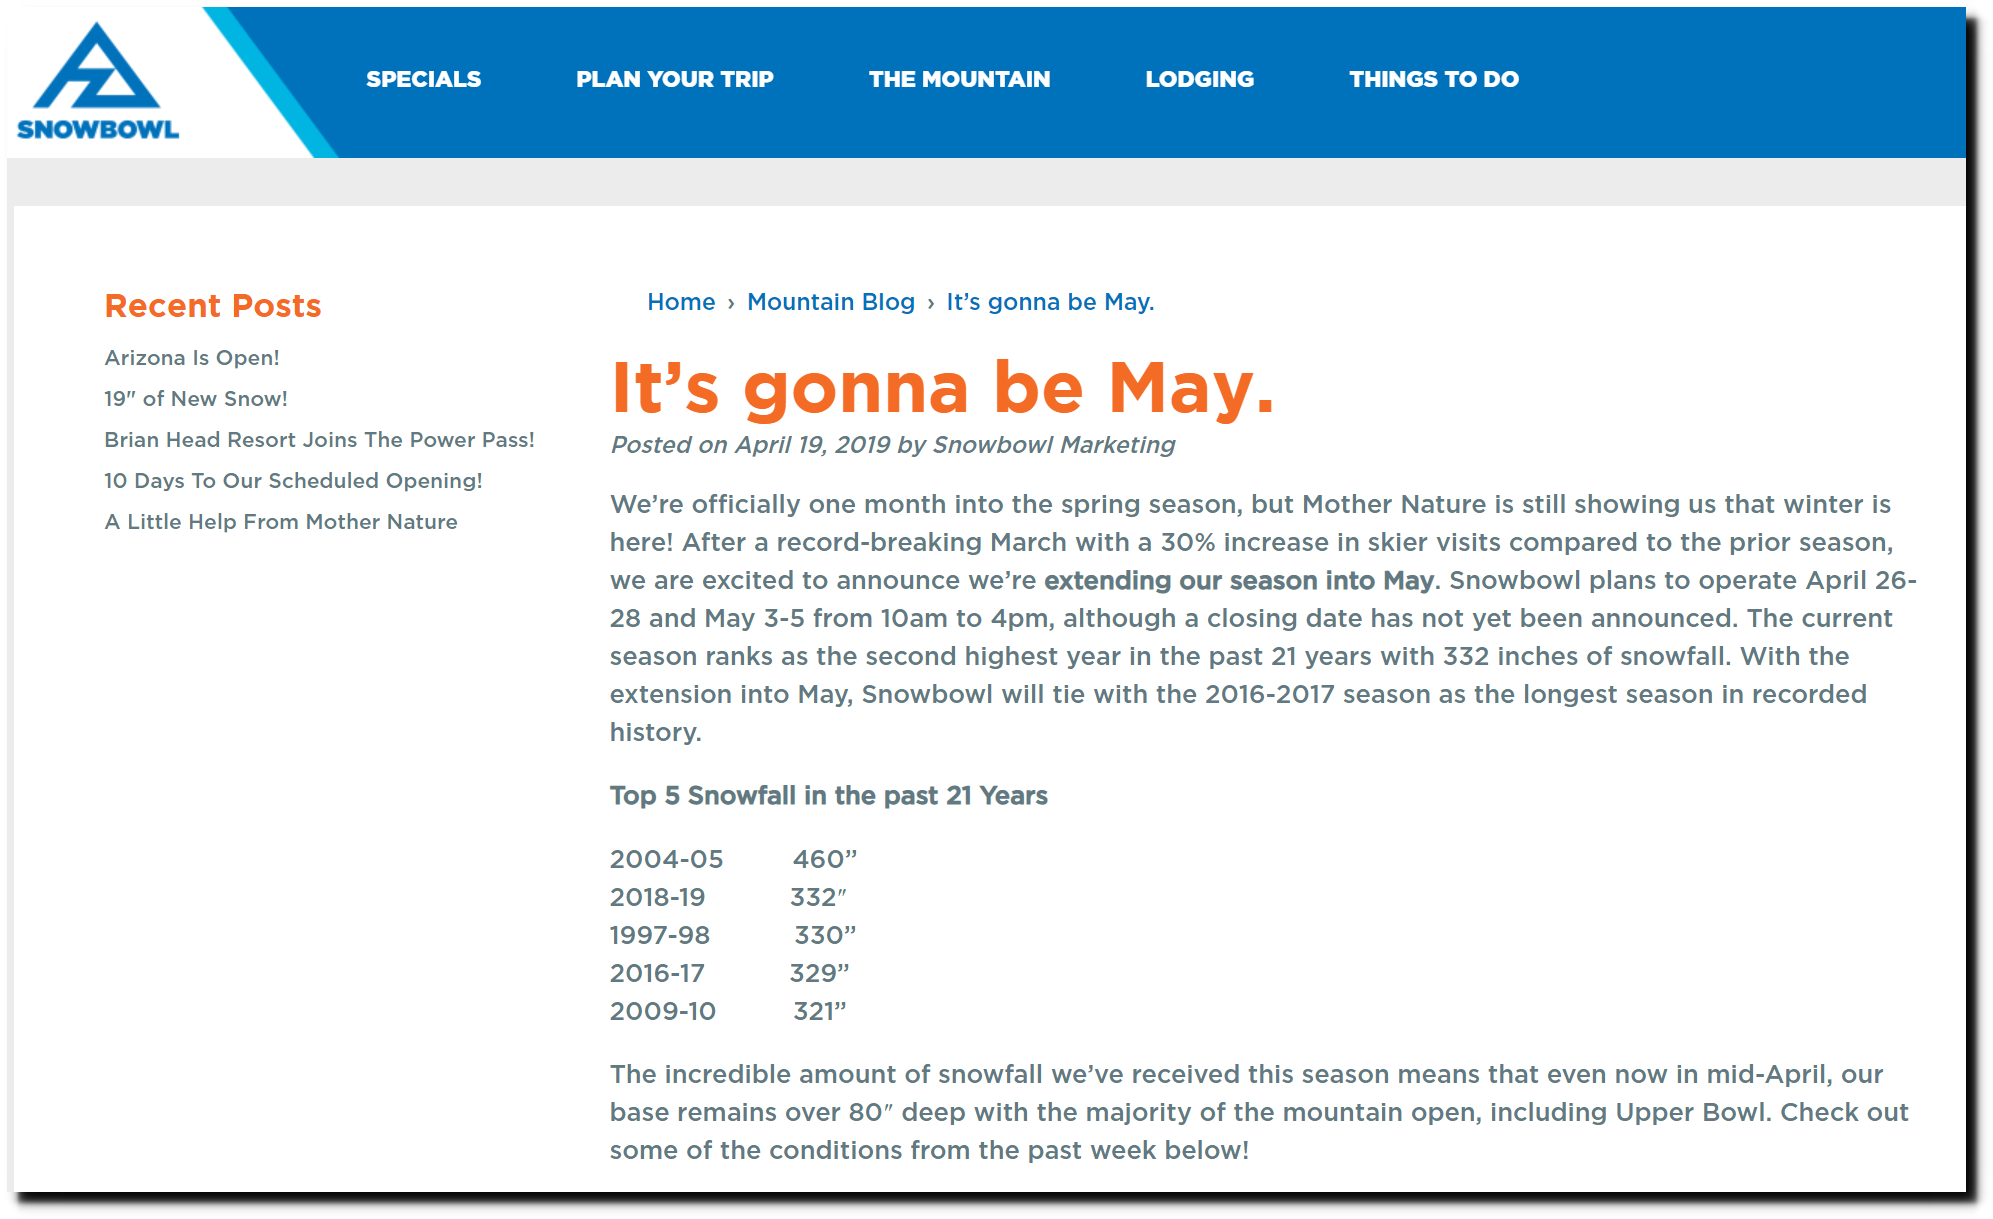
It’s gonna be May. – Arizona Snowbowl
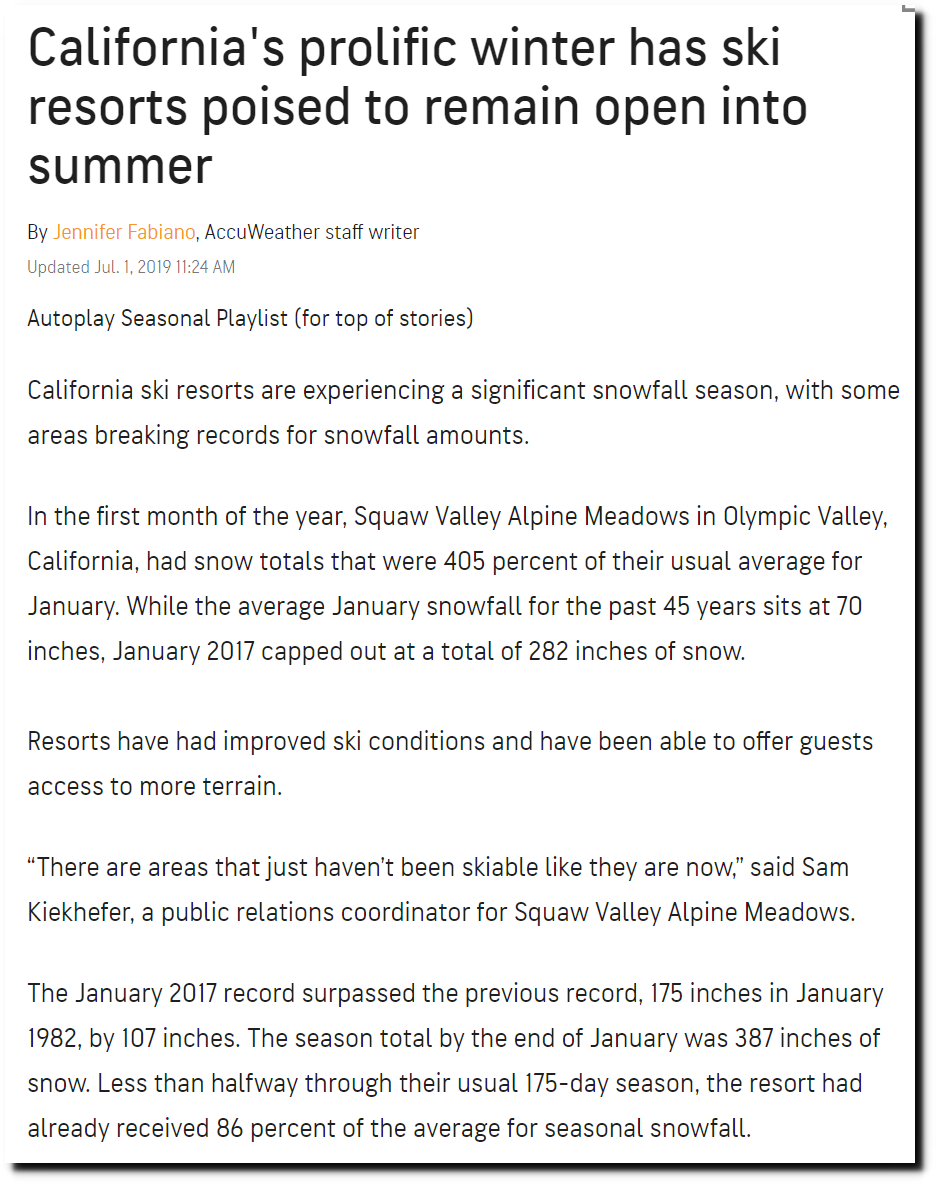
2017 also brought record skiing to California.
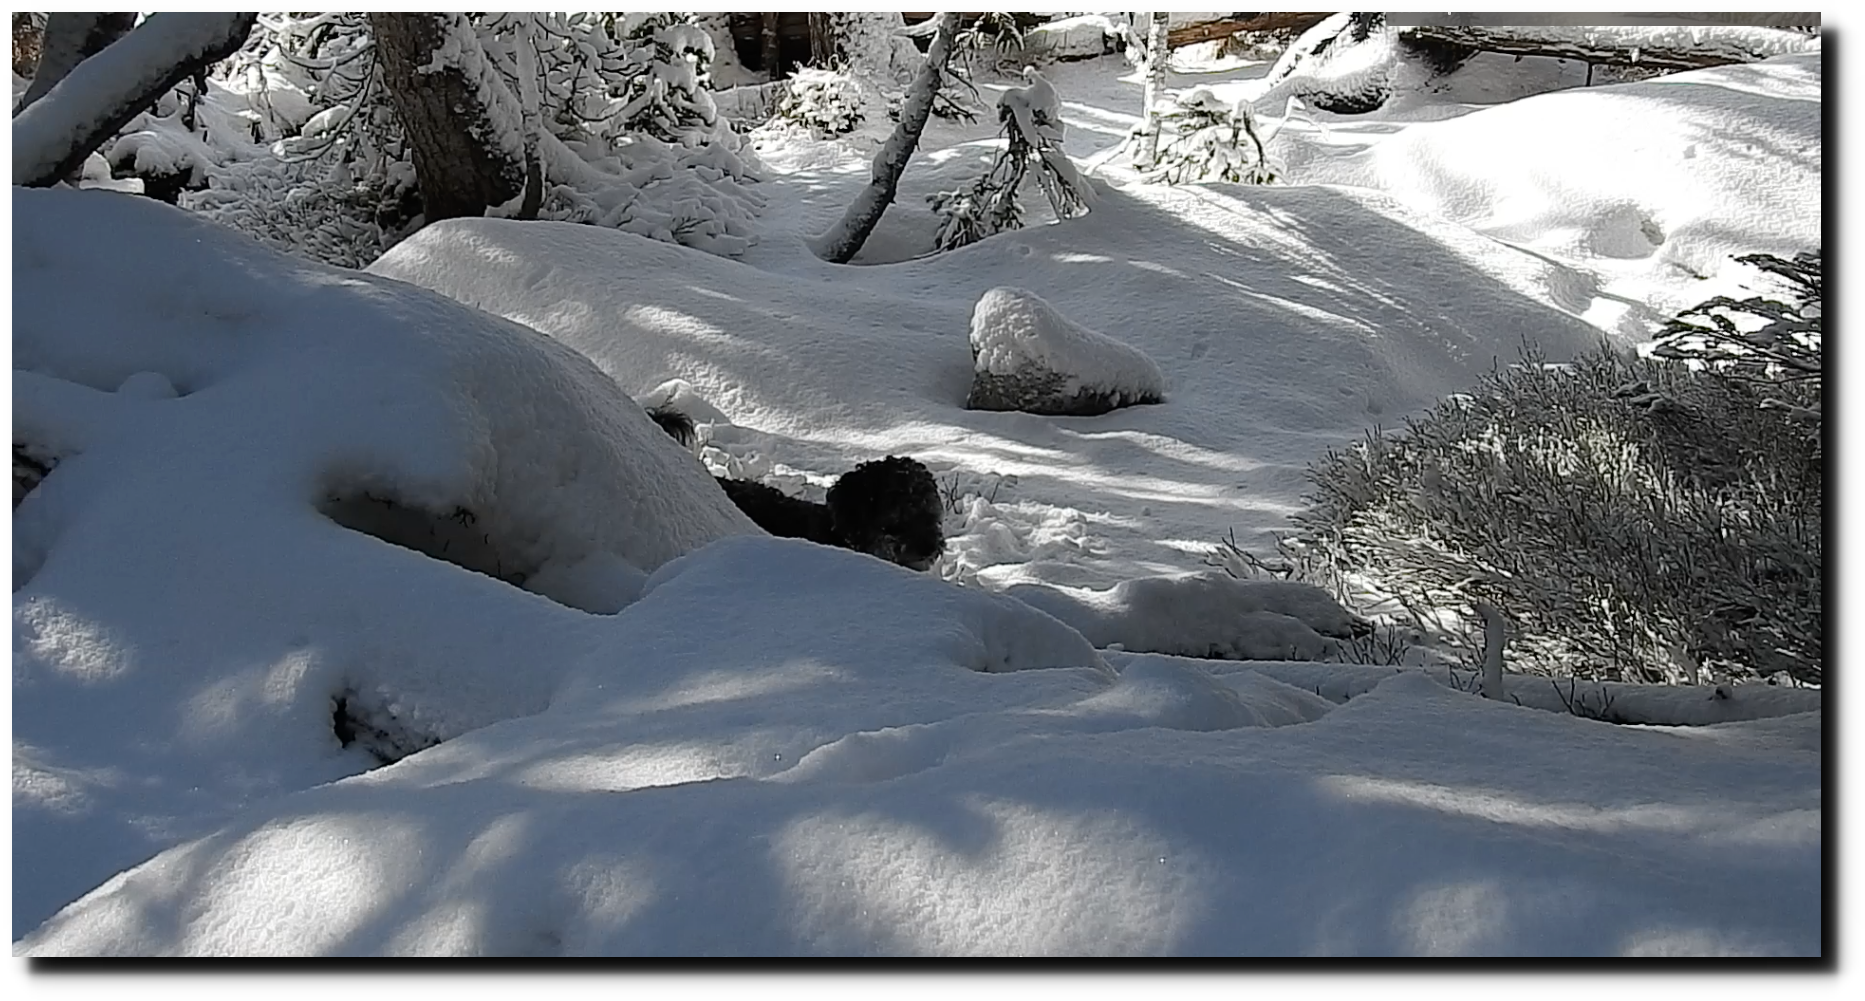
I took these pictures on the first day of summer this year west of Boulder.
We had record snow in October, after a very short summer.

4 feet of snow sets record at Breckenridge Ski Resort | OutThere Colorado
Yesterday may have been the snowiest day on record in Boulder. It might be days before I can get to the store. Cycling looks hopeless for the indefinite future.
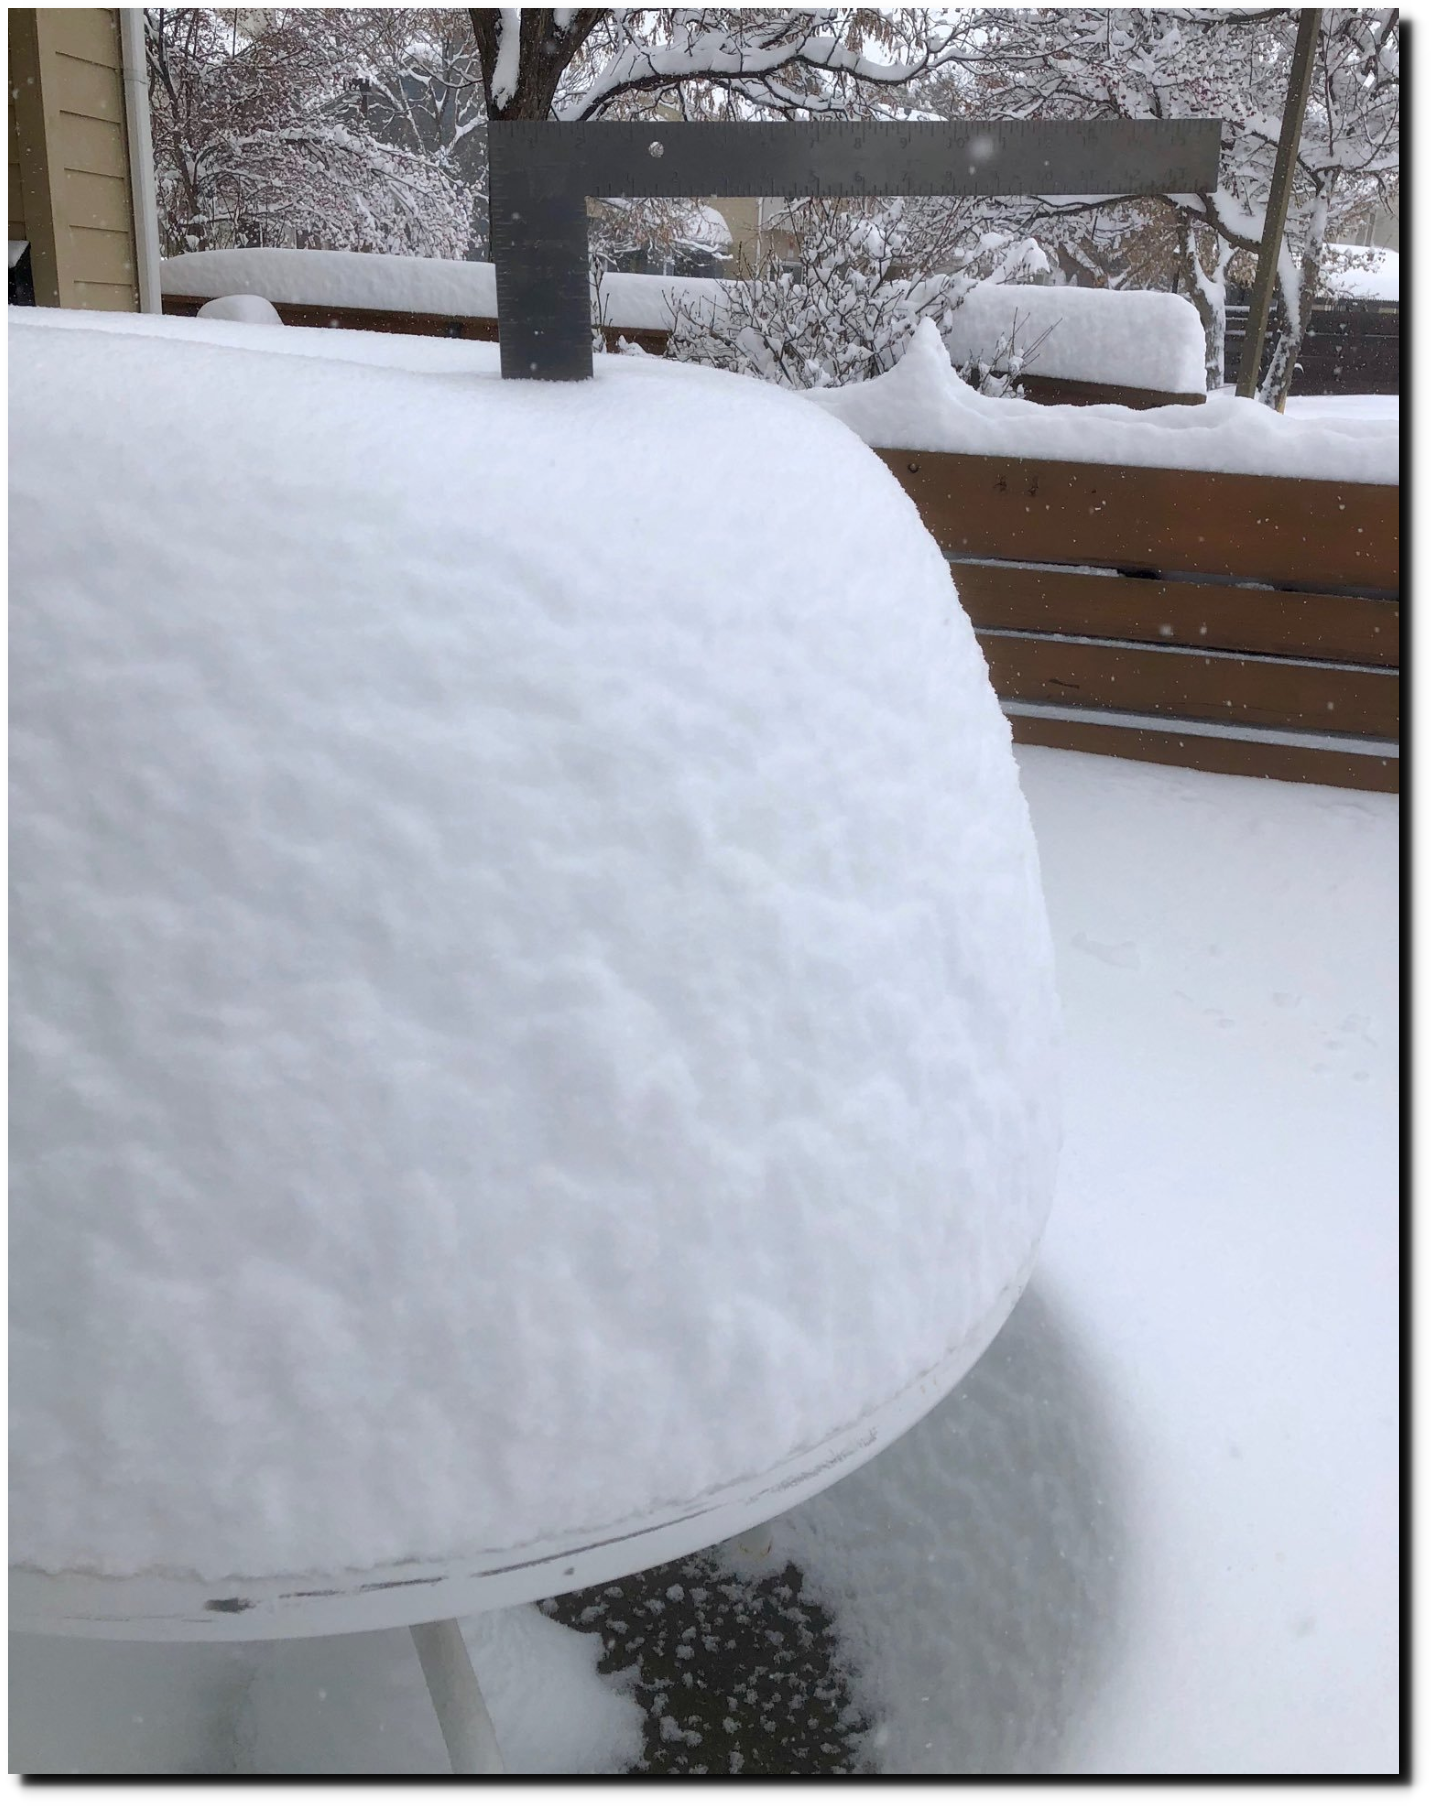
After their longest ski season on record, Arizona is having record early season skiing.

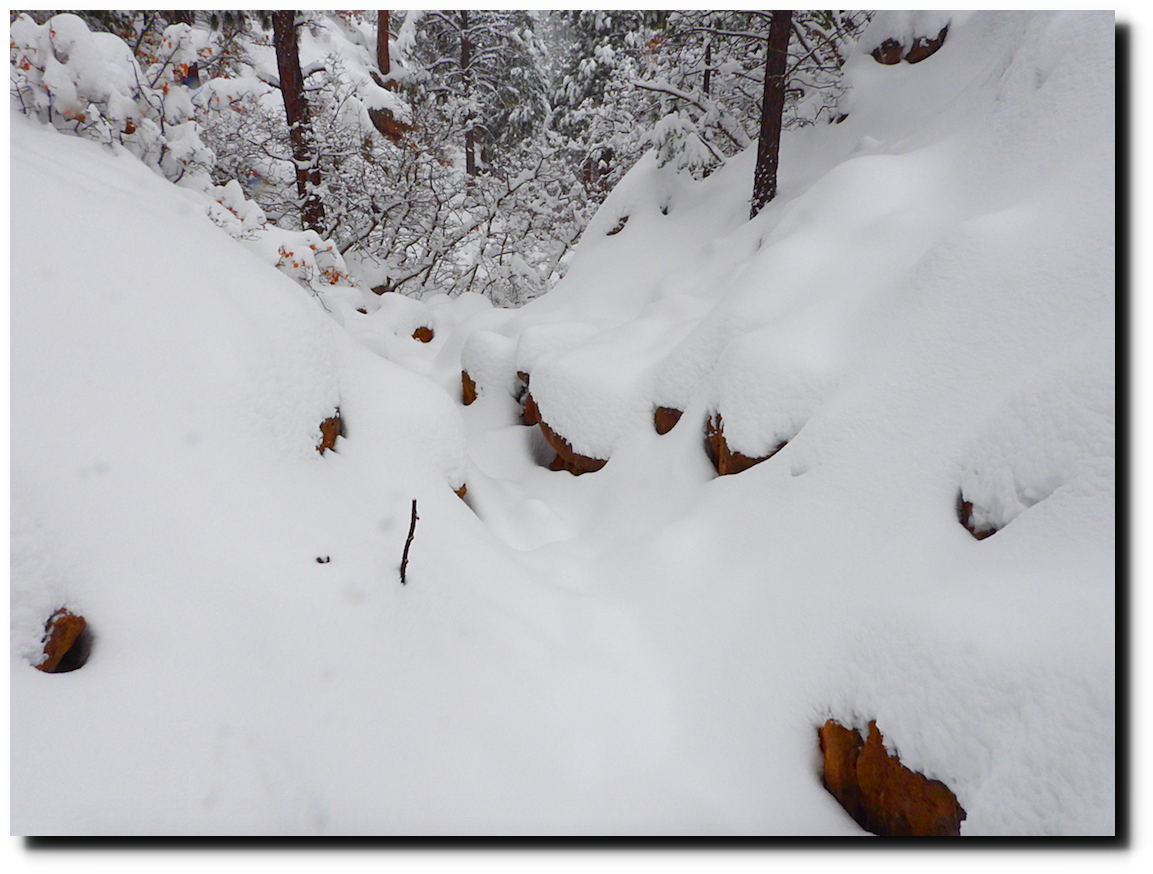
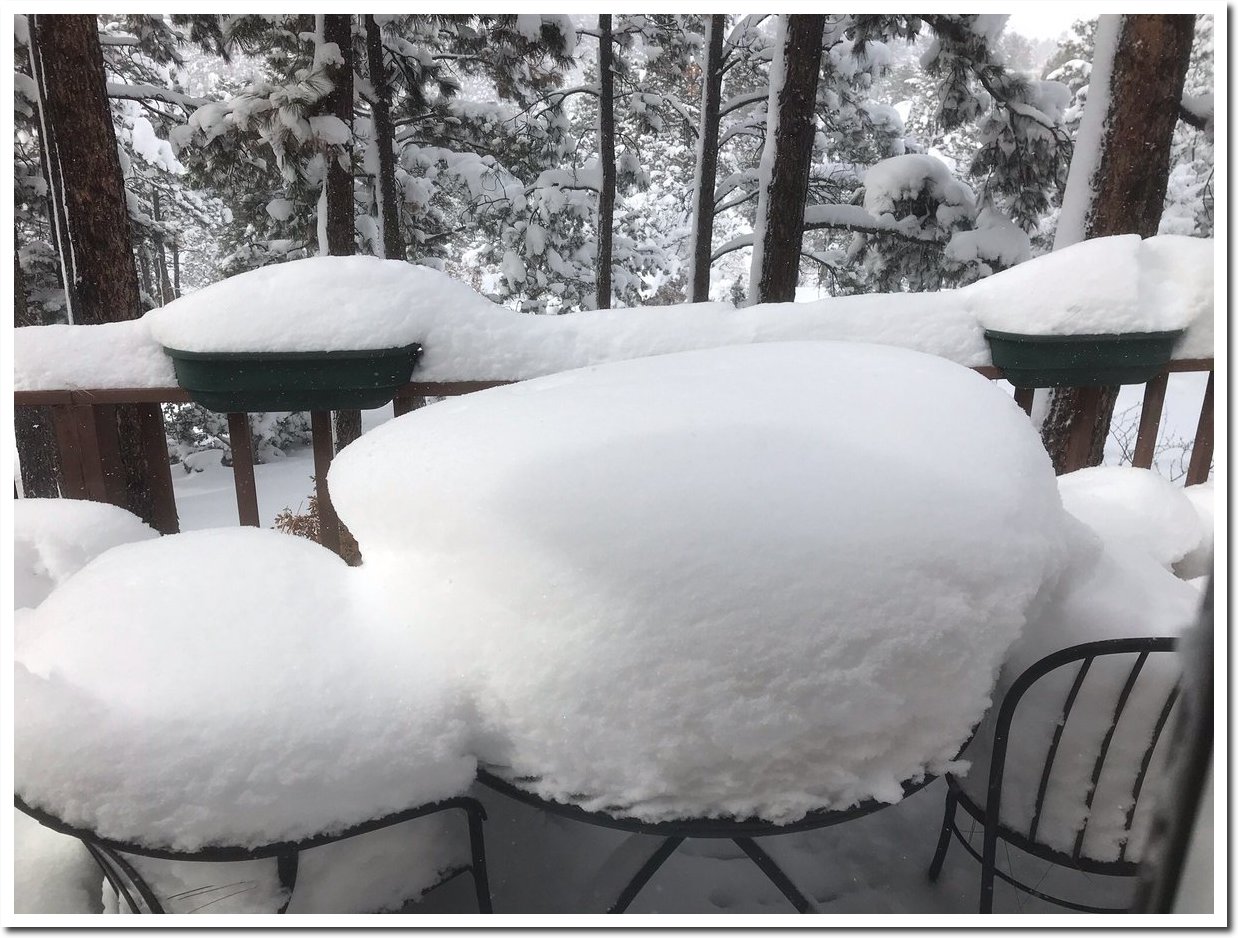
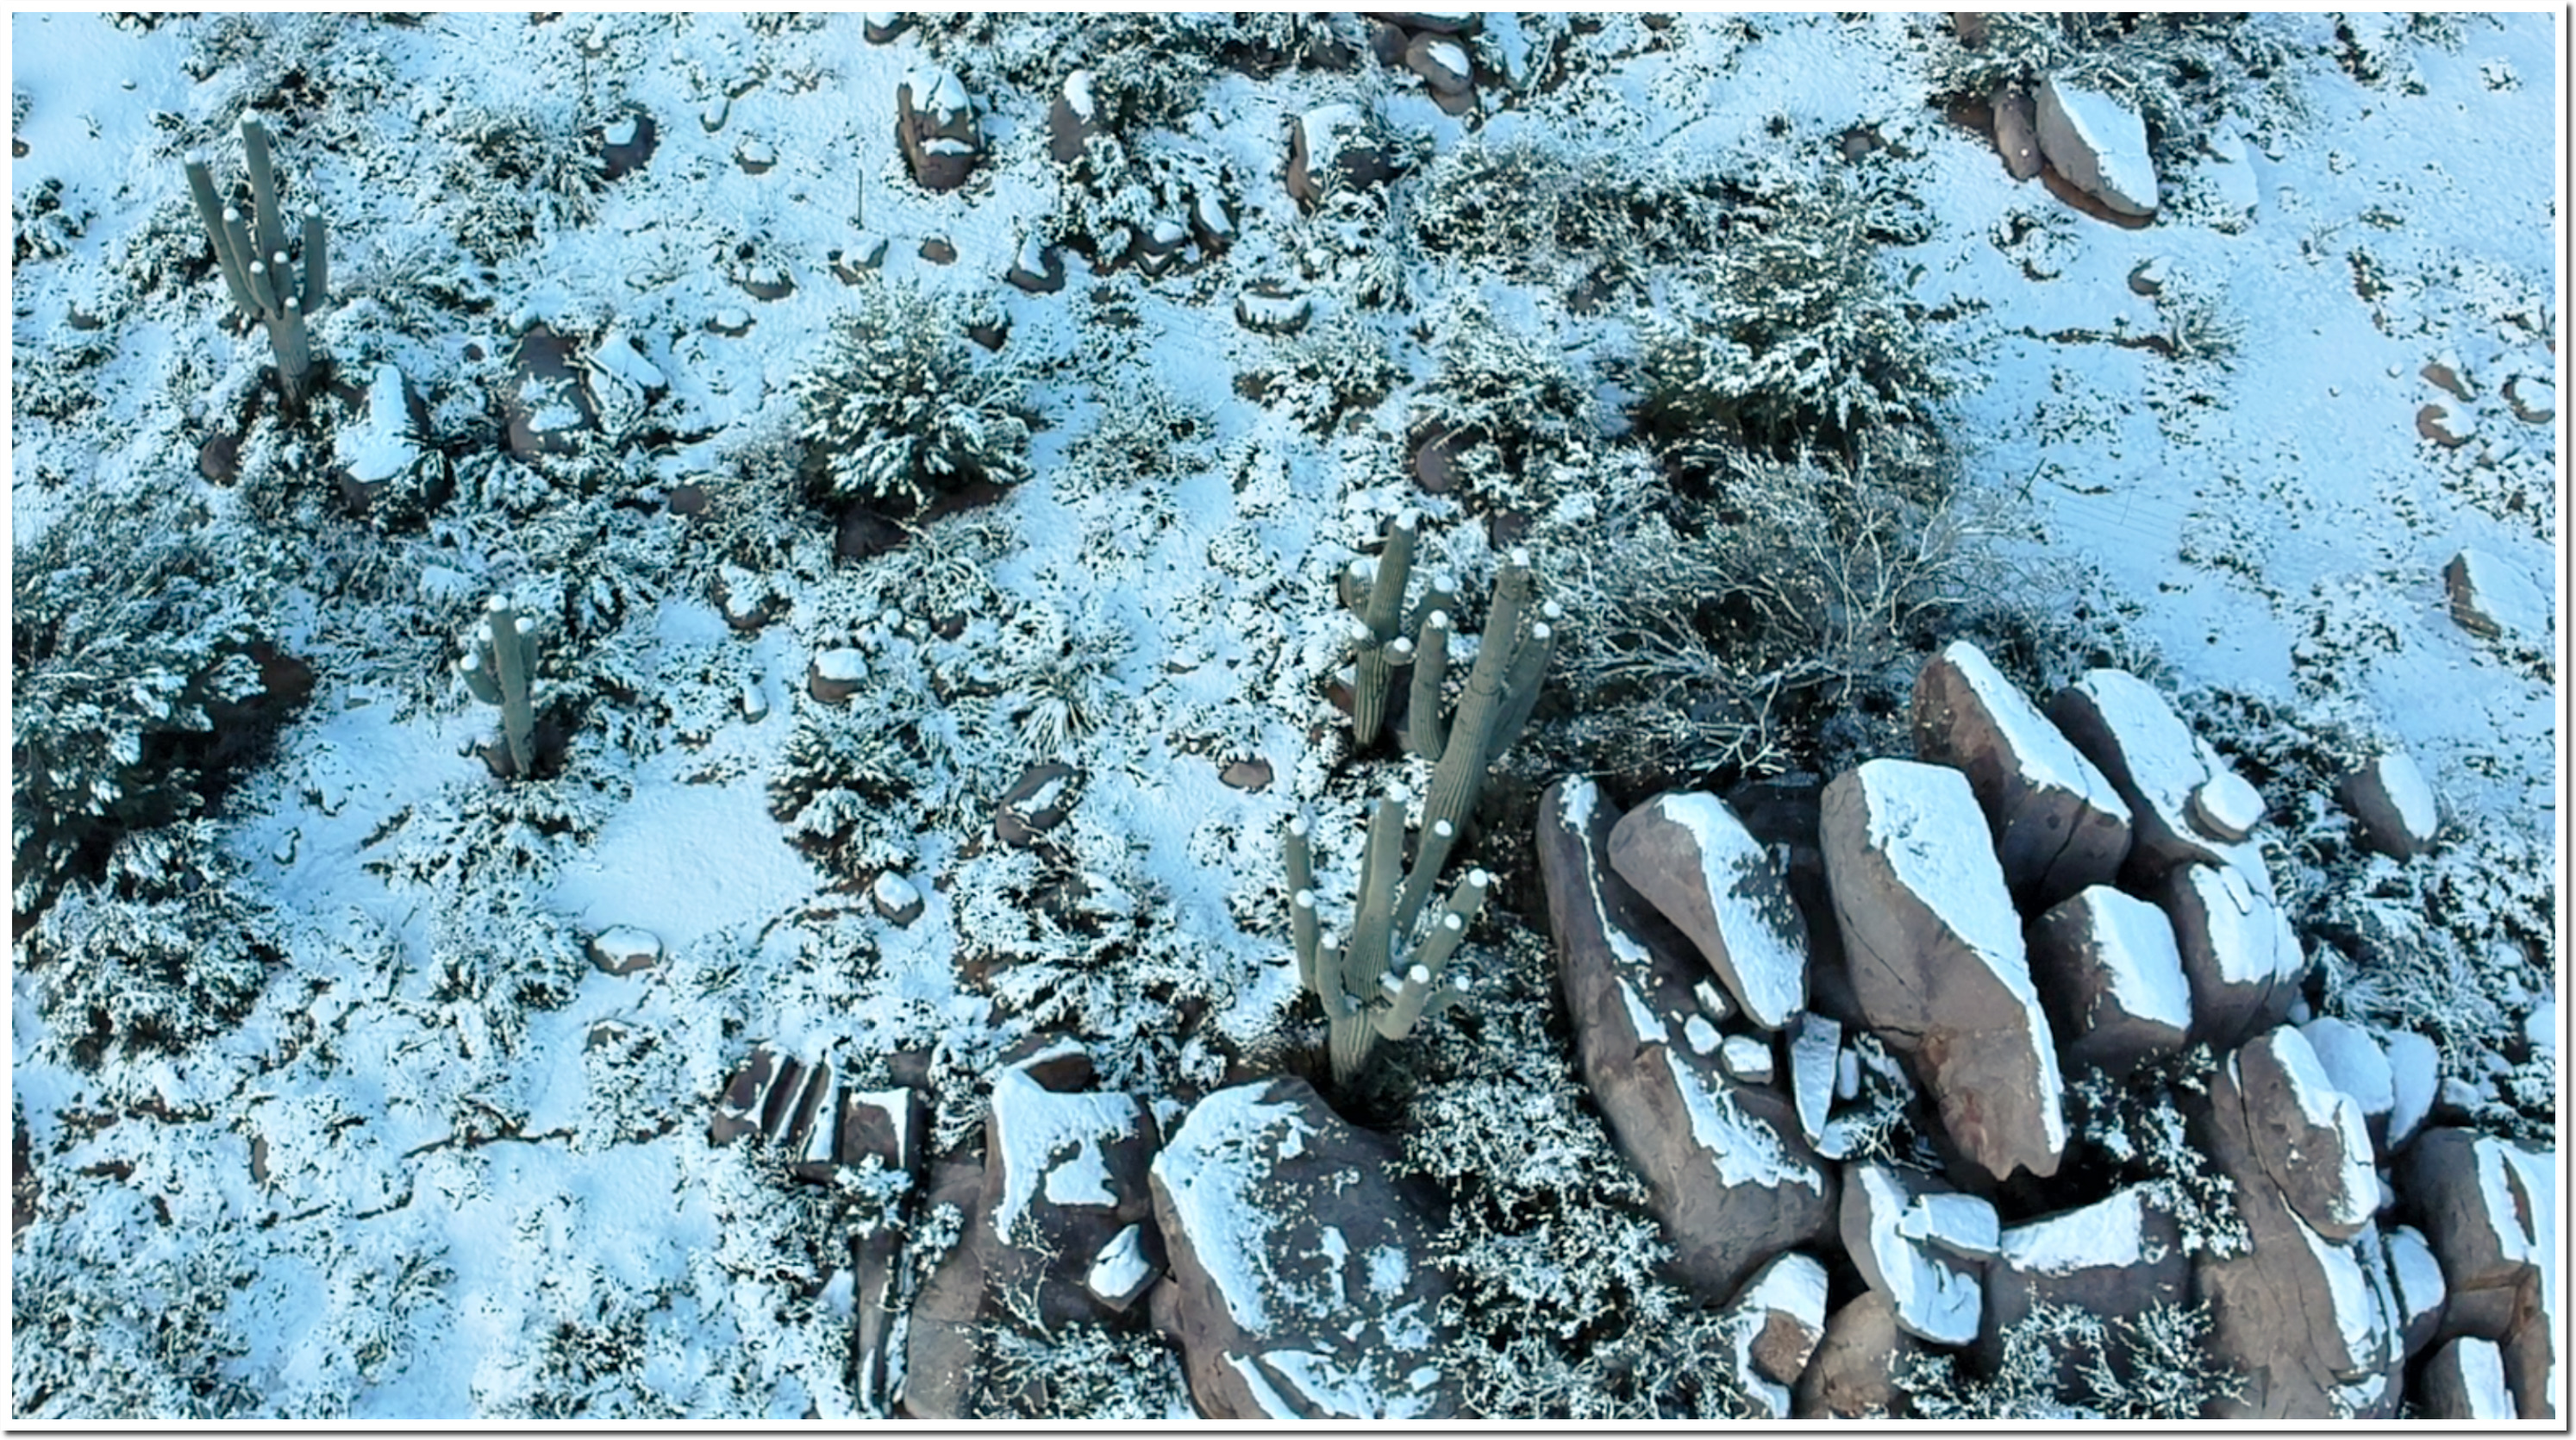
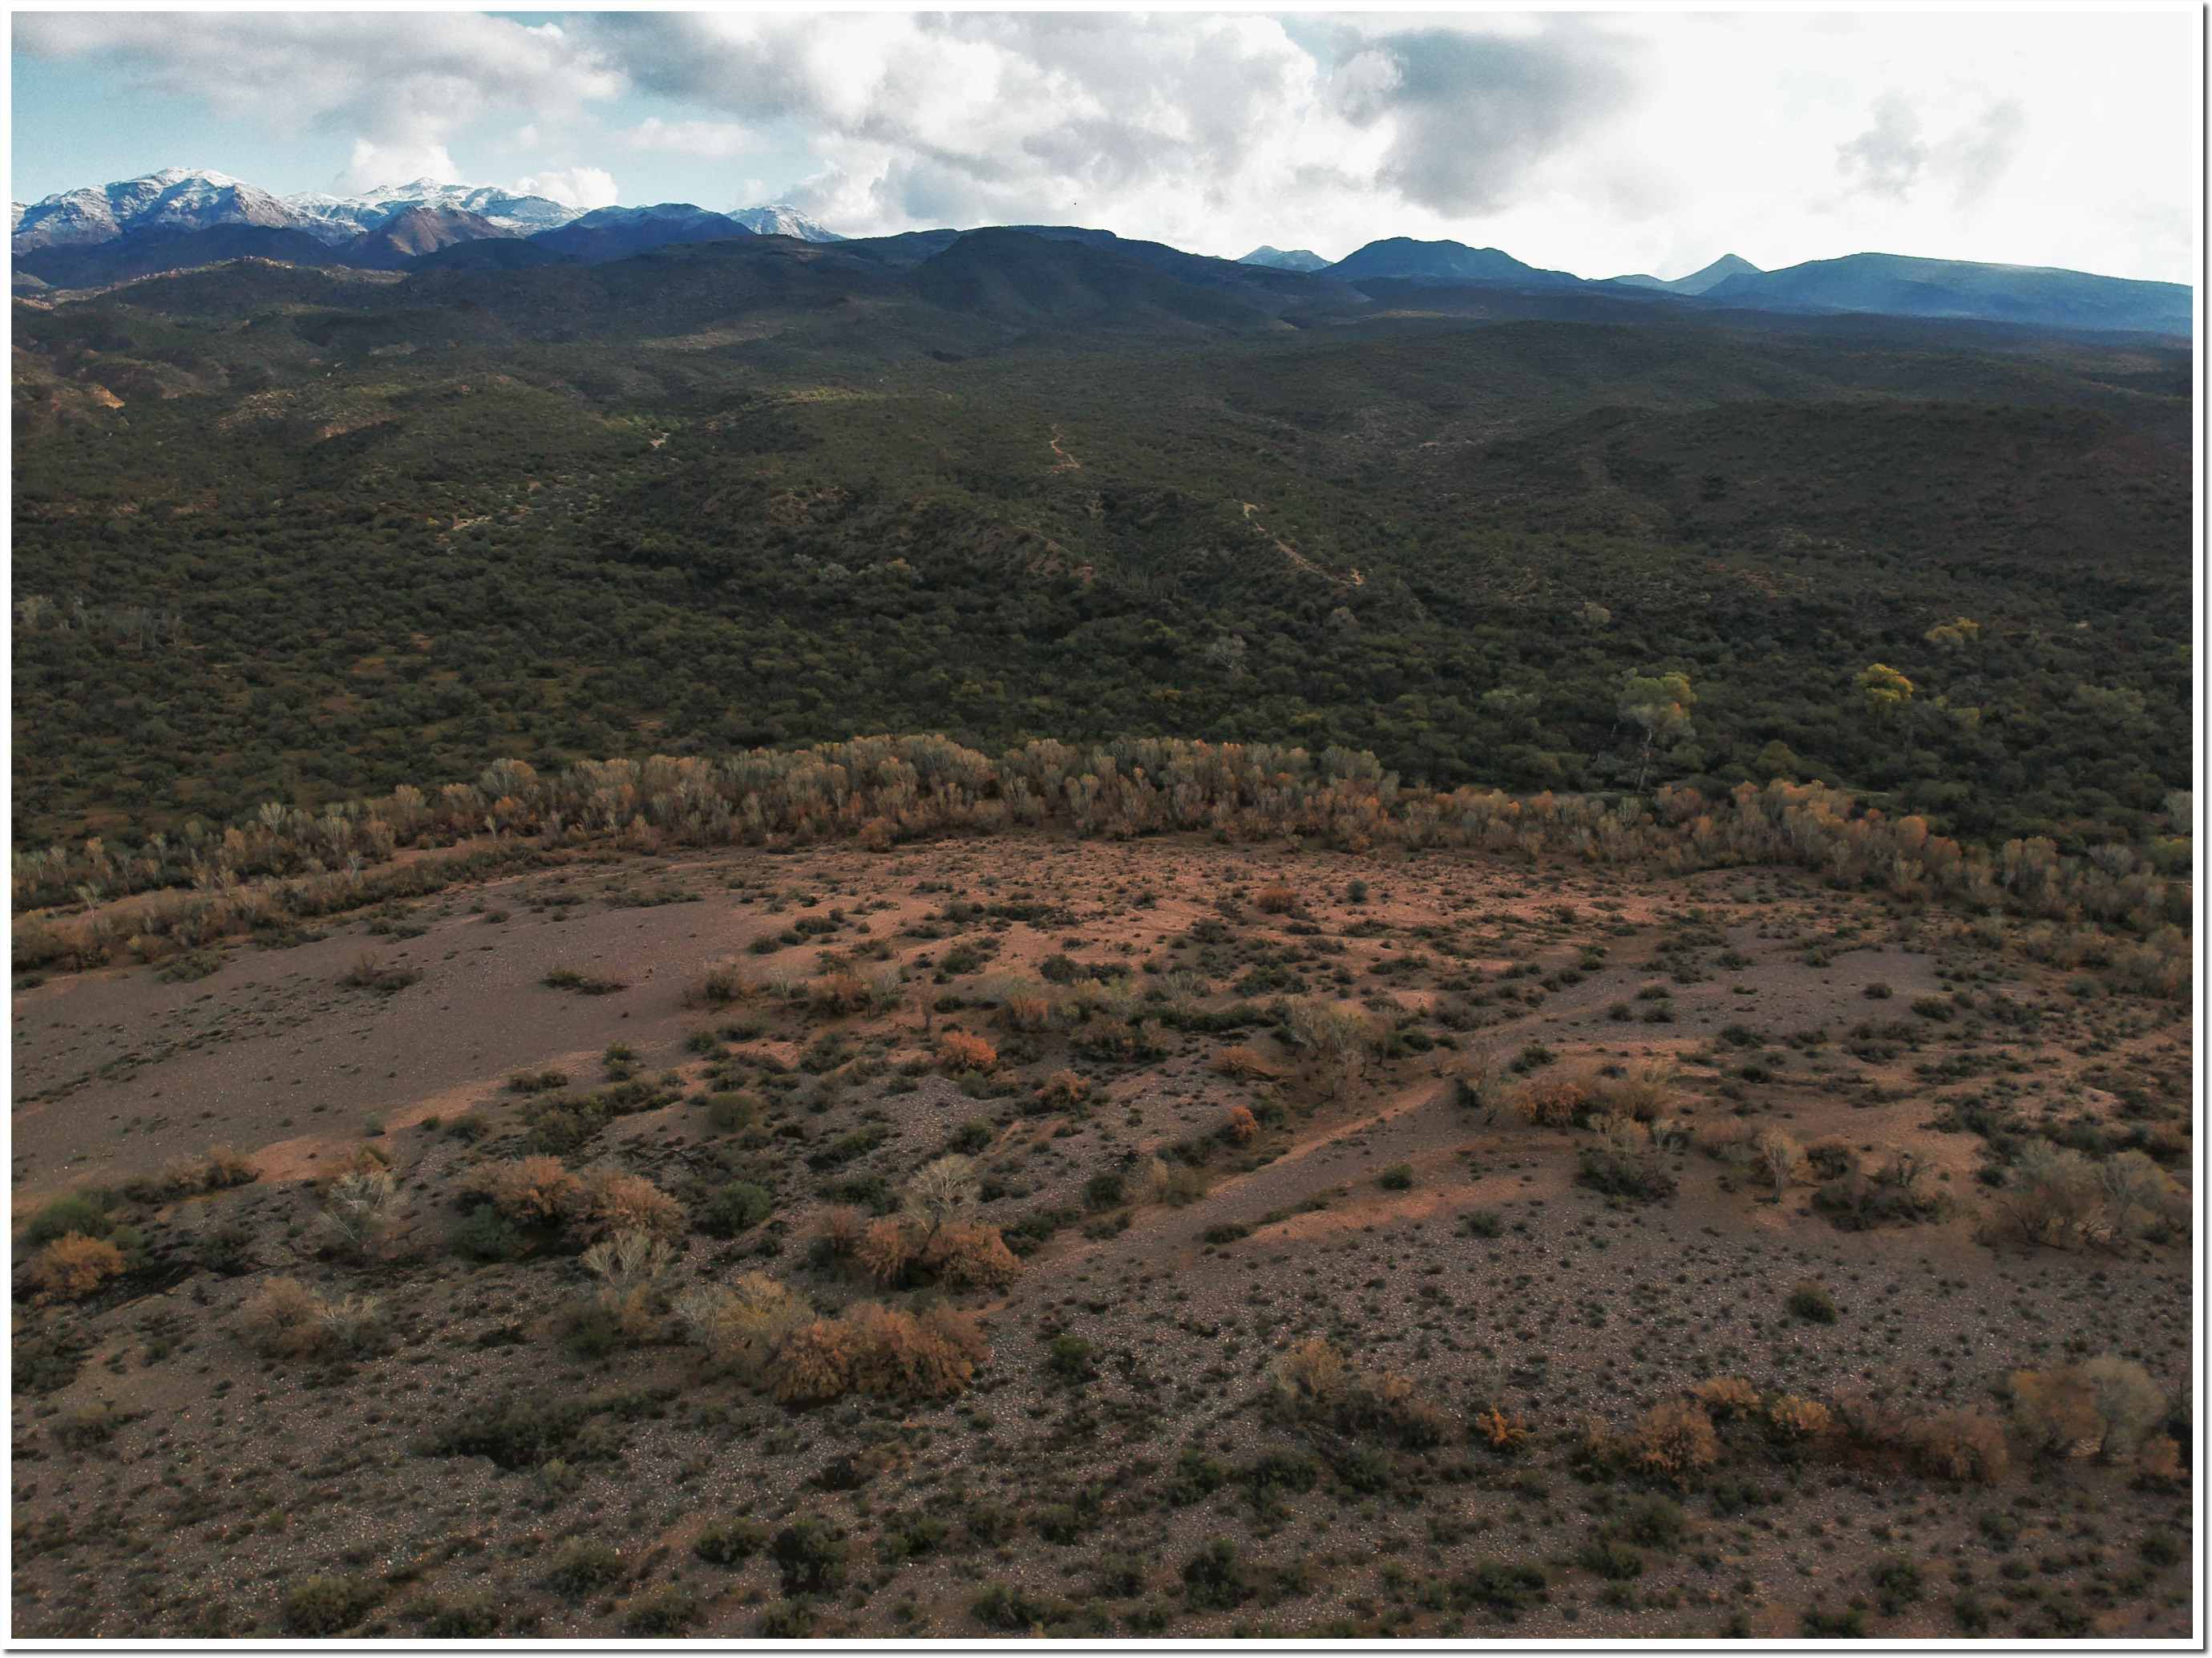
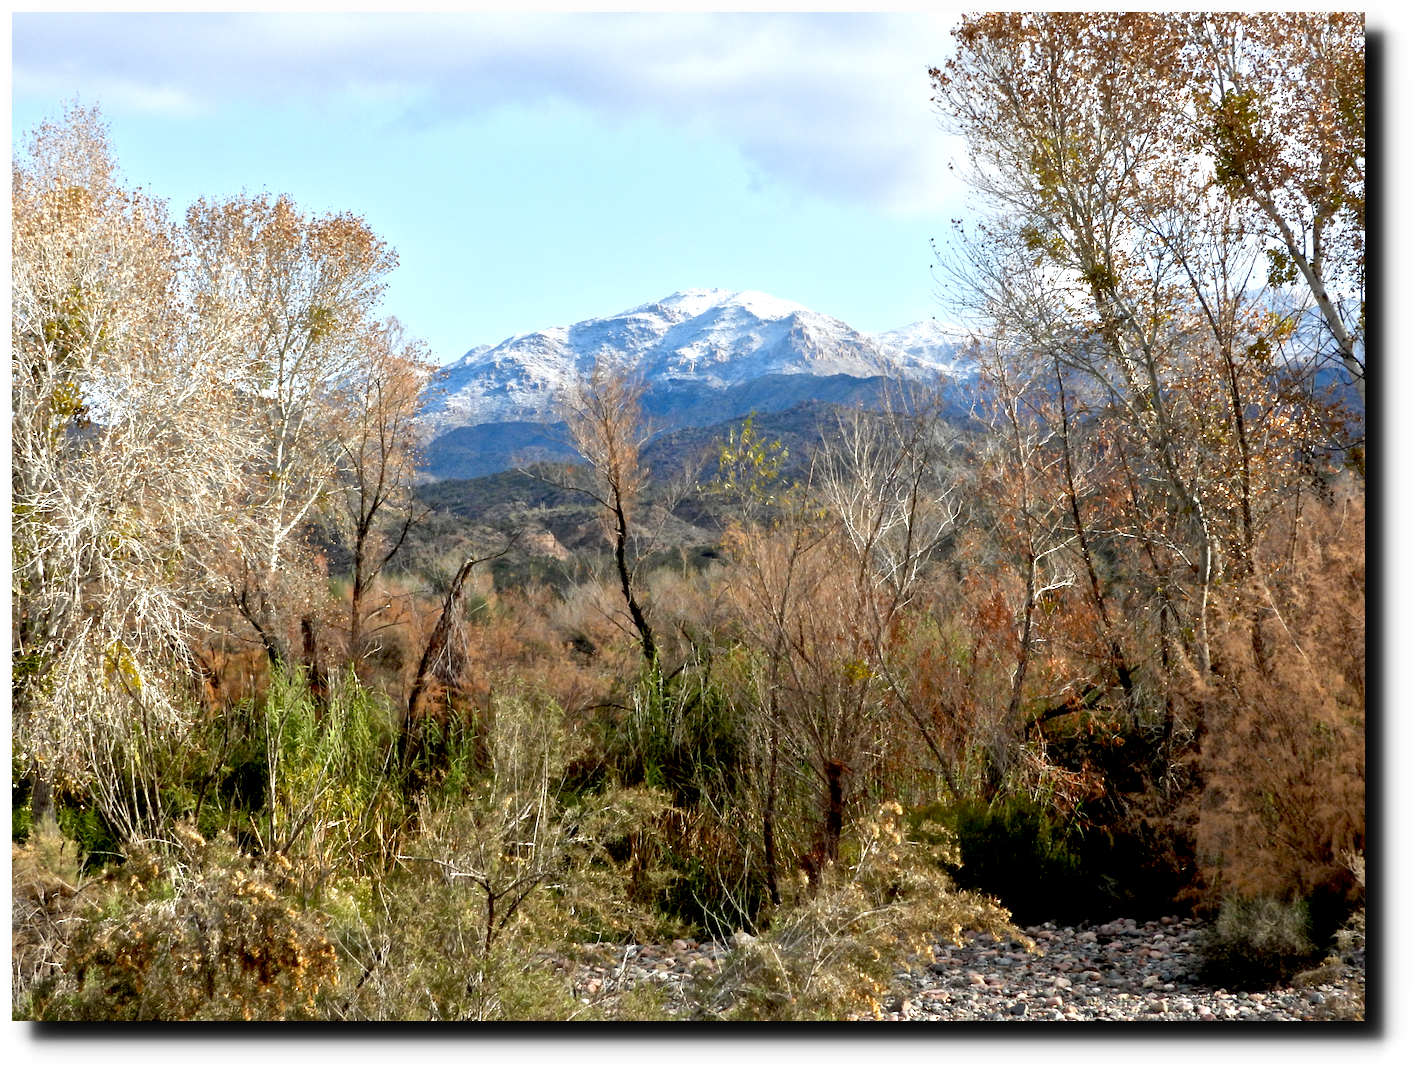
This is what New Mexico and Arizona looked like around New Years Day this year.
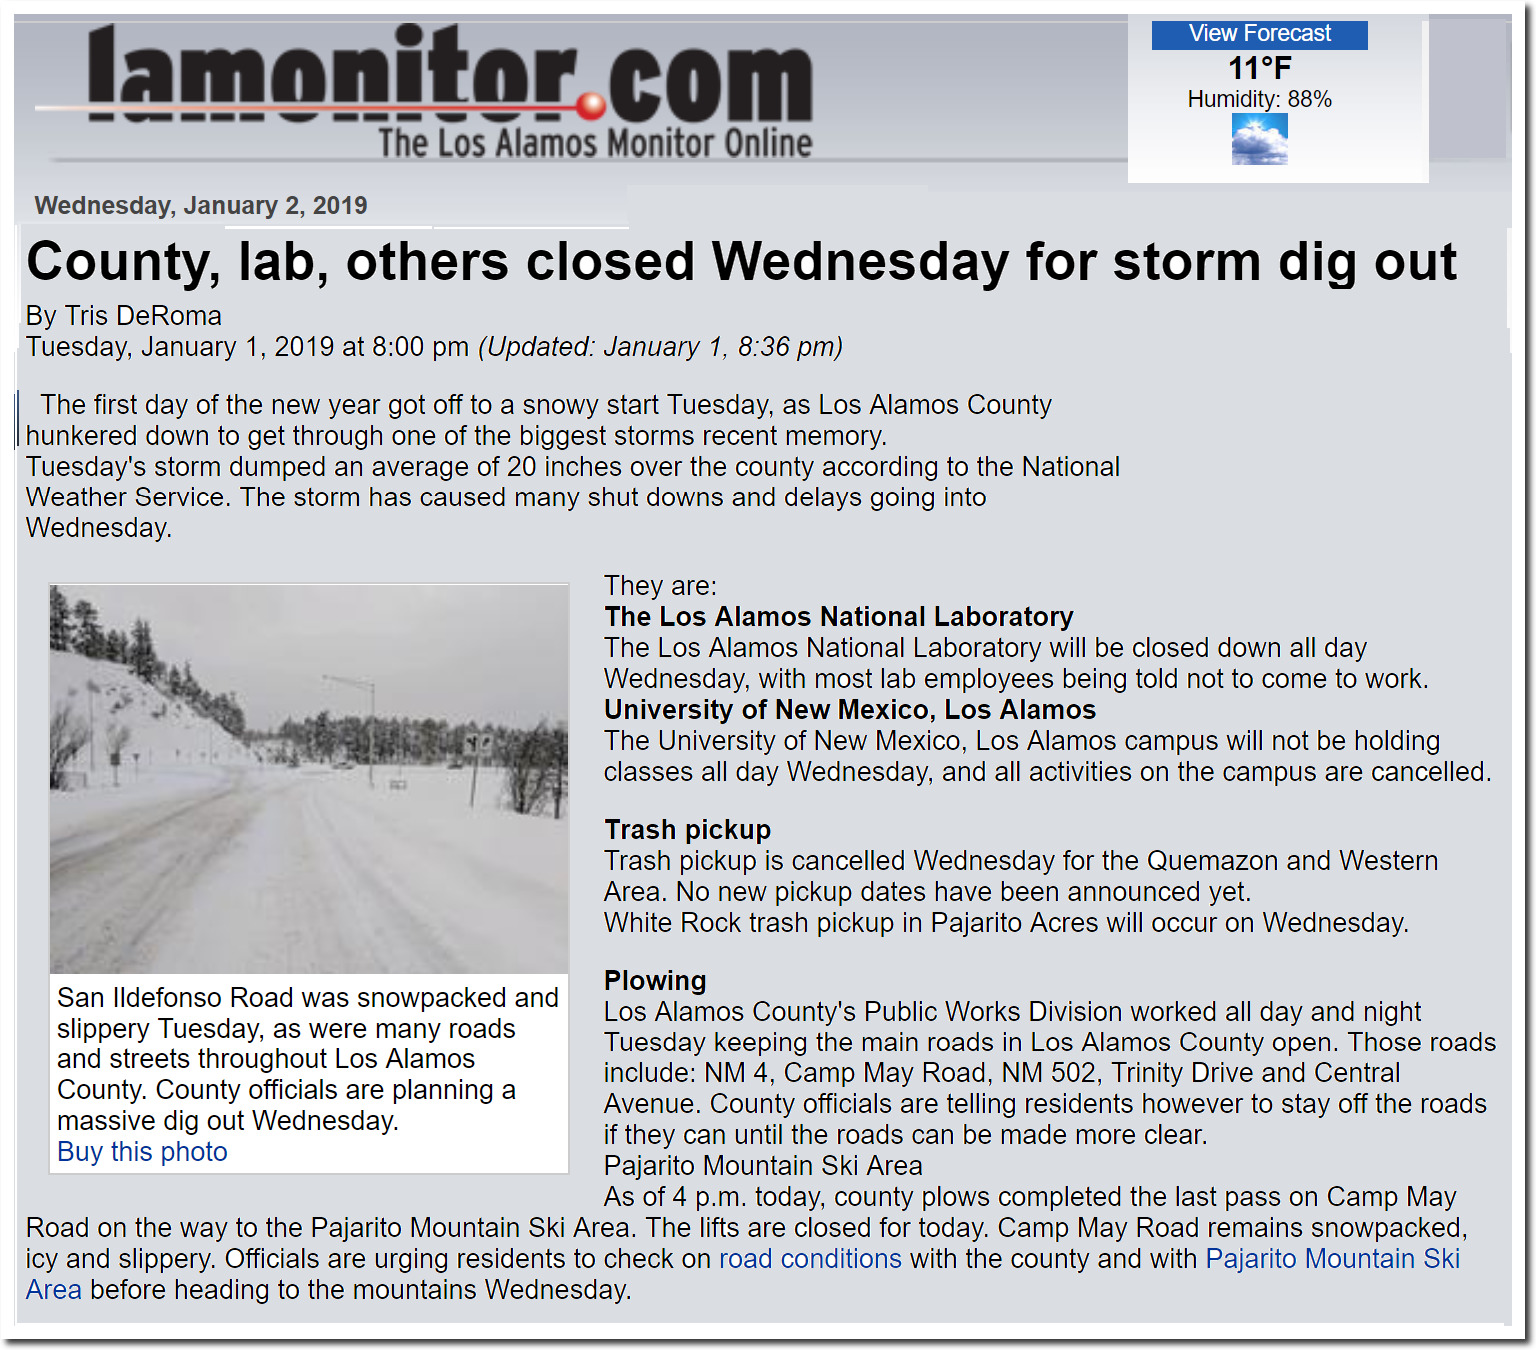
County, lab, others closed Wednesday for storm dig out | LAMonitor.com
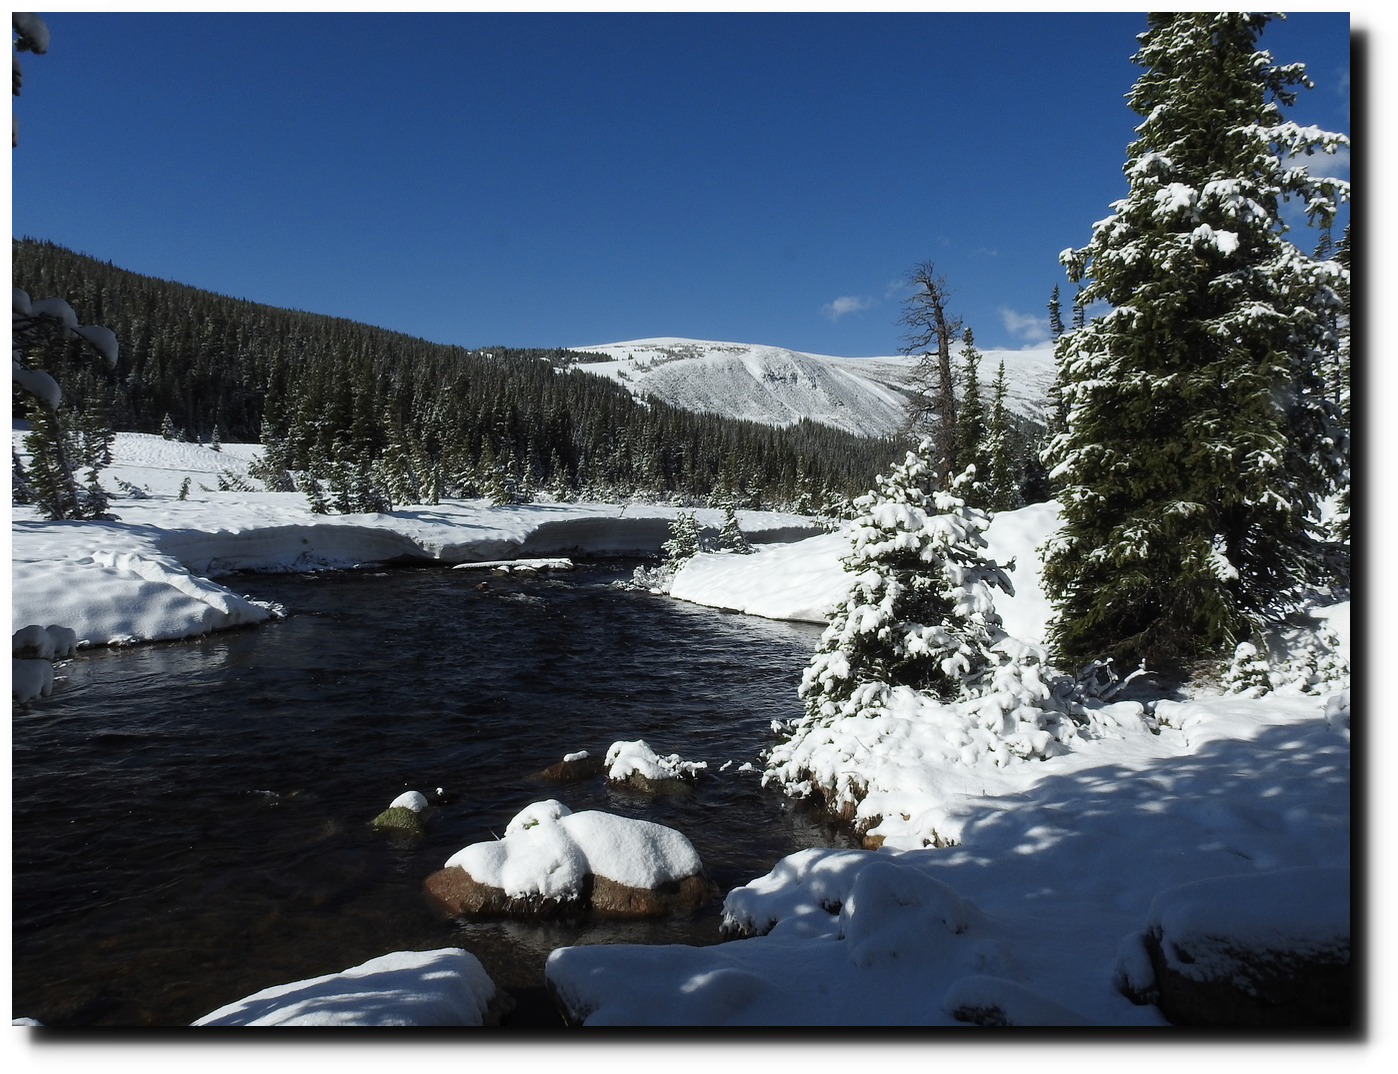
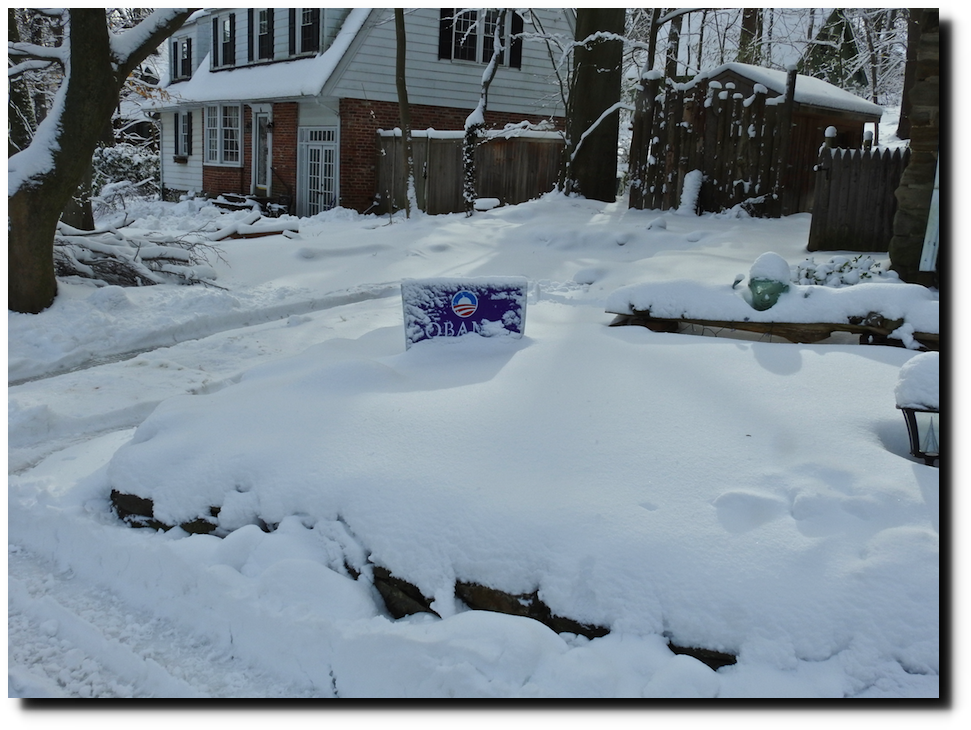
I spent last spring in record snow in Philadelphia, and took this picture at the end of March, 2018.
Climate scientists predicted the exact opposite of what has happened, and having gotten it wrong, they simply lie about the present.
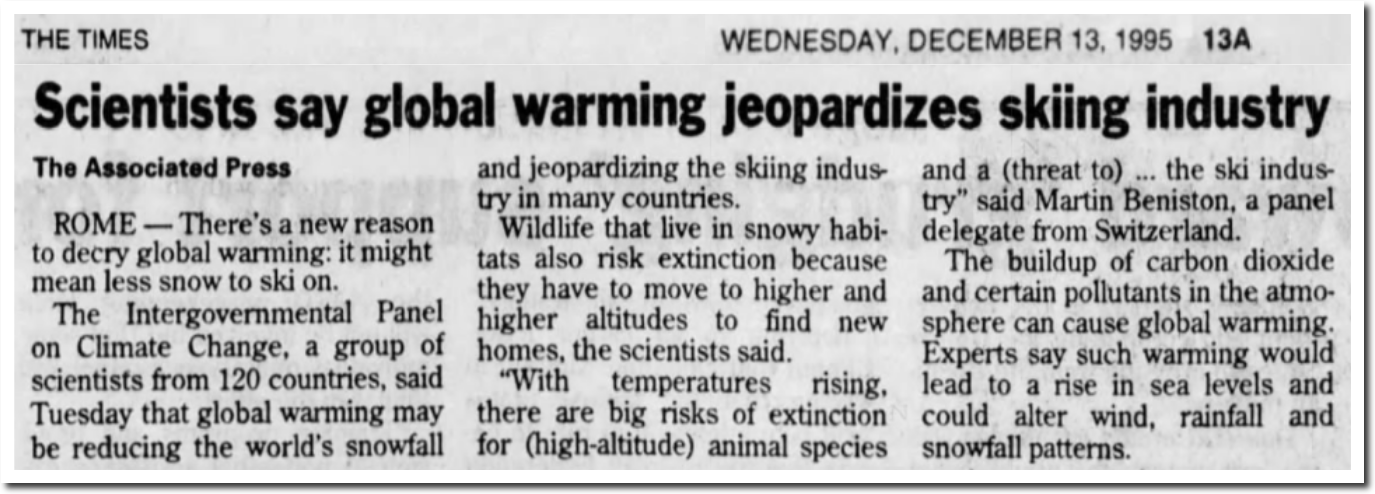
13 Dec 1995, Page 13 – The Times at Newspapers.com
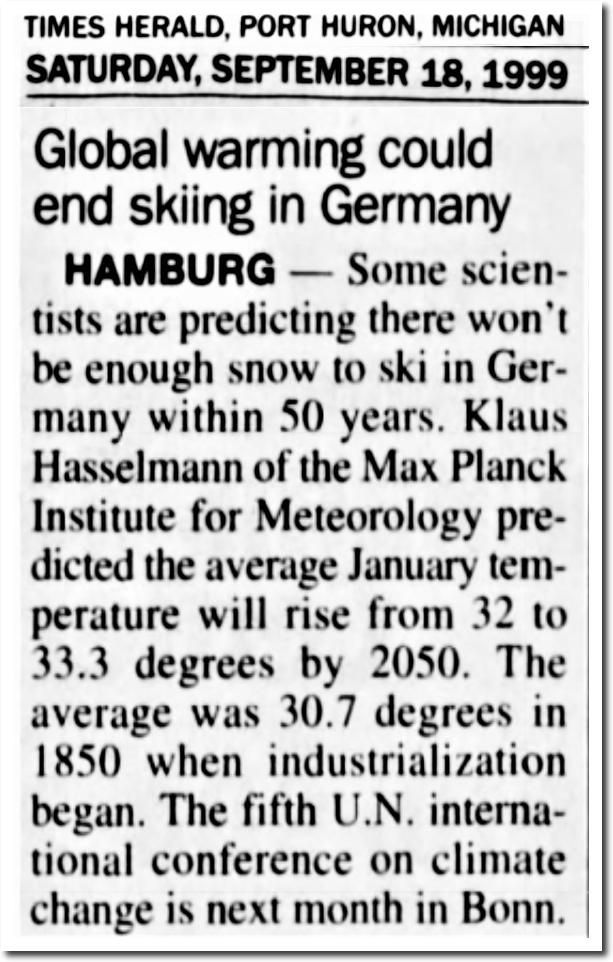
18 Sep 1999, Page 3 – The Times Herald at Newspapers.com
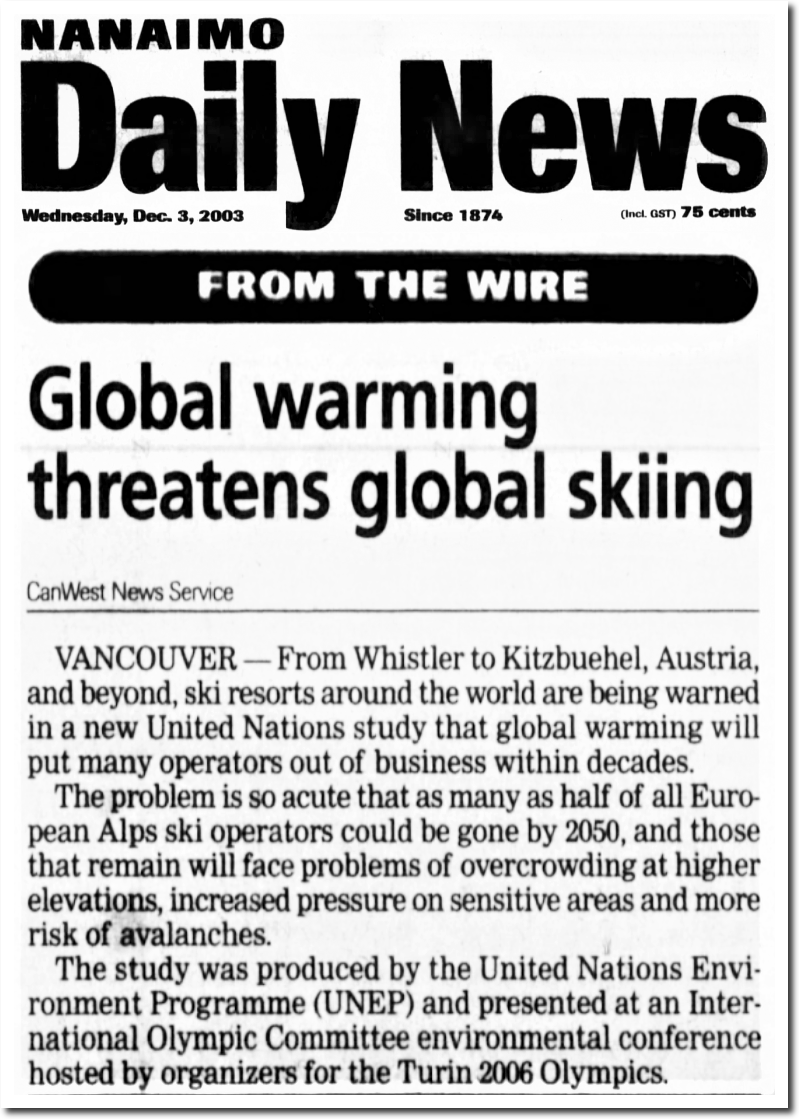
03 Dec 2003, 1 – Nanaimo Daily News at Newspapers.com
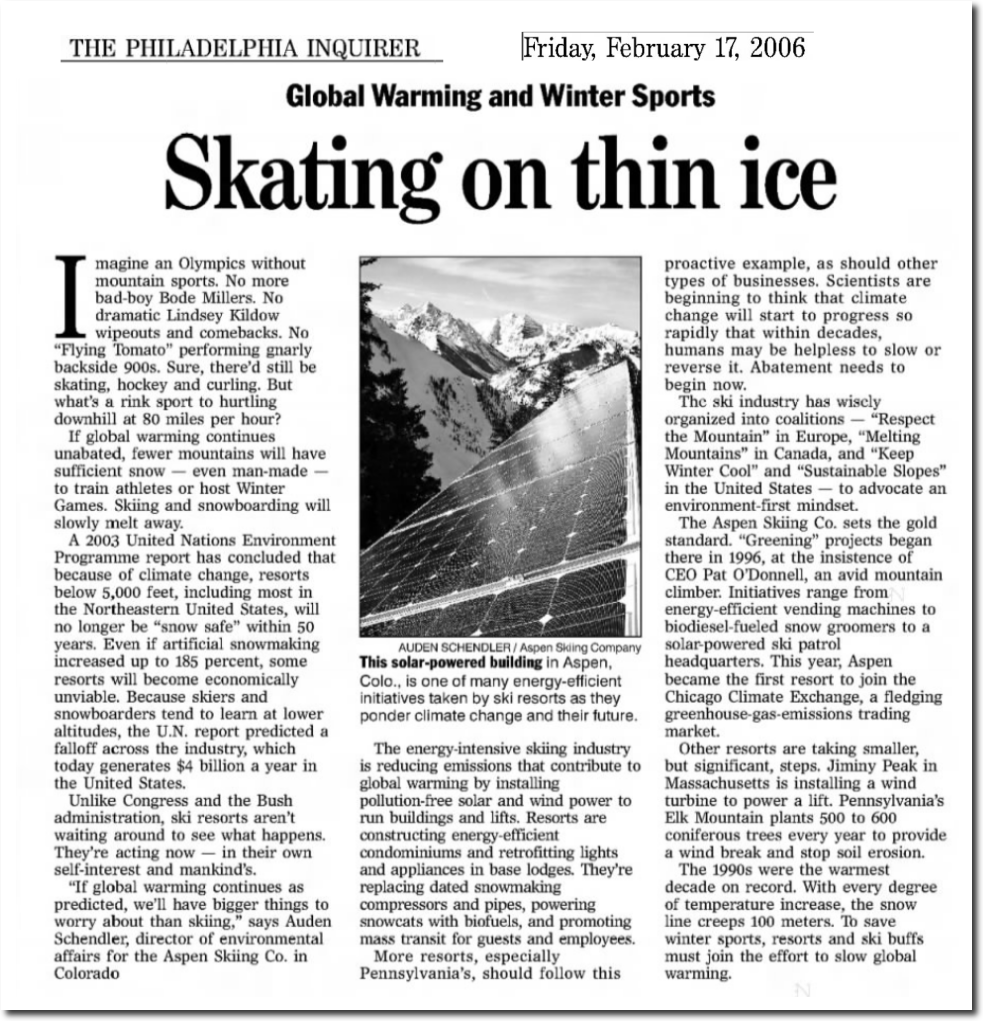
17 Feb 2006, Page A21 – The Philadelphia Inquirer at Newspapers.com
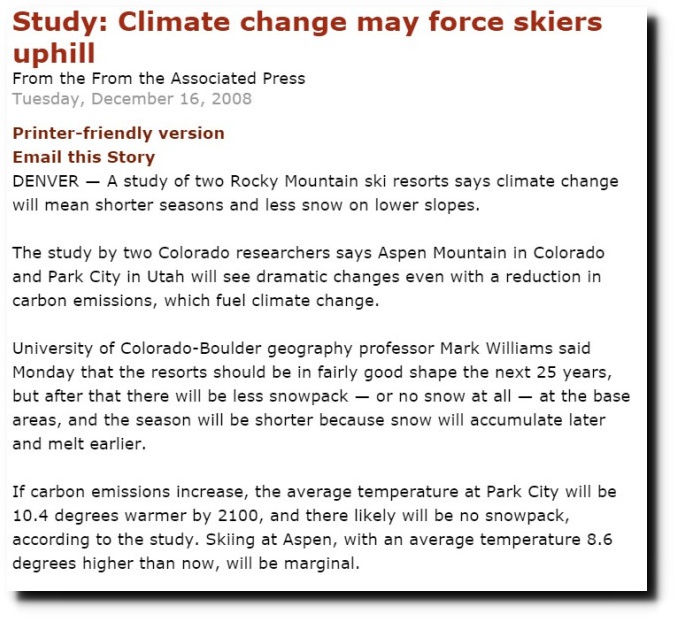
Study: Climate change may force skiers uphill | Aspen Daily News Online

Climate change scenarios for the California region | SpringerLink
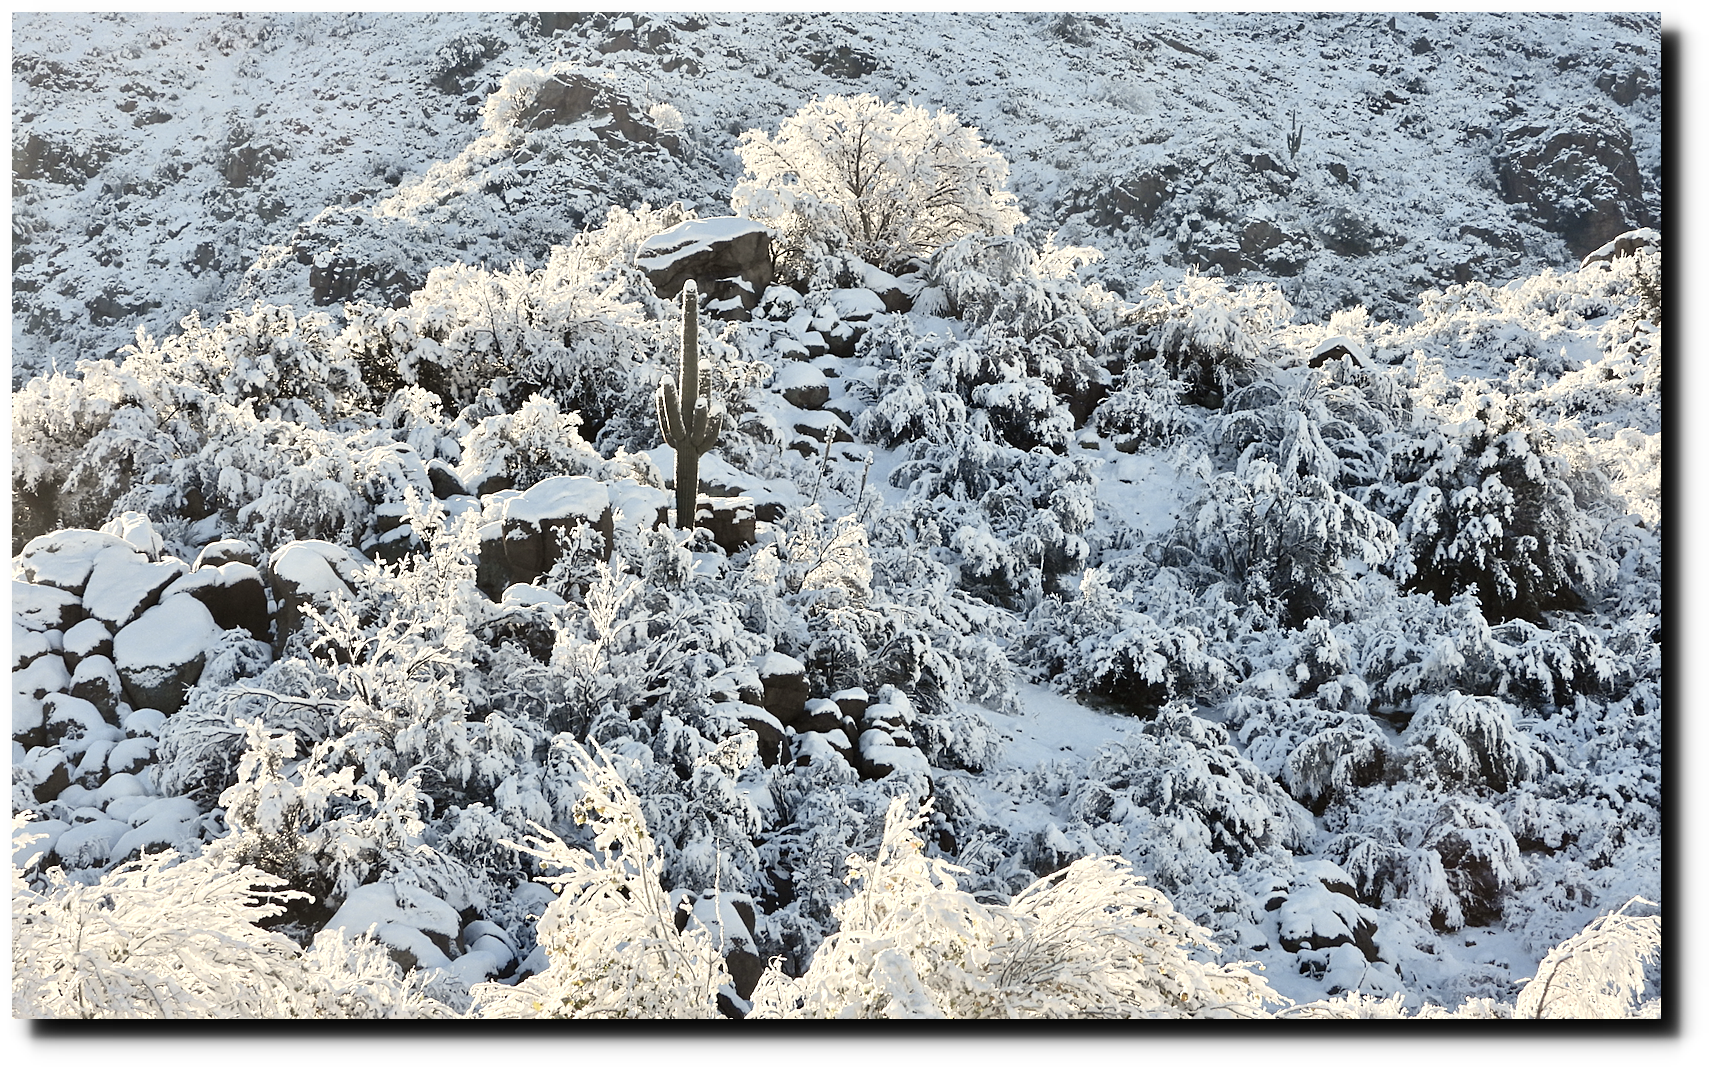
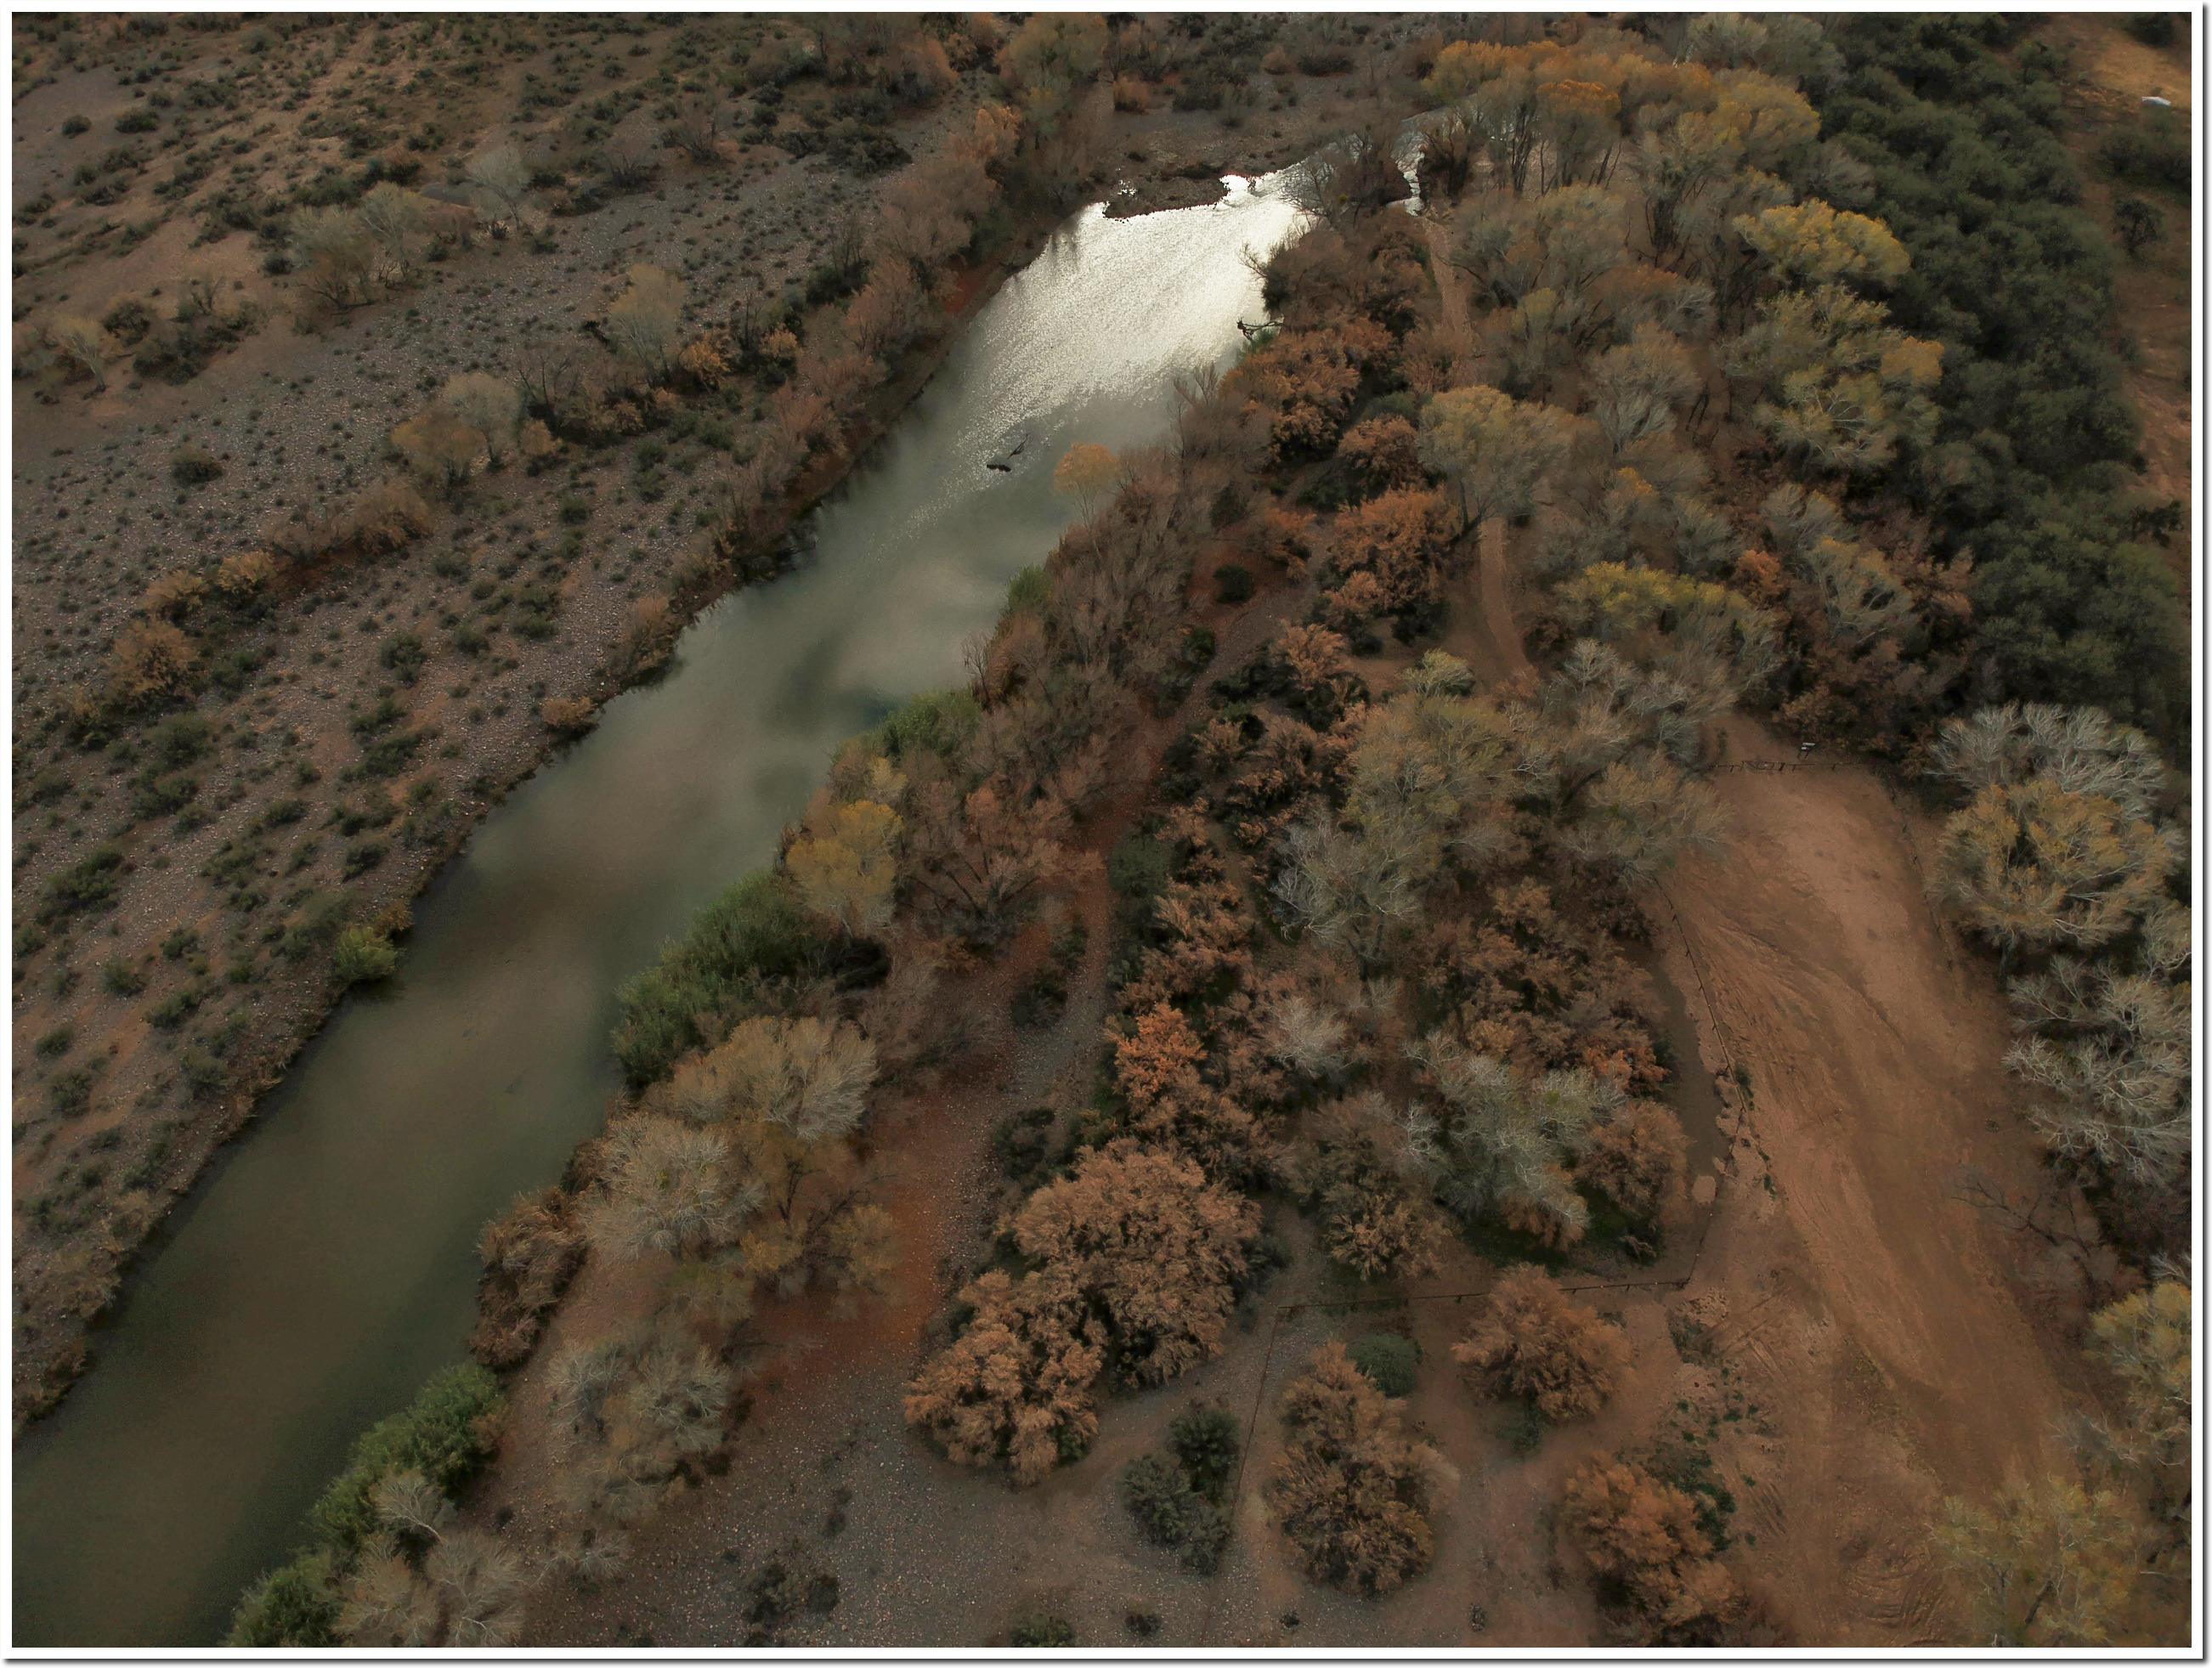
The skill and integrity of climate scientists is abysmal. But to finish on a more positive note – I saw a lot of amazing sights in the Sonoran Desert on New Years Day.


Posted in Uncategorized
Leave a comment
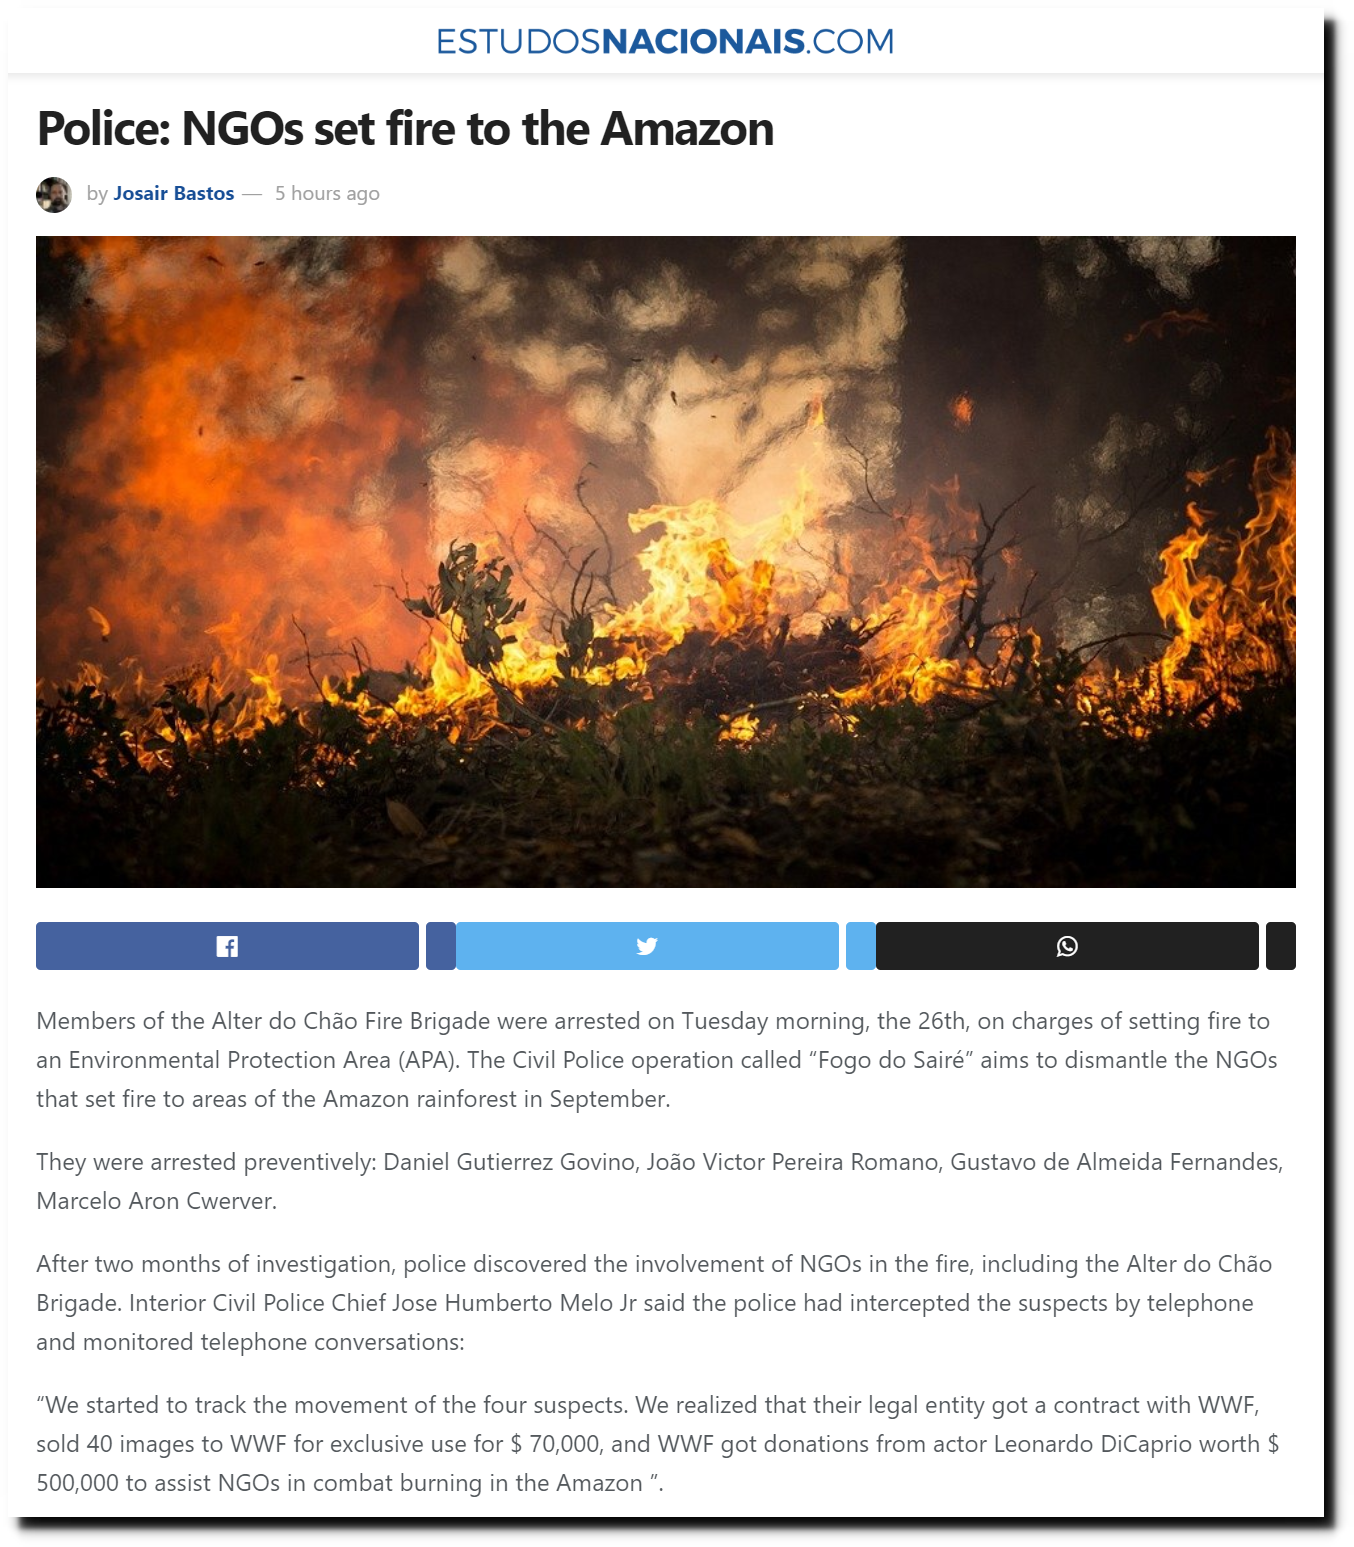
Leo DiCaprio And WWF Paid For The Amazon Fires
Leonardo DiCaprio and WWF sent large amounts of money to organizations which earned their living by starting fires and then selling pictures of the fires.
Posted in Uncategorized
Leave a comment
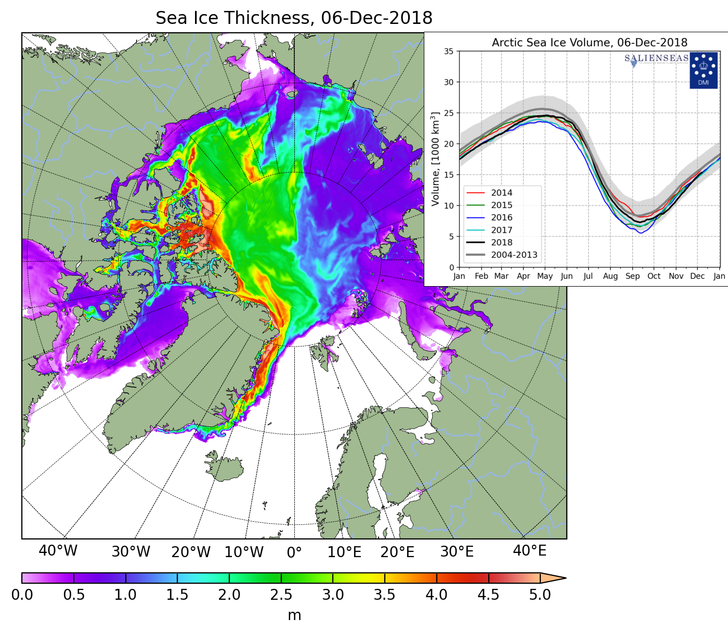
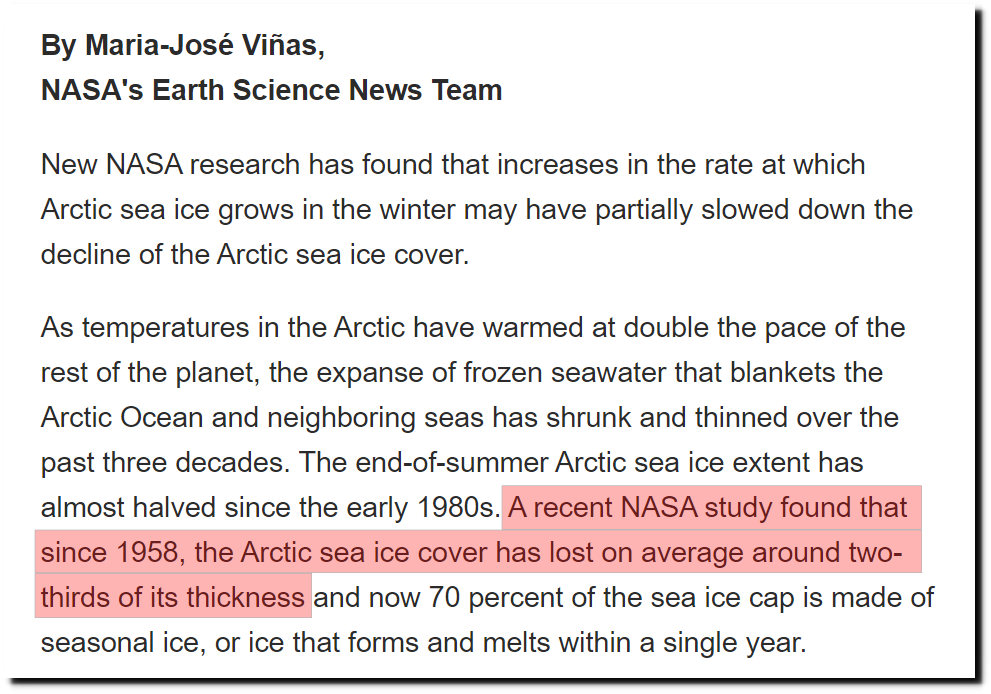
“A NASA Study Found”
In a December 2018 article, NASA claimed that Arctic sea ice had lost two-thirds of its thickness since 1958.
That claim is simple enough to check out. In 1958, Arctic sea ice was 7 feet, or two meters thick. Scientists were forecasting an ice-free Arctic within a generation.

The Changing Face of the Arctic; The Changing Face of the Arctic – The New York Times
On the date of the NASA article, Arctic sea ice also averaged about two meters thick – indicating little or no change since 1958.
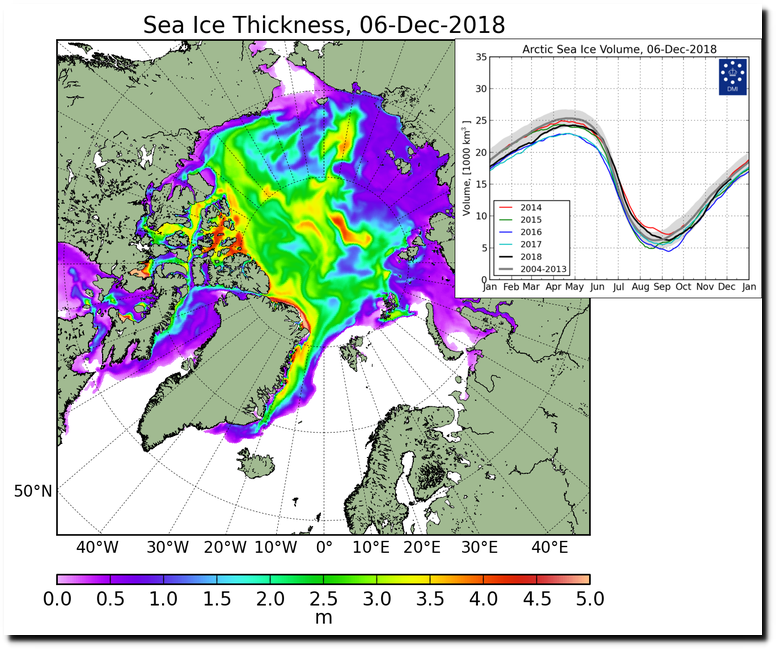
CICE_combine_thick_SM_EN_20181206.png (758×631)
In the 1985 DOE Report, Vinnikov showed that Arctic sea ice declined sharply until the century low in the mid-1950s, and then started to increase again.

Projecting the climatic effects of increasing carbon dioxide
Vinnikov extended his numbers in the 1990 IPCC report.
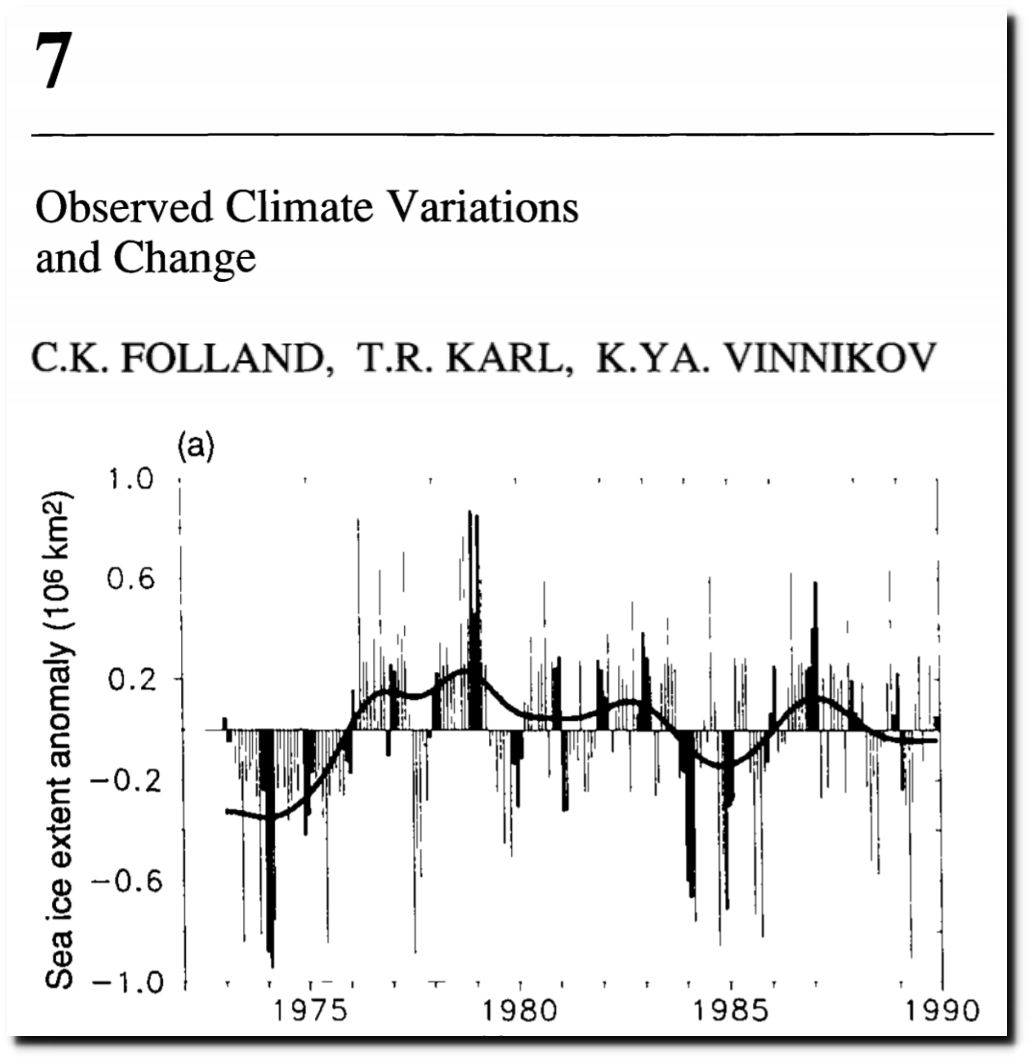
This chart combines the 1985 and 1990 Vinnikov graphs.
The decline in Arctic sea ice from the 1920s until the 1950s was widely reported.
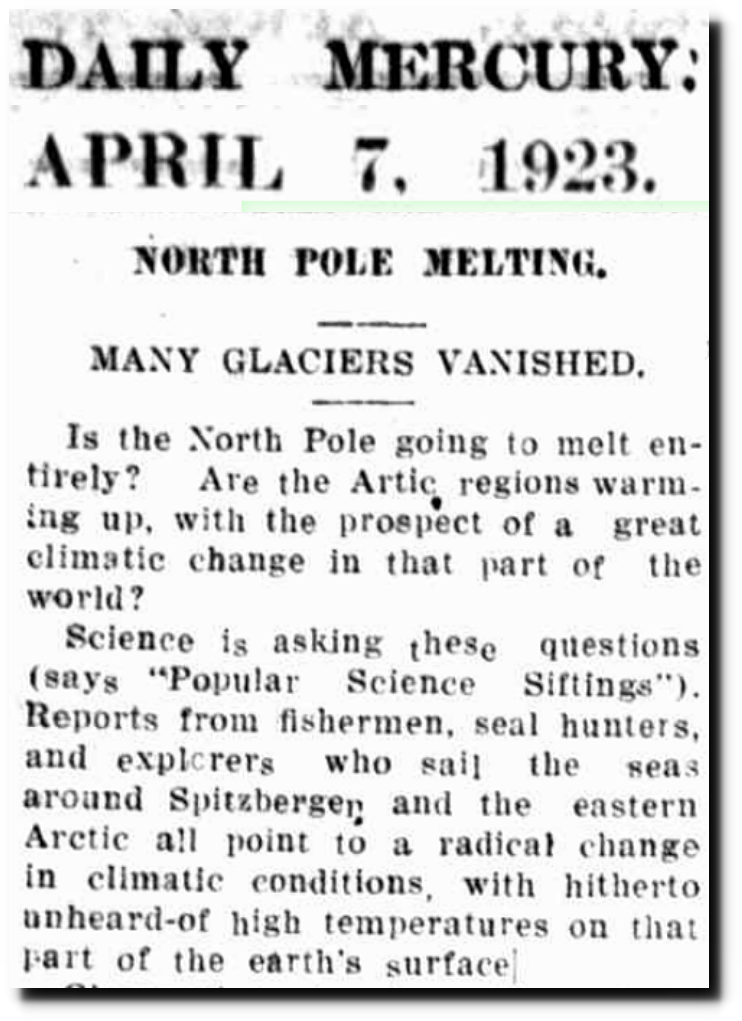
07 Apr 1923 – NORTH POLE MELTING. – Trove
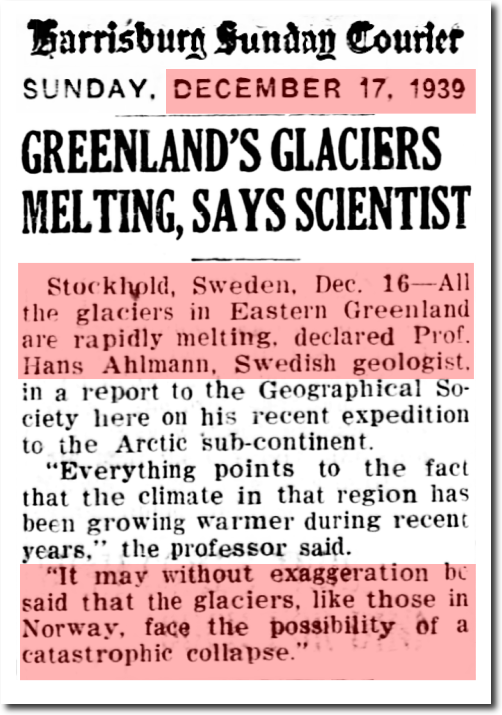
17 Dec 1939, Page 15 – Harrisburg Sunday Courier at Newspapers.com
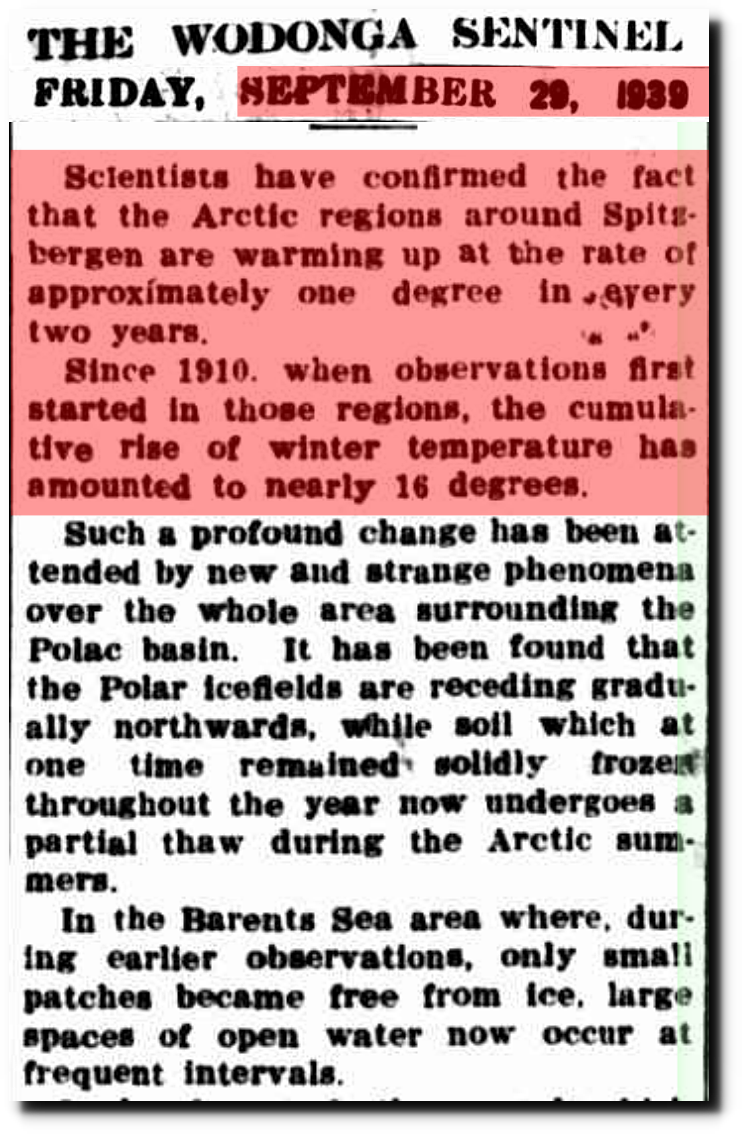
29 Sep 1939 – What is The World Coming To? – Trove

13 Oct 1940, Page 76 – Hartford Courant at Newspapers.com

31 May 1947 – MELTING ICE CAP DANGER – Trove
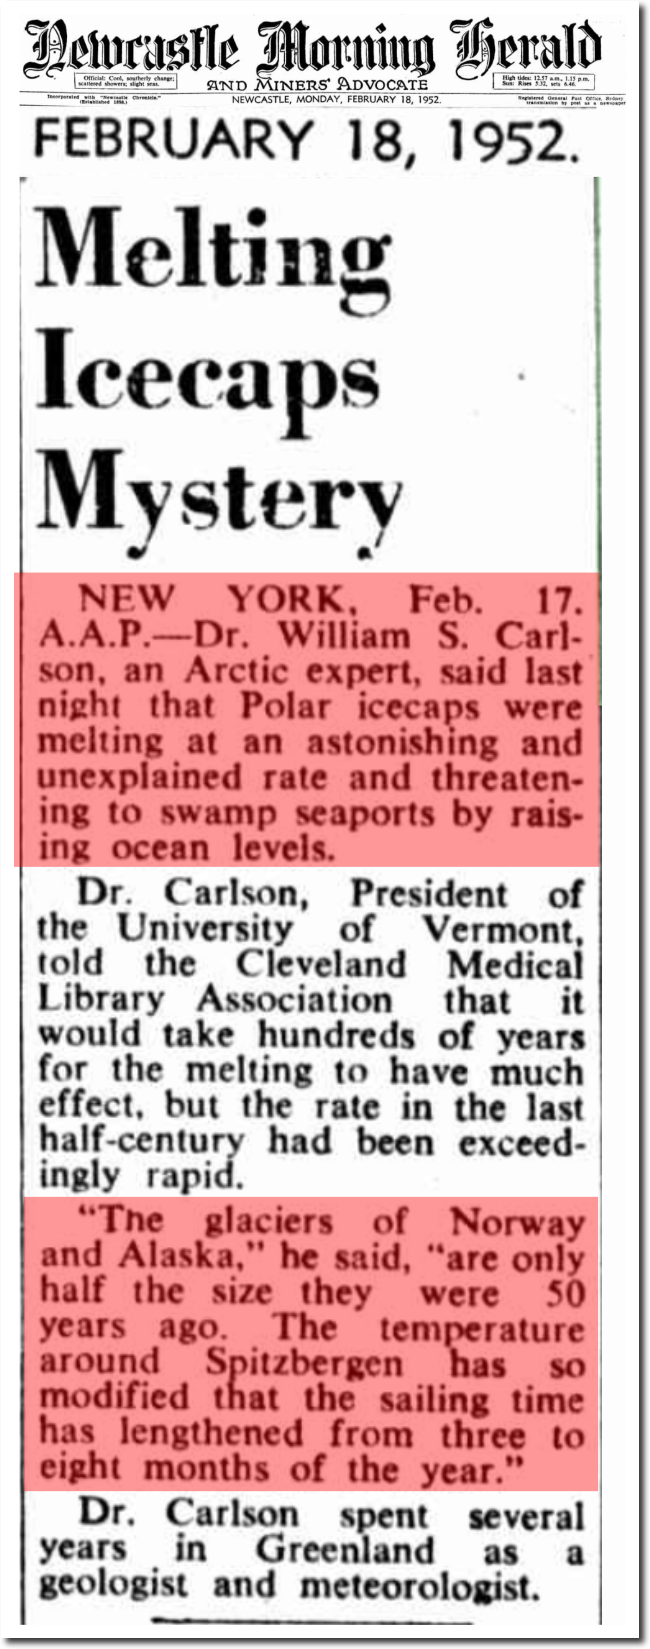
18 Feb 1952 – Melting Icecaps Mystery – Trove
The subsequent cooling and increase in sea ice after after the 1950s, was also widely reported.

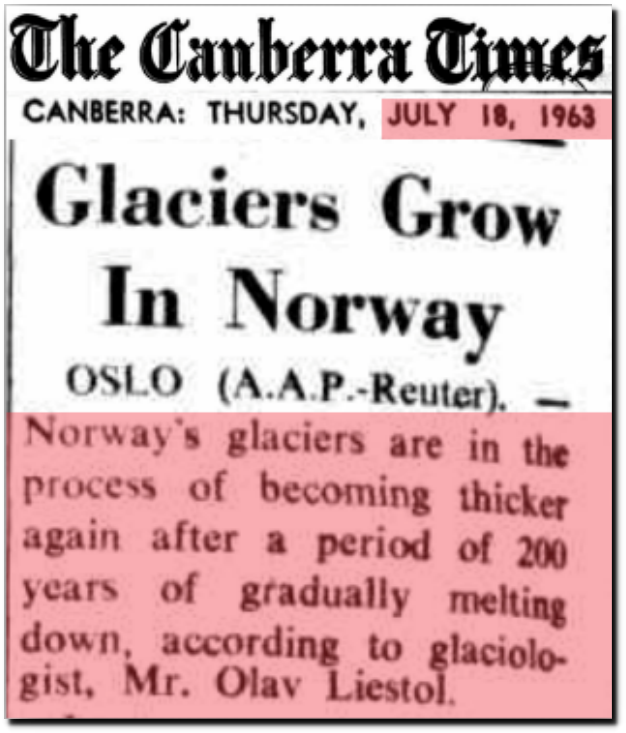
18 Jul 1963 – Glaciers Grow In Norway
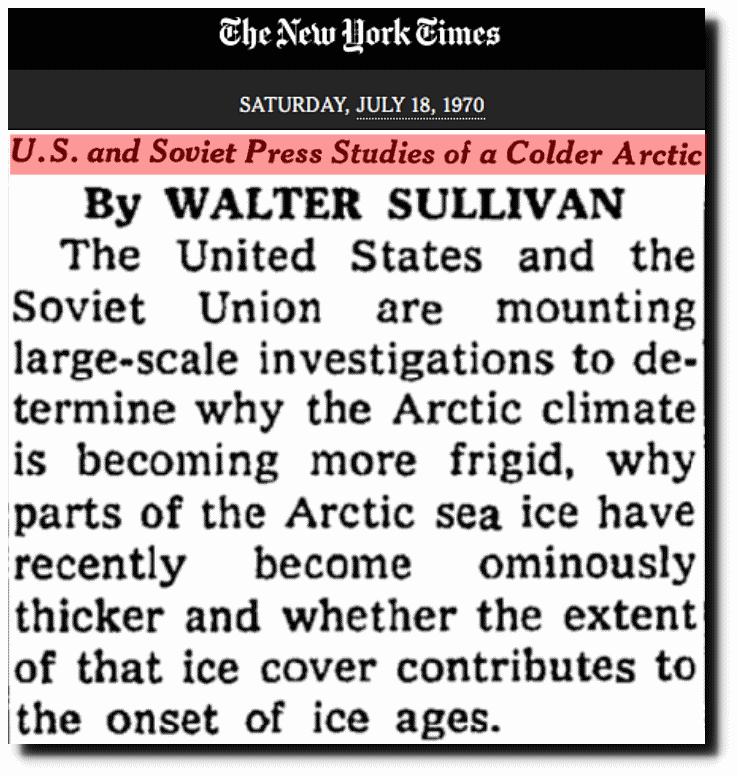
U.S. and Soviet Press Studies of a Colder Arctic – The New York Times
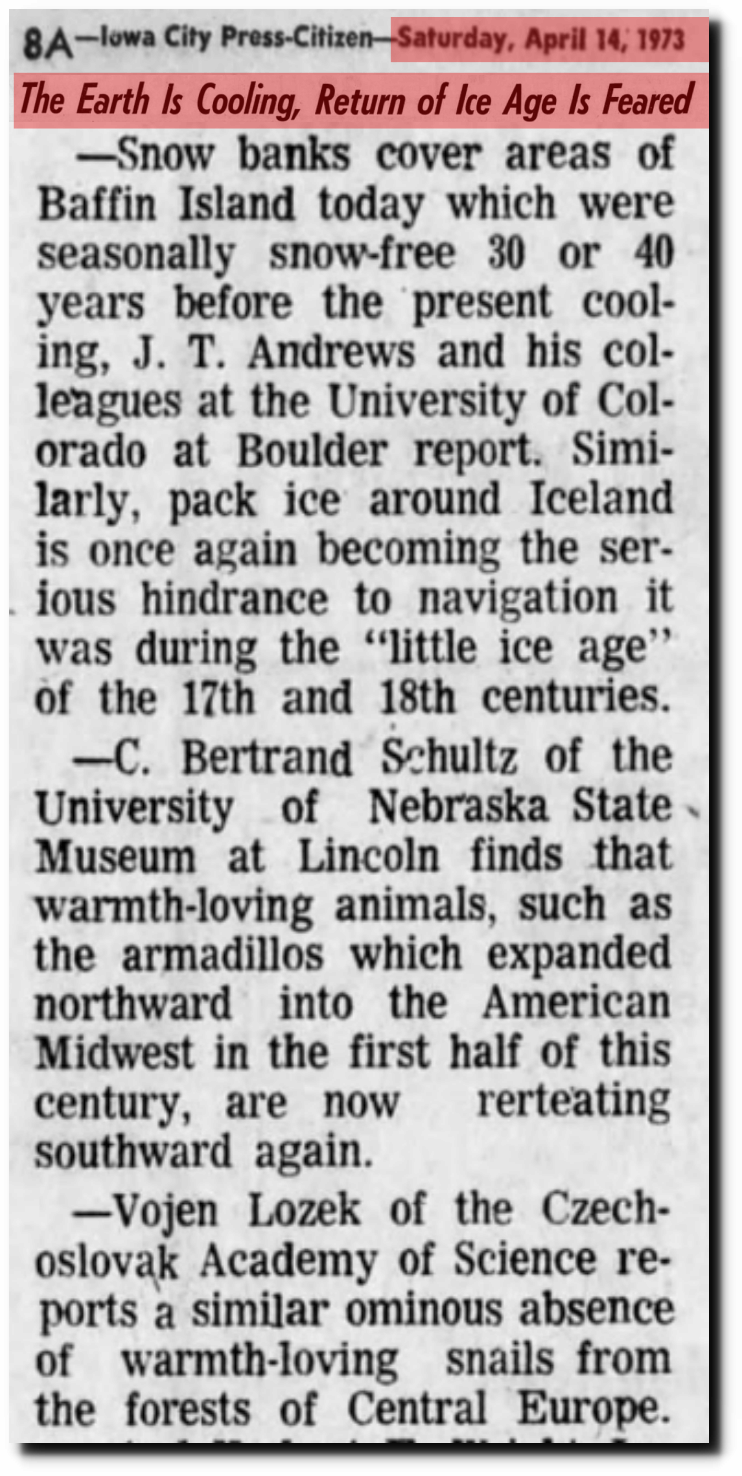
14 Apr 1973, Page 8 – Iowa City Press-Citizen
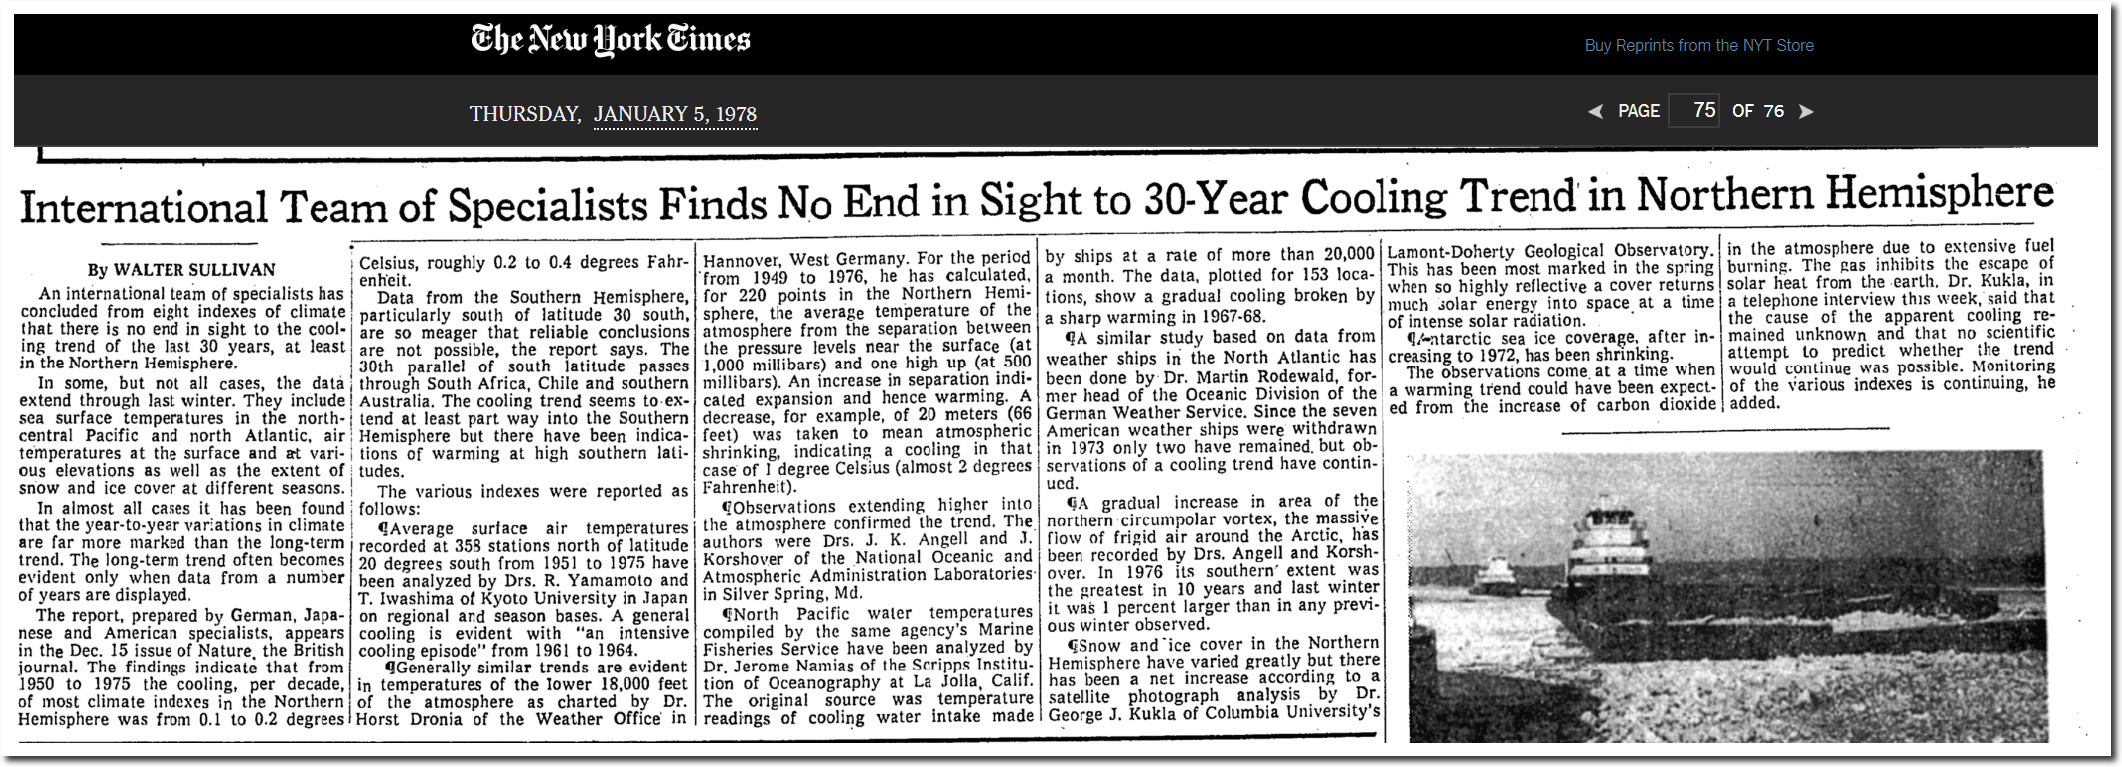
International Team of Specialists Finds No End in Sight to 30?Year Cooling Trend in Northern Hemisphere
By WALTER SULLIVAN JAN. 5, 1978
A gradual increase in area of the northern circumpolar vortex, the massive flow of frigid air around the Arctic, has been recorded by Drs. Angell and Korshover. In 1976 its southern’ extent was the greatest in 10 years and last winter it was 1 percent larger than in any previous winter observed.
Snow and ice cover in the Northern Hemisphere have varied greatly but there has been a net increase according to a satellite photograph analysis by Dr George J. Kukla of Columbia University’s Lamont?Doherty Geological Observatory. This has been most marked in the spring when so highly reflective a cover returns much solar energy into space at a time of intense solar radiation.
Arctic sea ice growth over the past month has been second fastest in the MASIE recard – just behind last year.

masie_4km_allyears_extent_sqkm.csv
It appears that NASA simply made up the 1958 number, and assumed that no one would do any fact checking.
Posted in Uncategorized
Leave a comment