
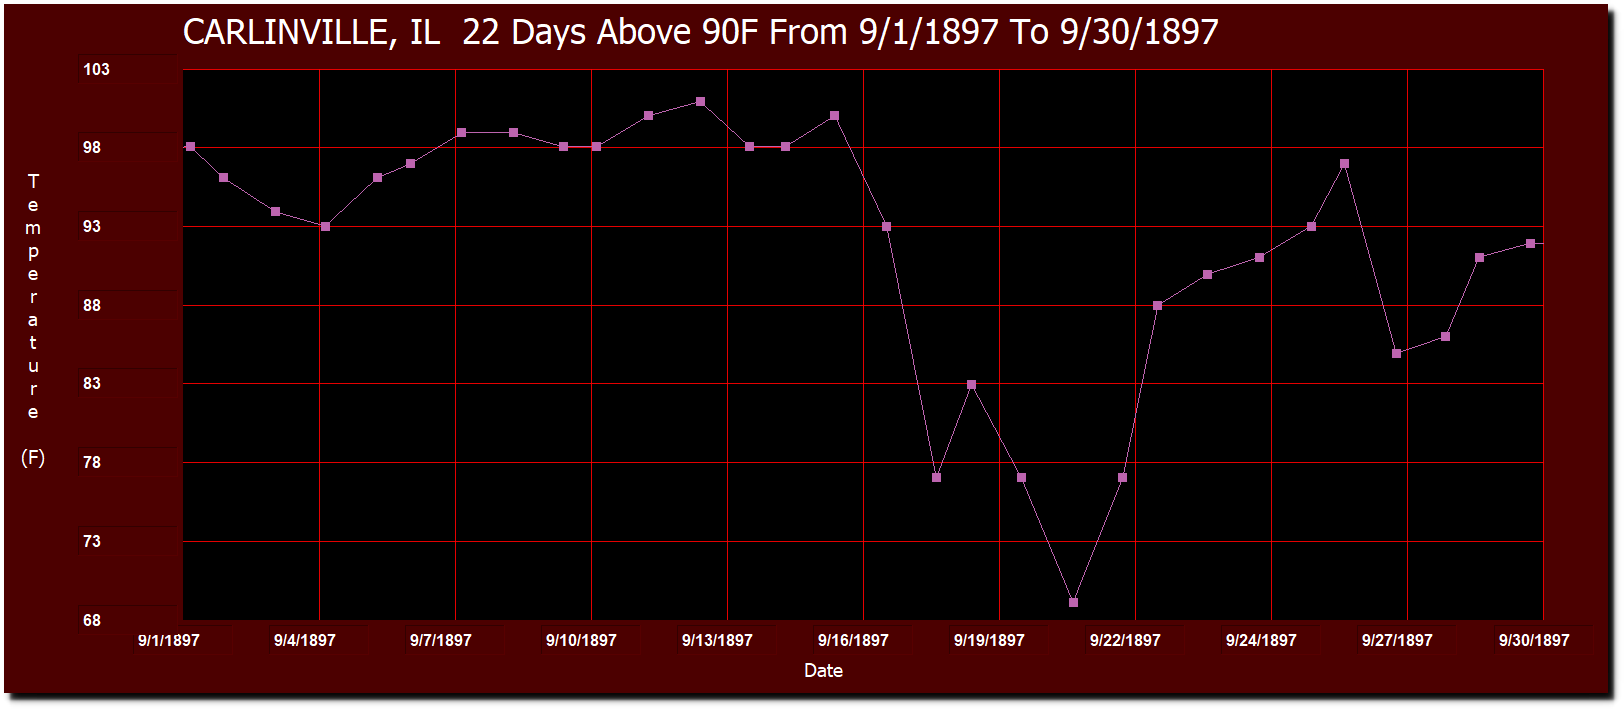
Carlinville, Illinois was over 90 degrees on twenty-two days during September, 1897. The peak temperature that month was 101 degrees, and the average maximum was 92 degrees.
Carlinville, Illinois was over 90 degrees on twenty-two days during September, 1897. The peak temperature that month was 101 degrees, and the average maximum was 92 degrees.
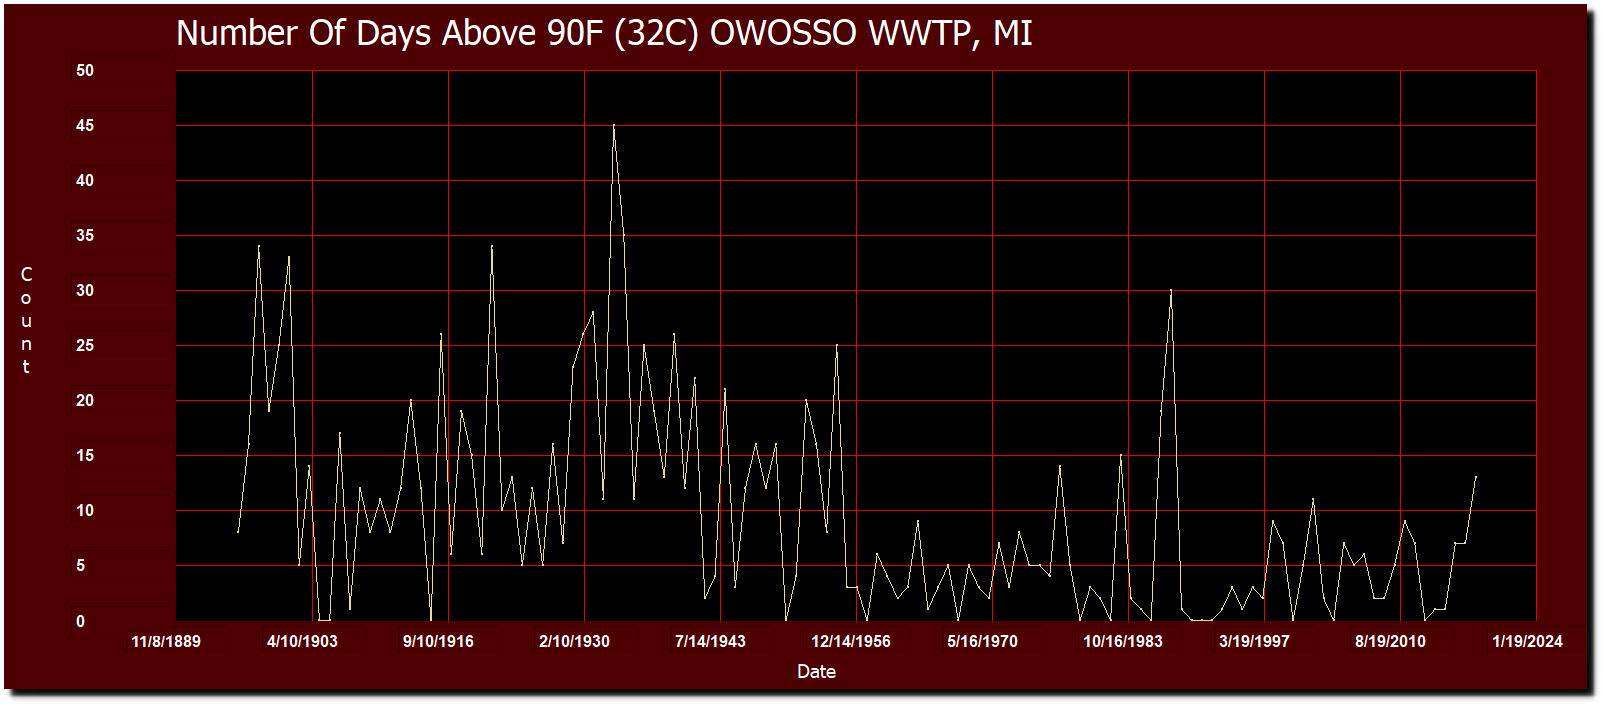
Prior to 1955, Owosso, Michigan averaged about seventeen days per year over 90F (32C.) Now they average less than five days over 90 degrees.
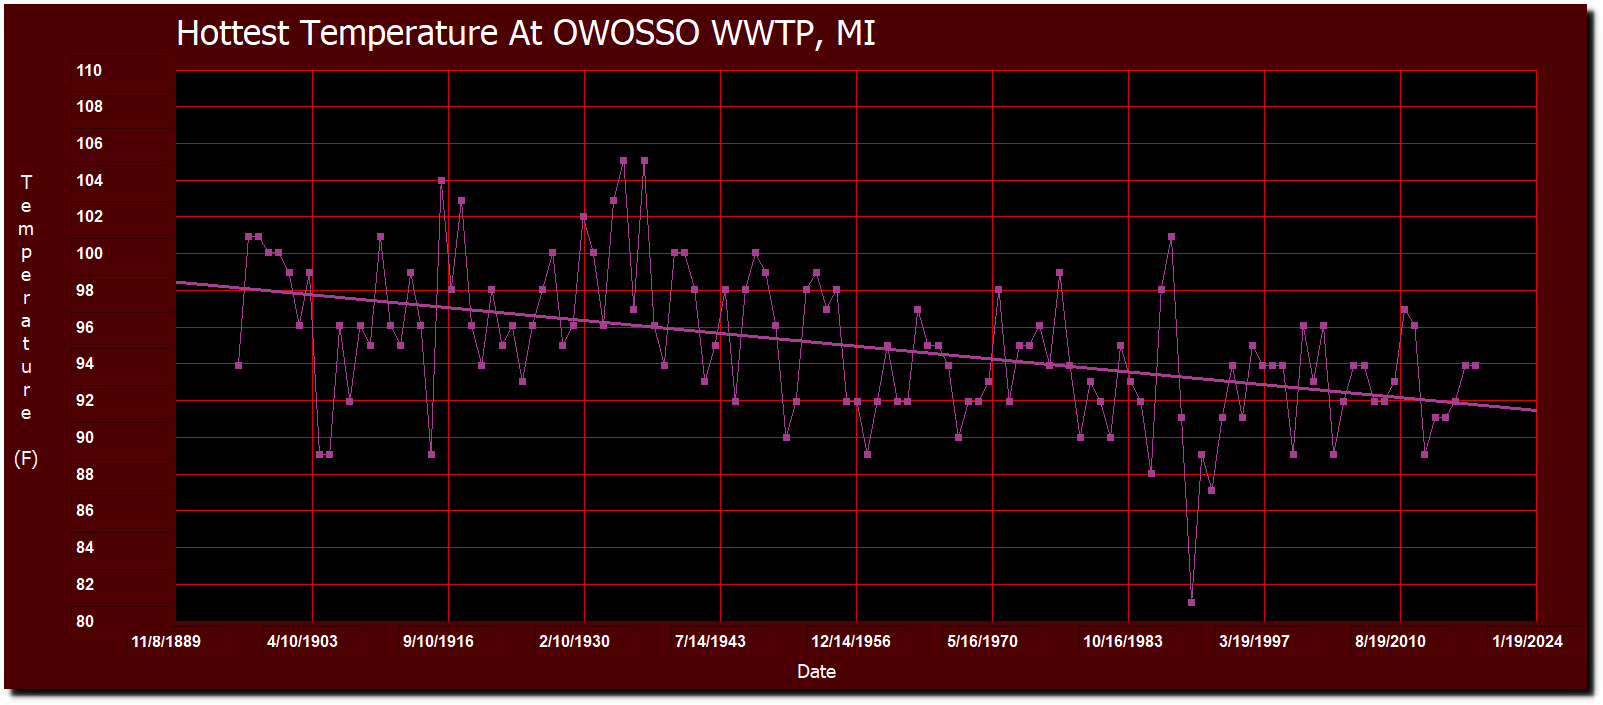
Peak temperatures at Owosso are declining at a rate of about five degrees per century.
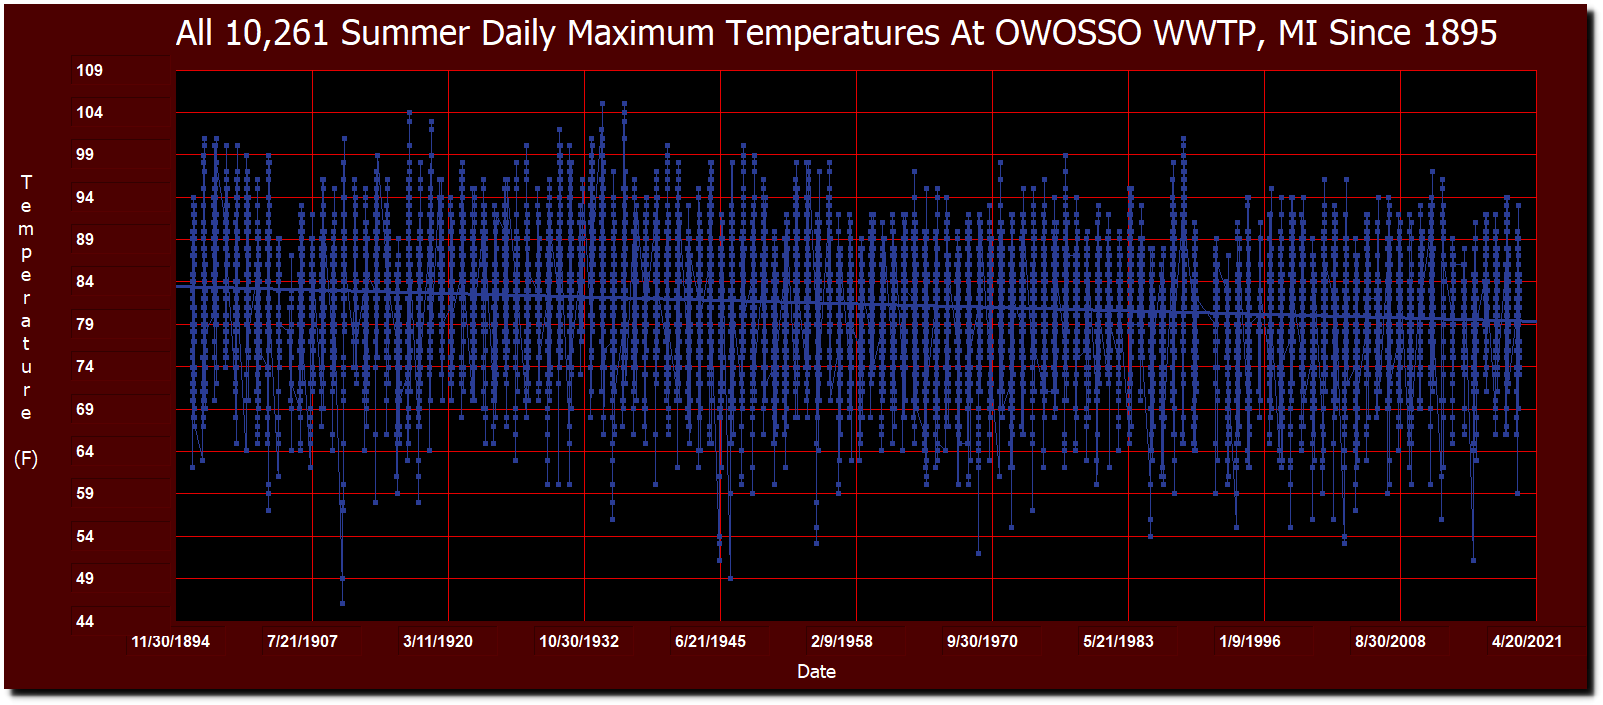
Summer daily maximum temperatures at Owosso are declining at a rate of 3.3 degrees per century.
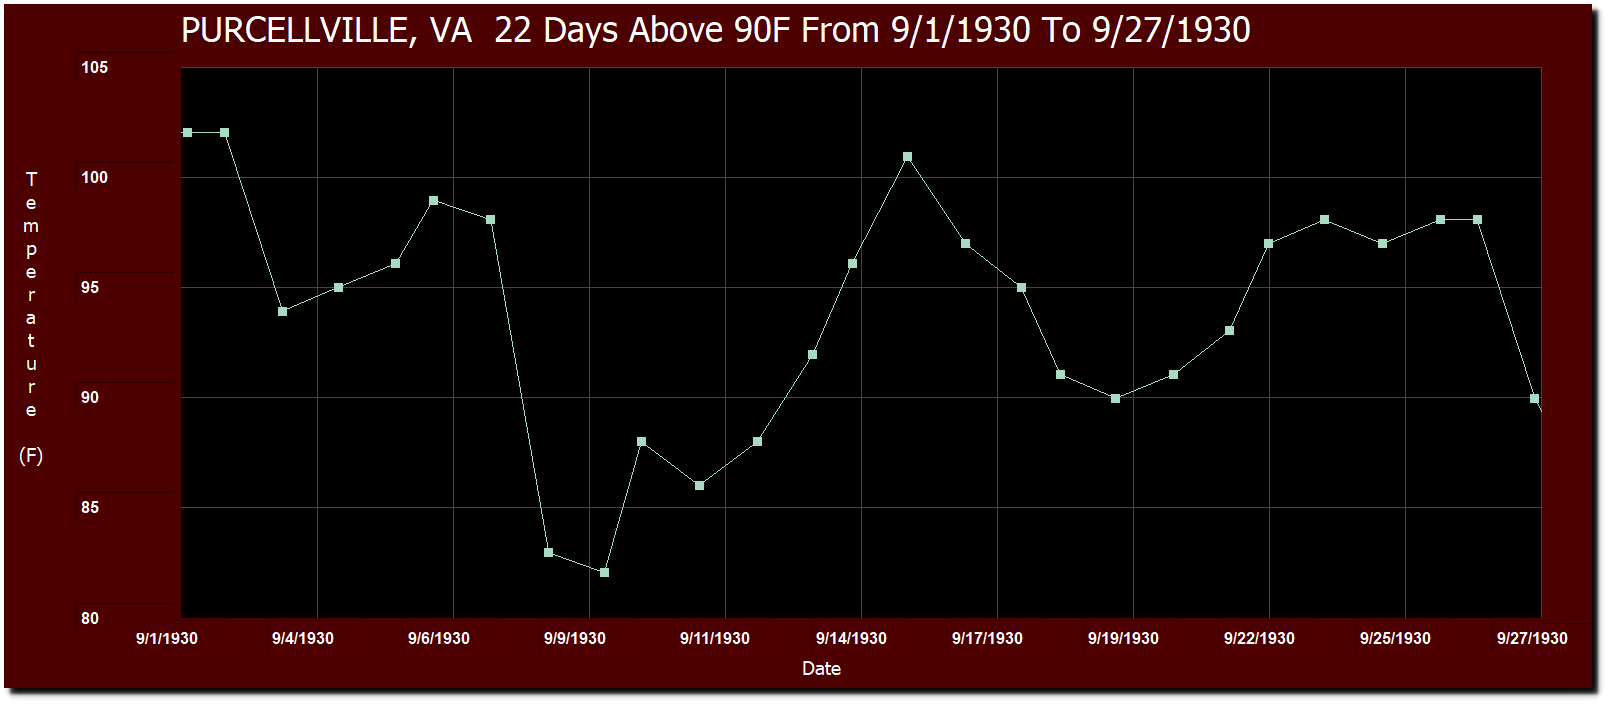
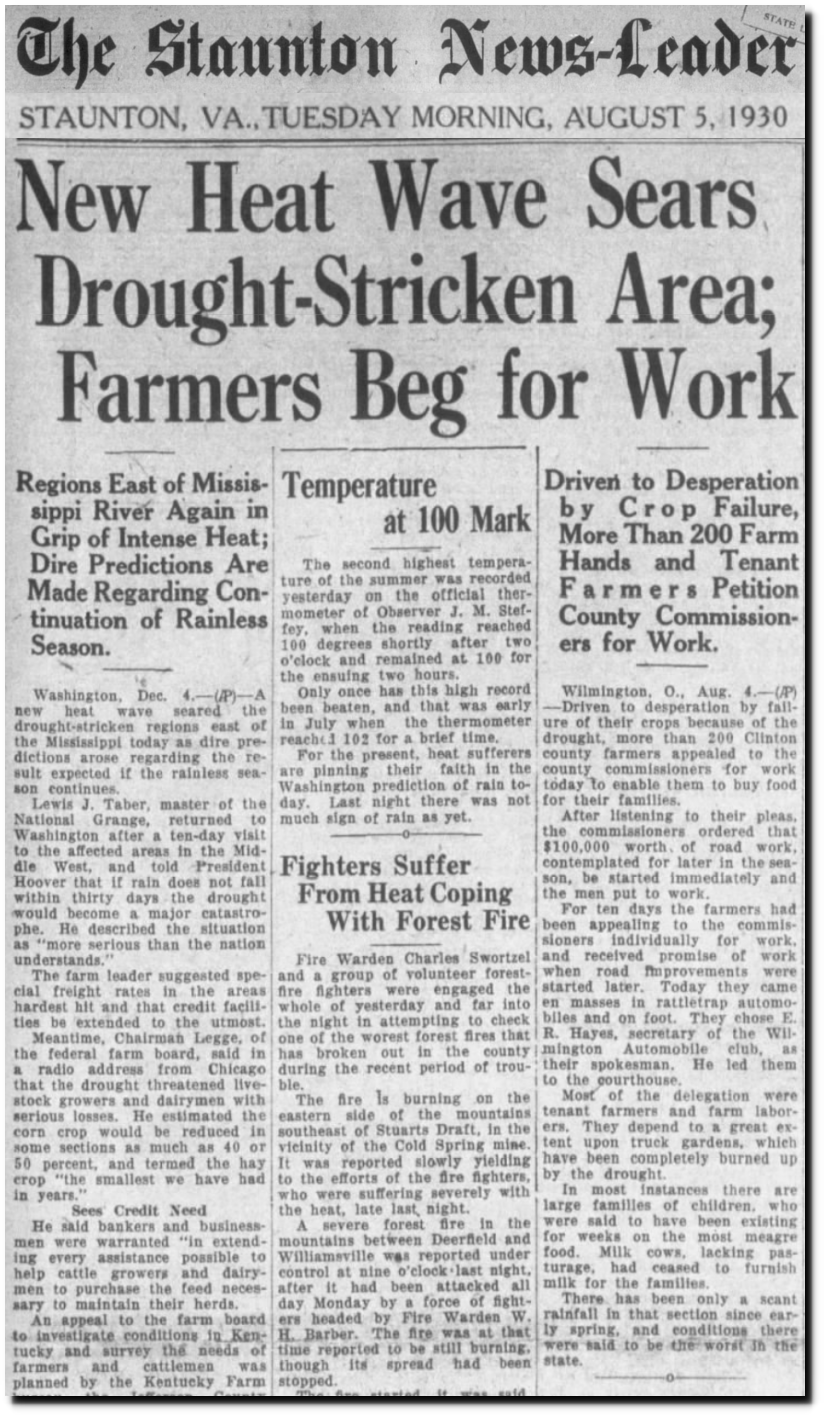
During September 1930, Purcellville, Virginia had twenty-two days over 90 degrees, three days over 100 degrees, and averaged 94 degrees from September 1 to September 27.
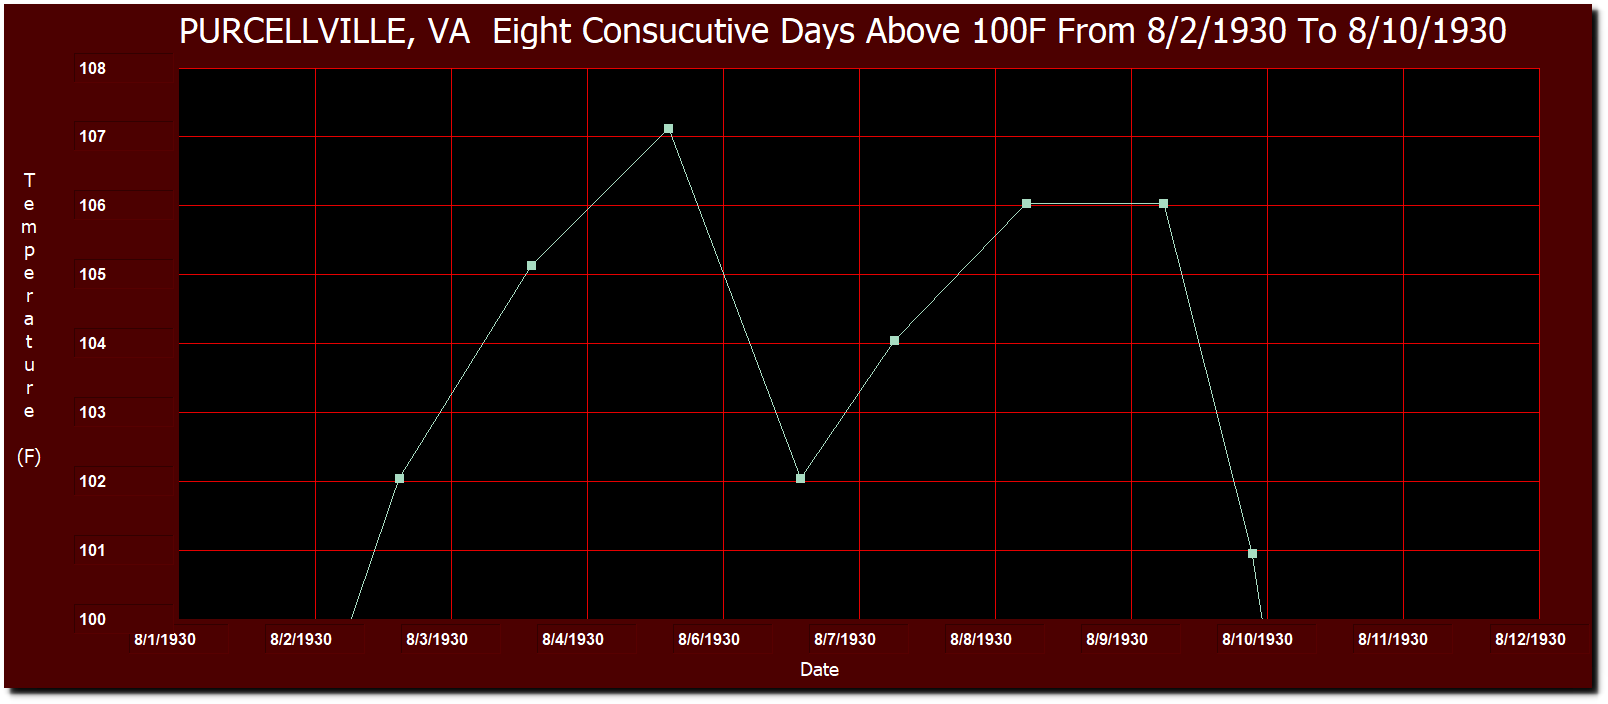
This came shortly after the all-time record heatwave of August, 1930 when they had eight days in a row over 100 degrees.
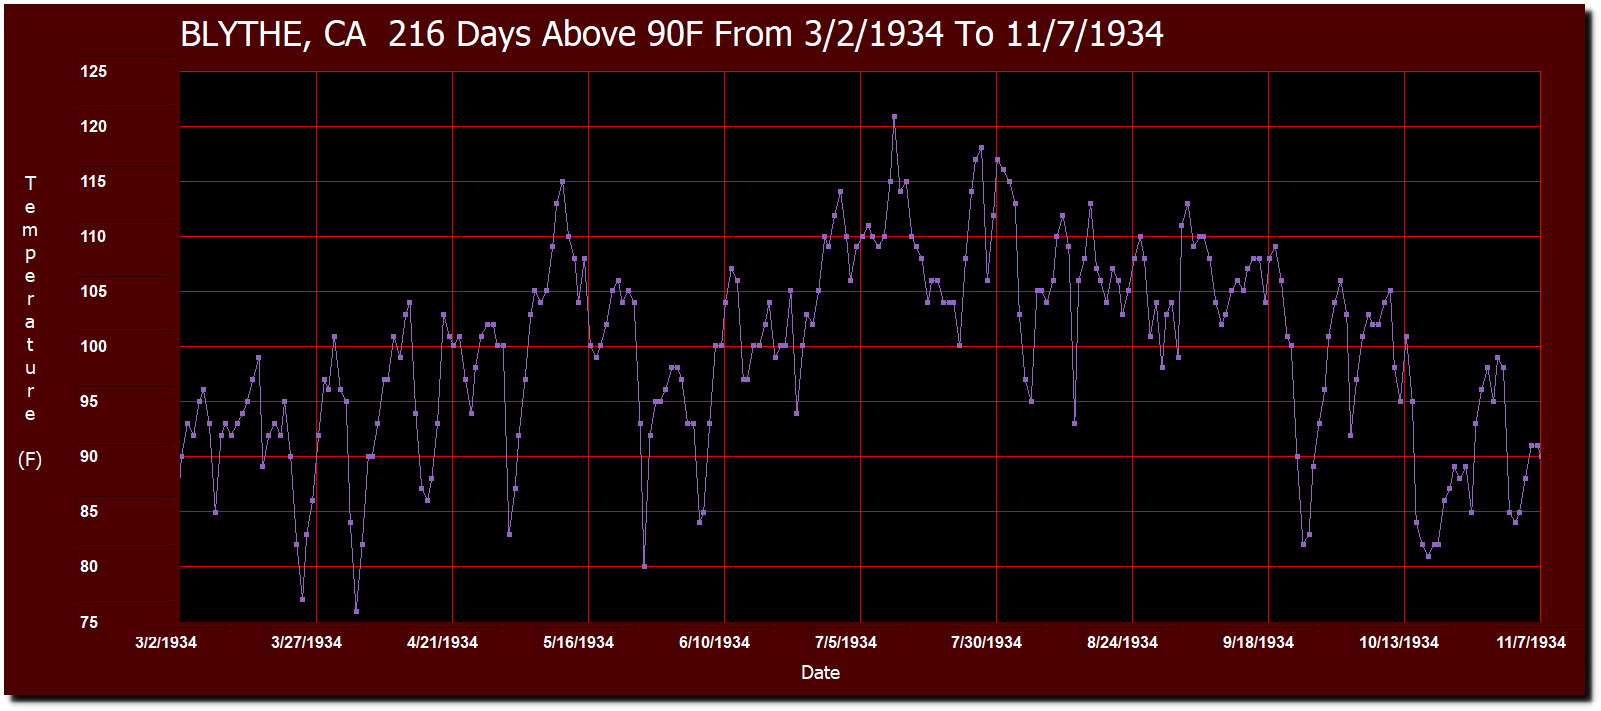
From March 2 to November 7, 1934, Blythe, California had 216 days over 90F (32C) and afternoon temperatures averaged 100F. The coolest day was April 3, which only got up to 76 degrees. That year was the hottest year on record in the US, so NASA simply altered the data to make it disappear.
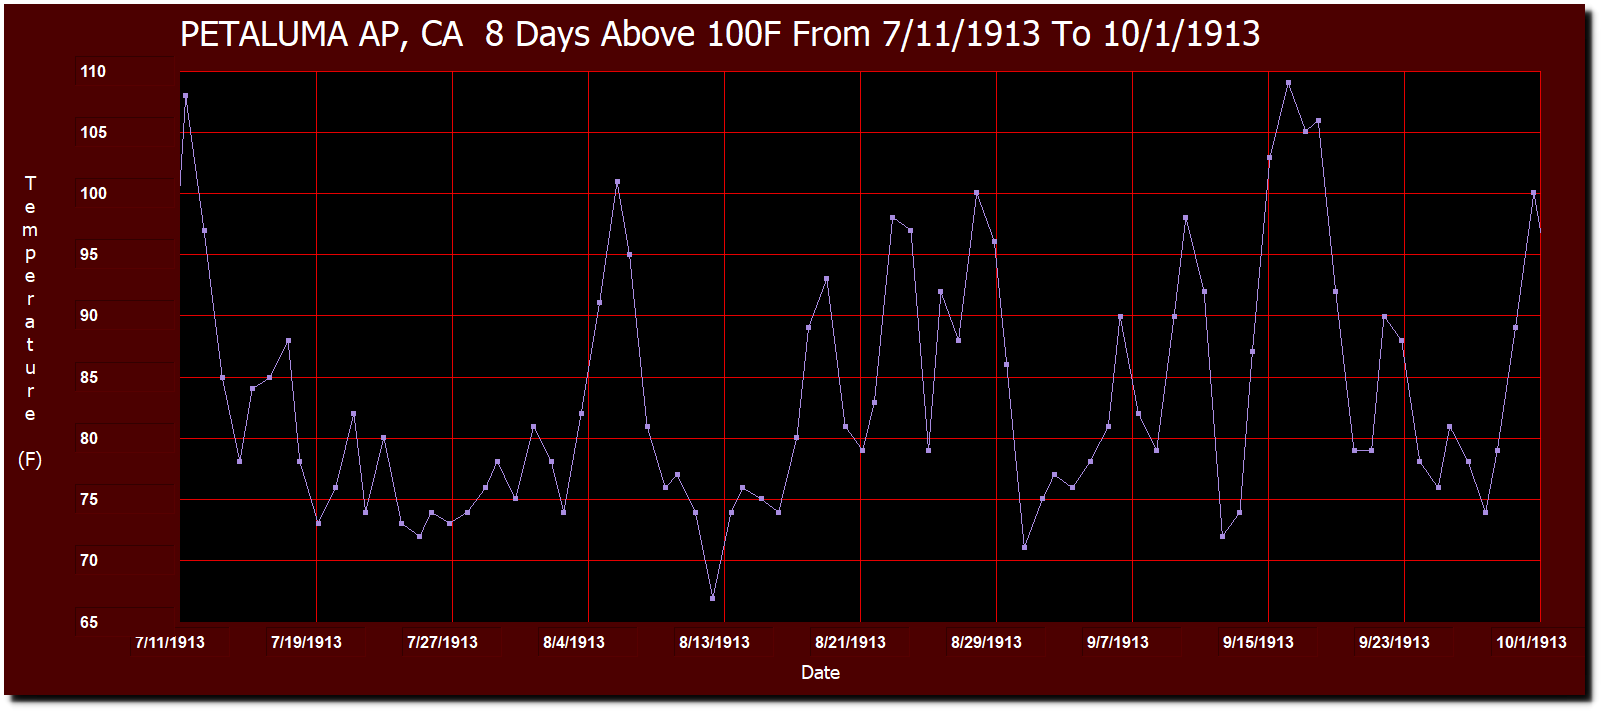
Petaluma, California is one of the most reliable weather gauges in California. They had eight days over 100F from July 11 to October 1, 1913.
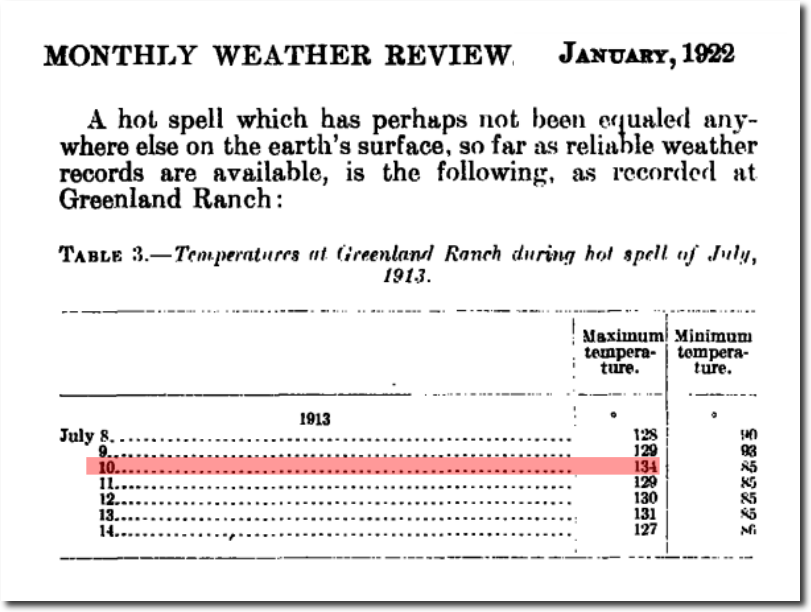
On July 10 that year, California set the world record temperature of 134 degrees.
Just when you thought climate alarmists couldn’t possibly get more ridiculous.

The Conversation’s ban on climate change ‘deniers’ fails basics of academic rigour
The world ended two years ago – no questions allowed.

Just 96 months to save world, says Prince Charles | The Independent
There has been little or no trend in Arctic sea ice extent since the start of MASIE records in 2006.

ftp://sidads.colorado.edu/DATASETS/NOAA/G02186/masie_4km_allyears_extent_sqkm.csv
University of Iowa professors Peter Thorne and Jerry Schnoor tell the world that Iowa will get a lot more 90 degree days in the future as a result of Iowa residents emitting CO2.

(67) Rob Hogg on Twitter: “Univ. of Iowa professors Peter Thorne and Jerry Schnoor
All evidence shows the exact opposite. The National Climate Assessment shows peak temperatures in Iowa much lower than prior to 60 years ago.
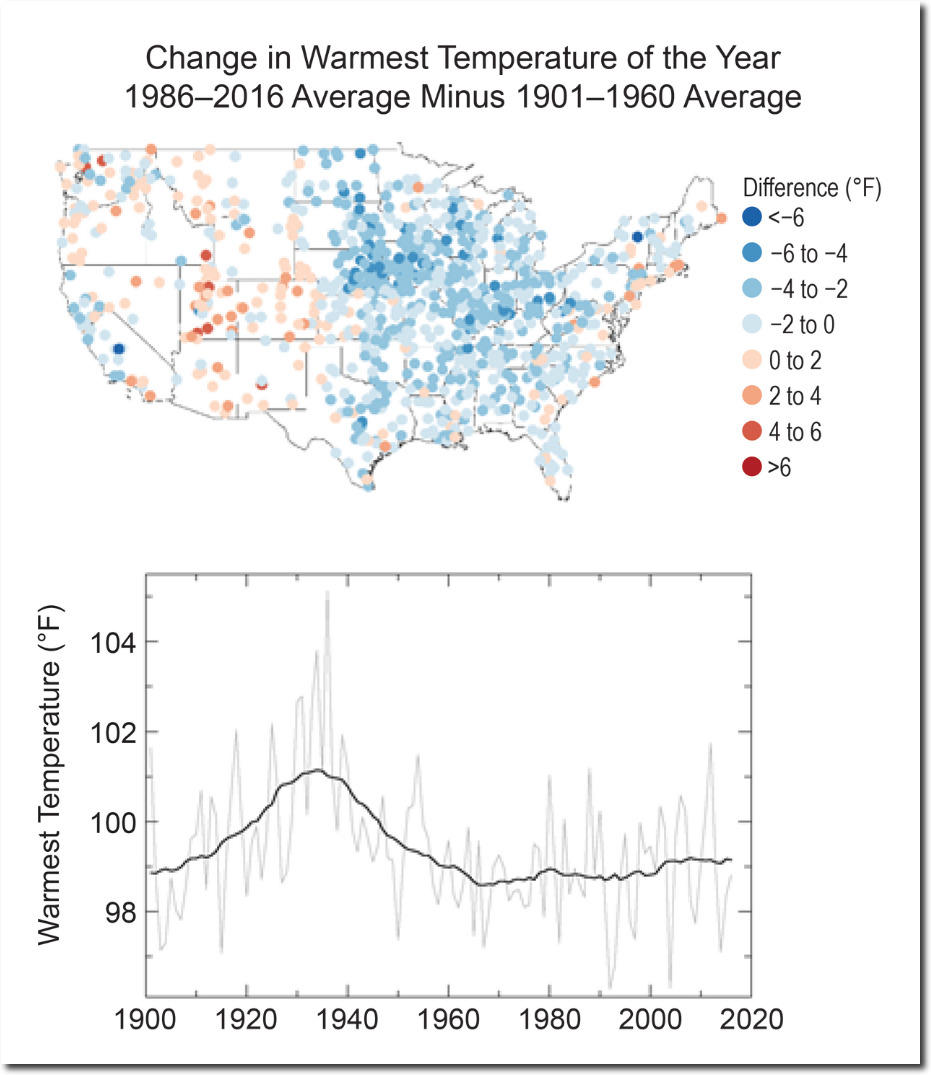
Temperature Changes in the United States – Climate Science Special Report
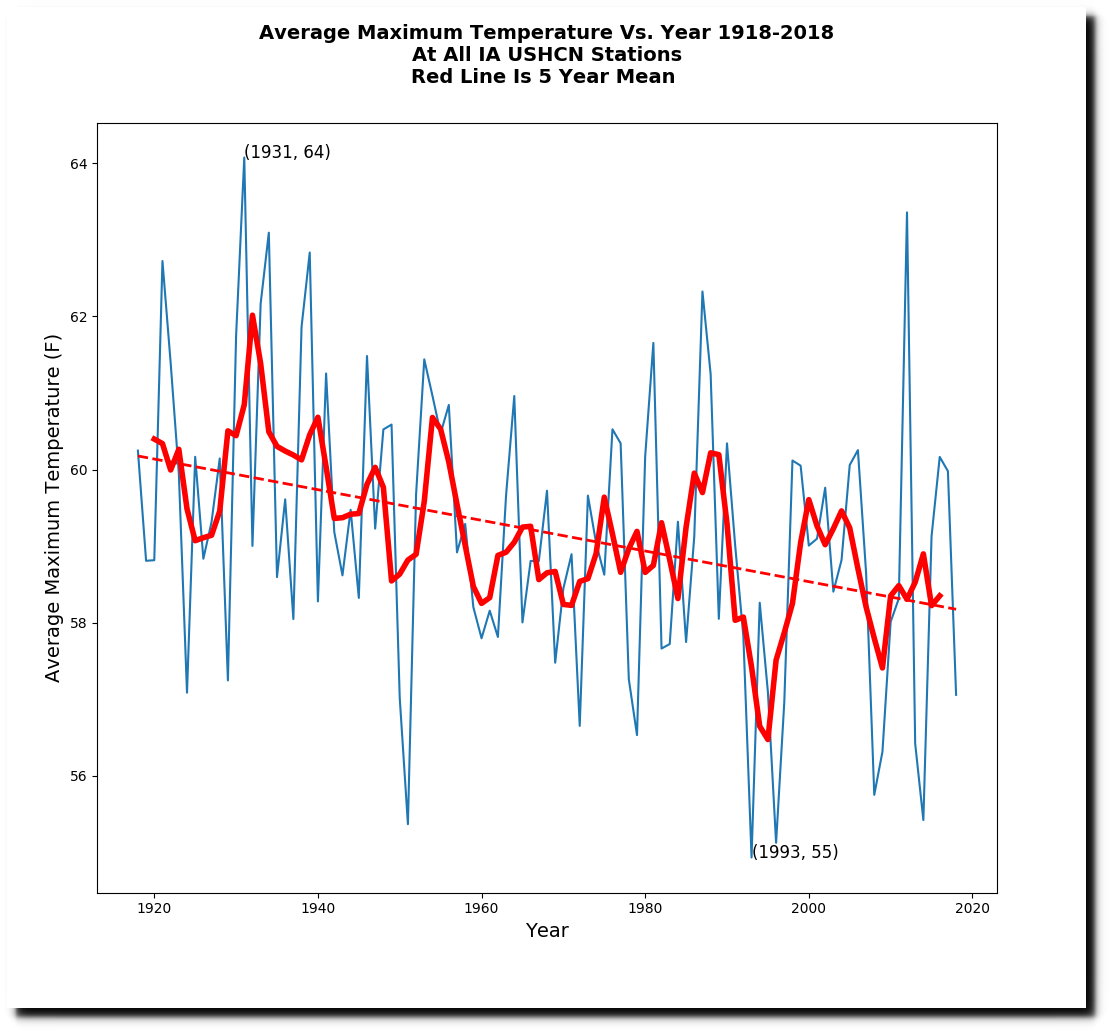
Average daily maximum temperatures in Iowa have plummeted over the past century.
The frequency of 90 degree days has plummeted in Iowa over the past century.
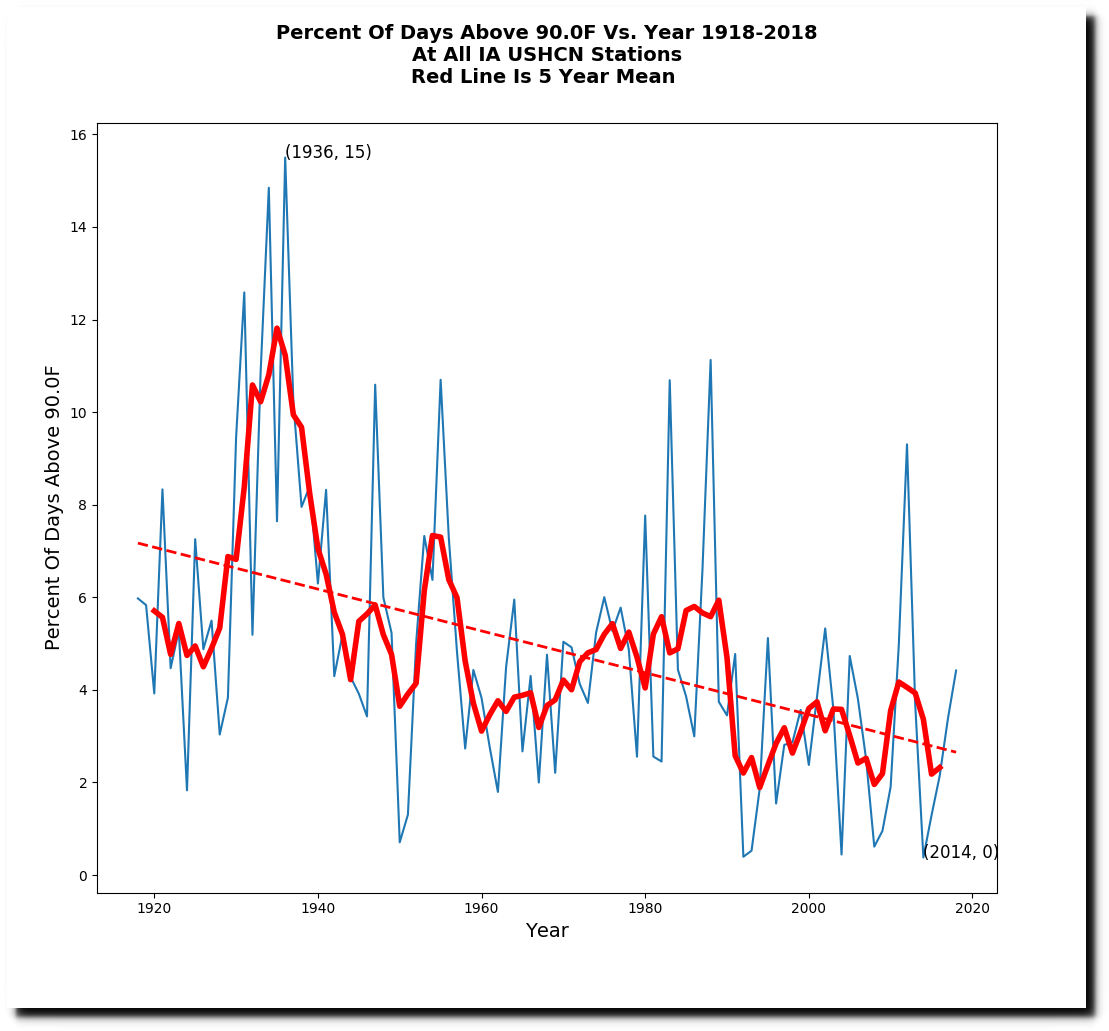
As CO2 levels have increased, the frequency of 90 degree days has plummeted.

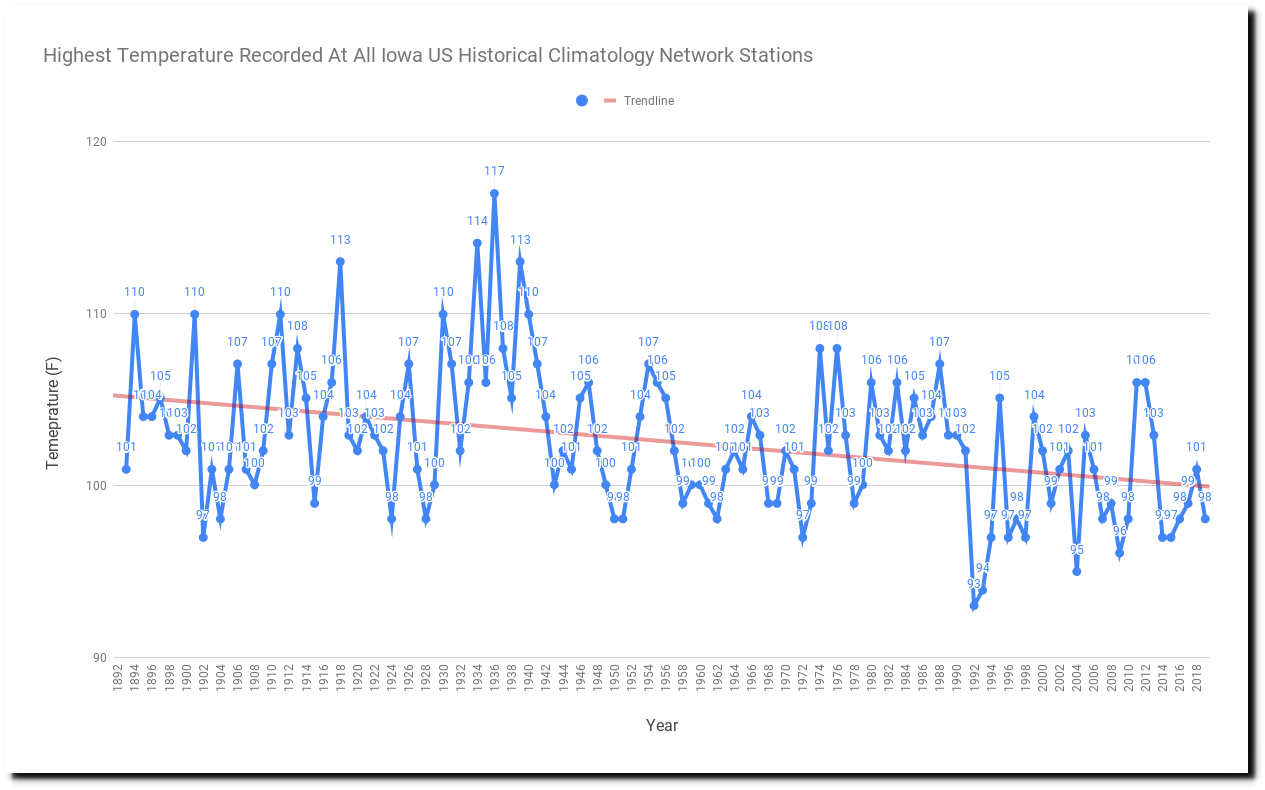
Peak temperatures in Iowa have plummeted.
The number of 100 degree temperature readings in Iowa has plummeted.
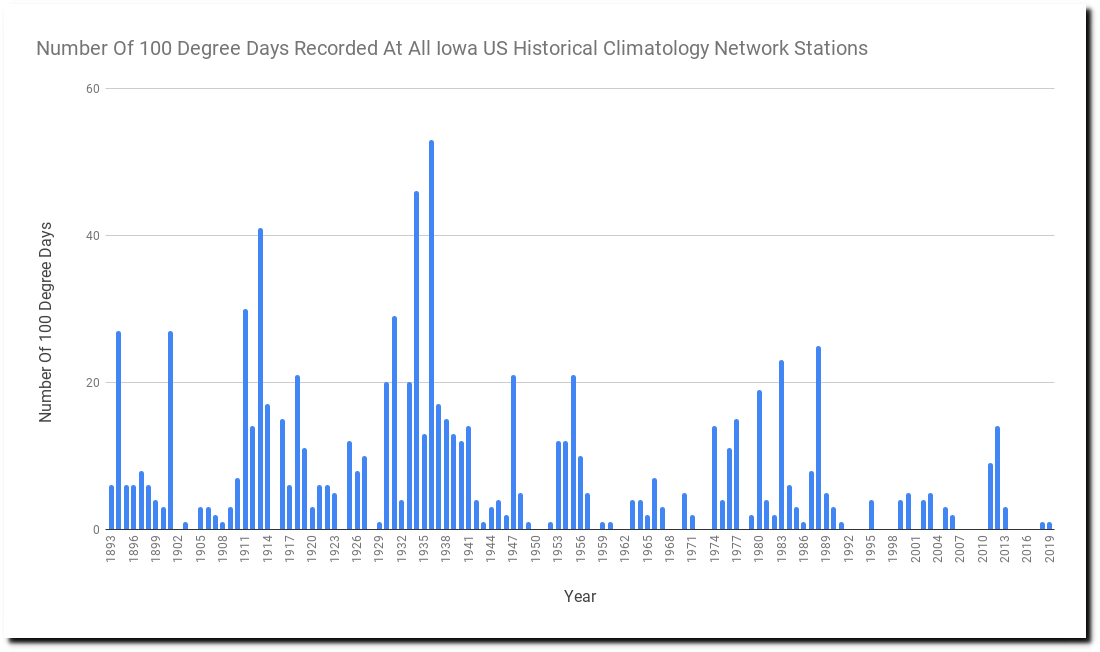

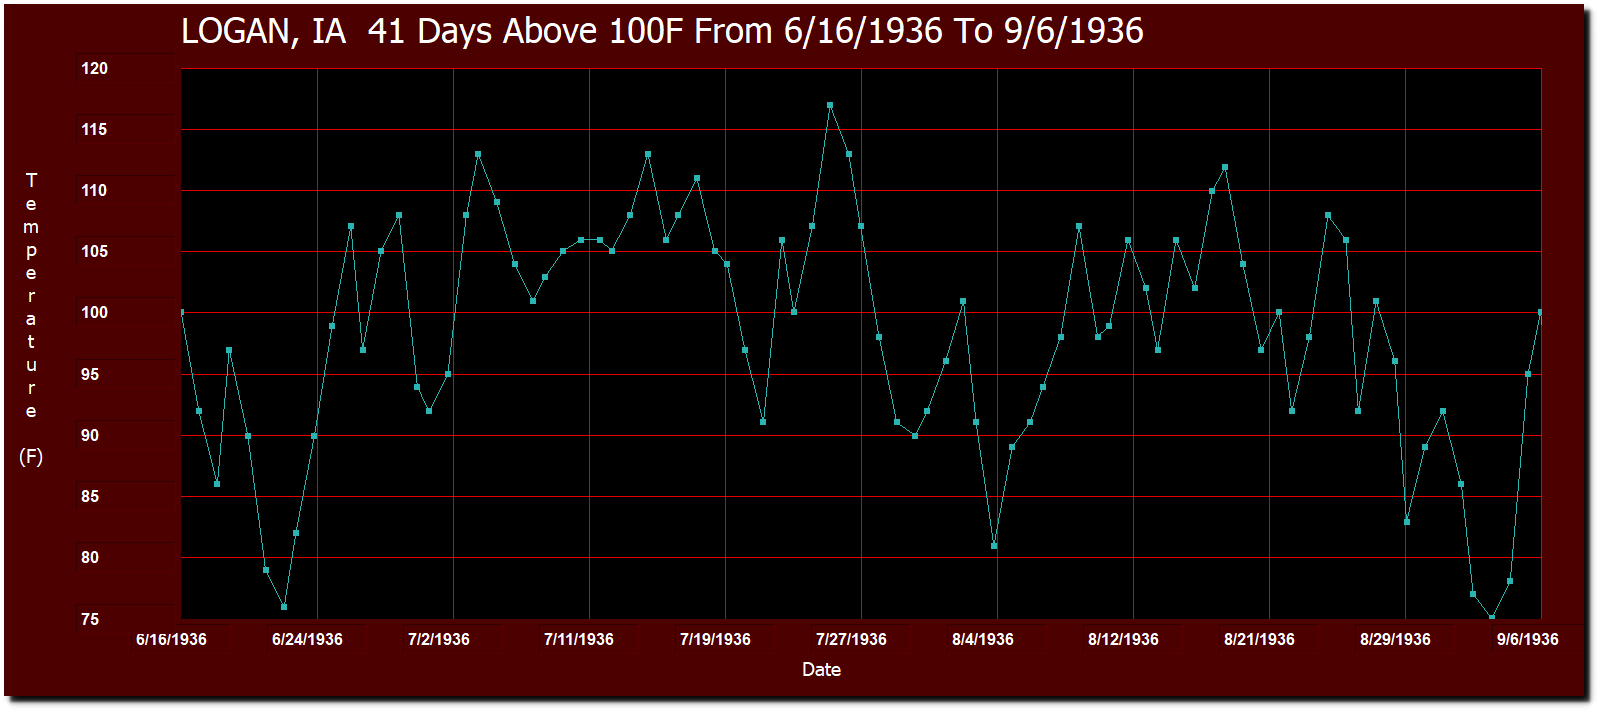
Iowa’s worst heatwave occurred in 1936, when Logan had 41 days over 100 degrees from June 16 to September 6.

14 Jul 1936, Page 1 – The Des Moines Register at Newspapers.com

08 Jul 1936, 10 – The Daily Times at Newspapers.com
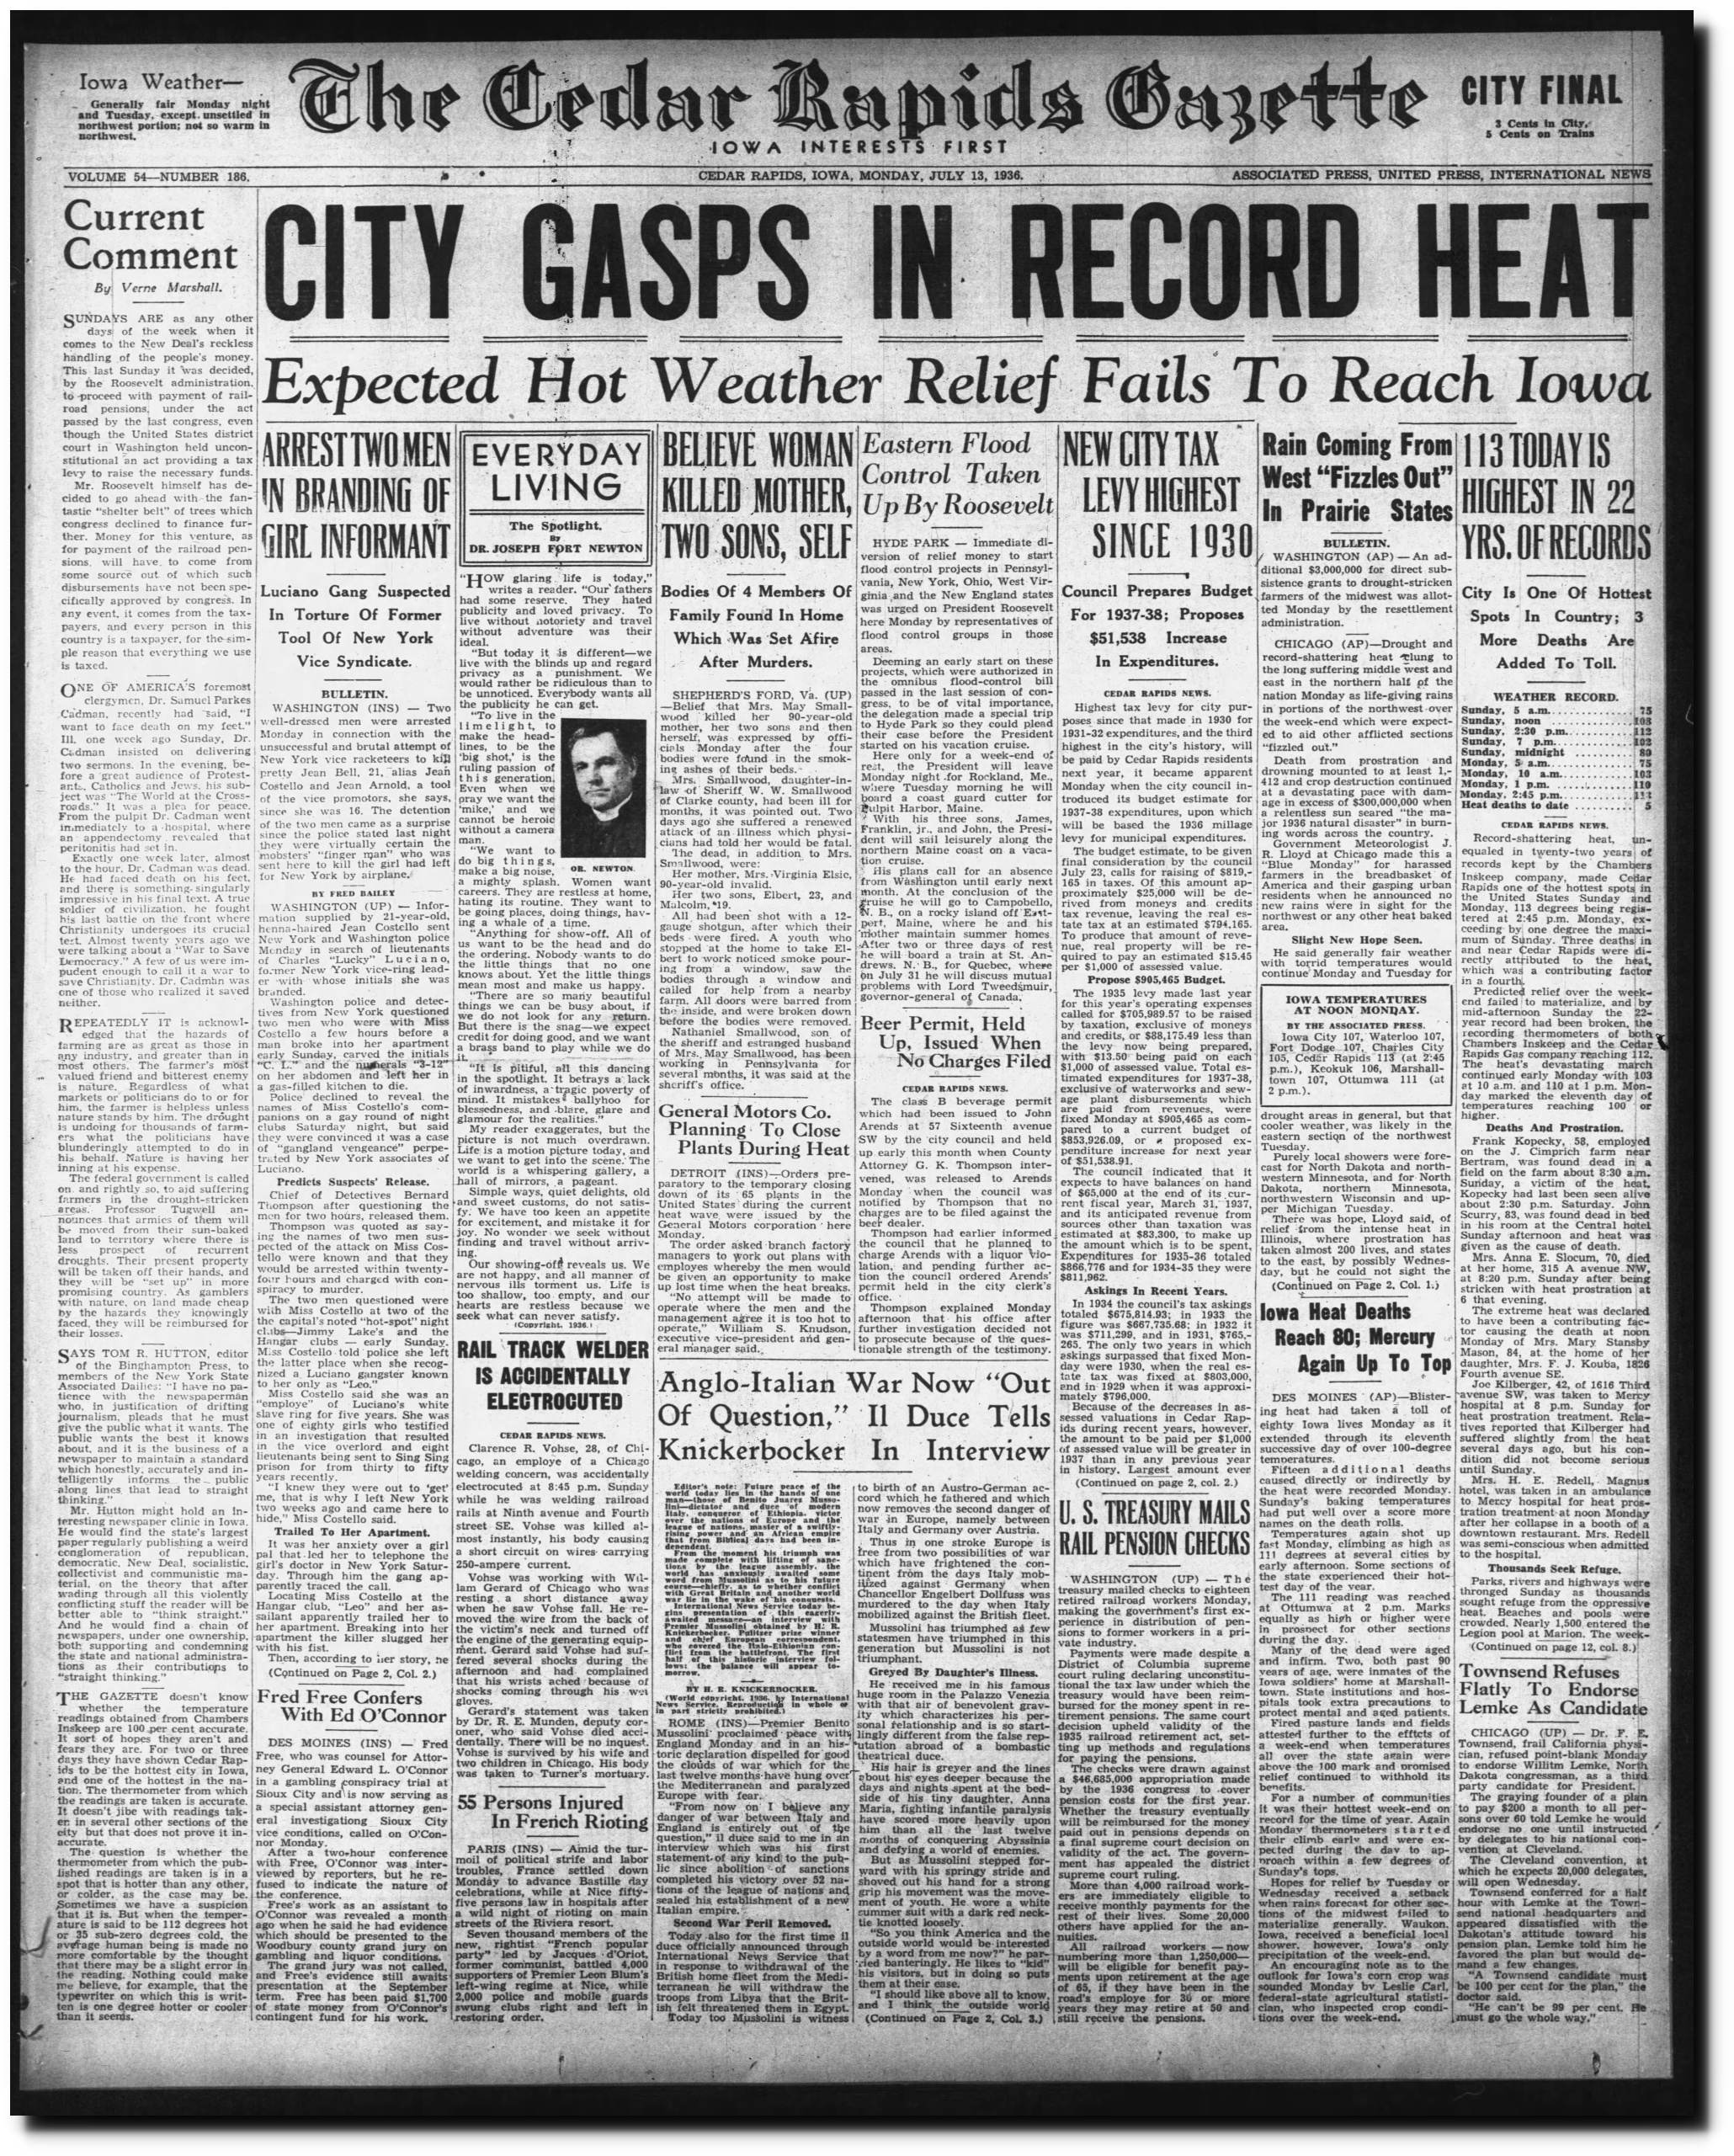
13 Jul 1936, 9 – The Gazette at Newspapers.com
Why are public health and engineering professors pretending they are climate prophets? They obviously didn’t do any research.

Peter S. Thorne – University of Iowa College of Public Health

Jerald L. Schnoor | College of Engineering | The University of Iowa

Peter Thorne: Communicating the best available science – University of Iowa College of Public Health

Center for Global & Regional Environmental Research
Professors Peter Thorne and Jerry Schnoor are simply making numbers up. There is no evidence to back up their claims, and it is absurd to suggest that Iowans can control atmospheric CO2 levels – as China and India build hundreds of new coal fired power plants.
