The February Blizzard Of 1958

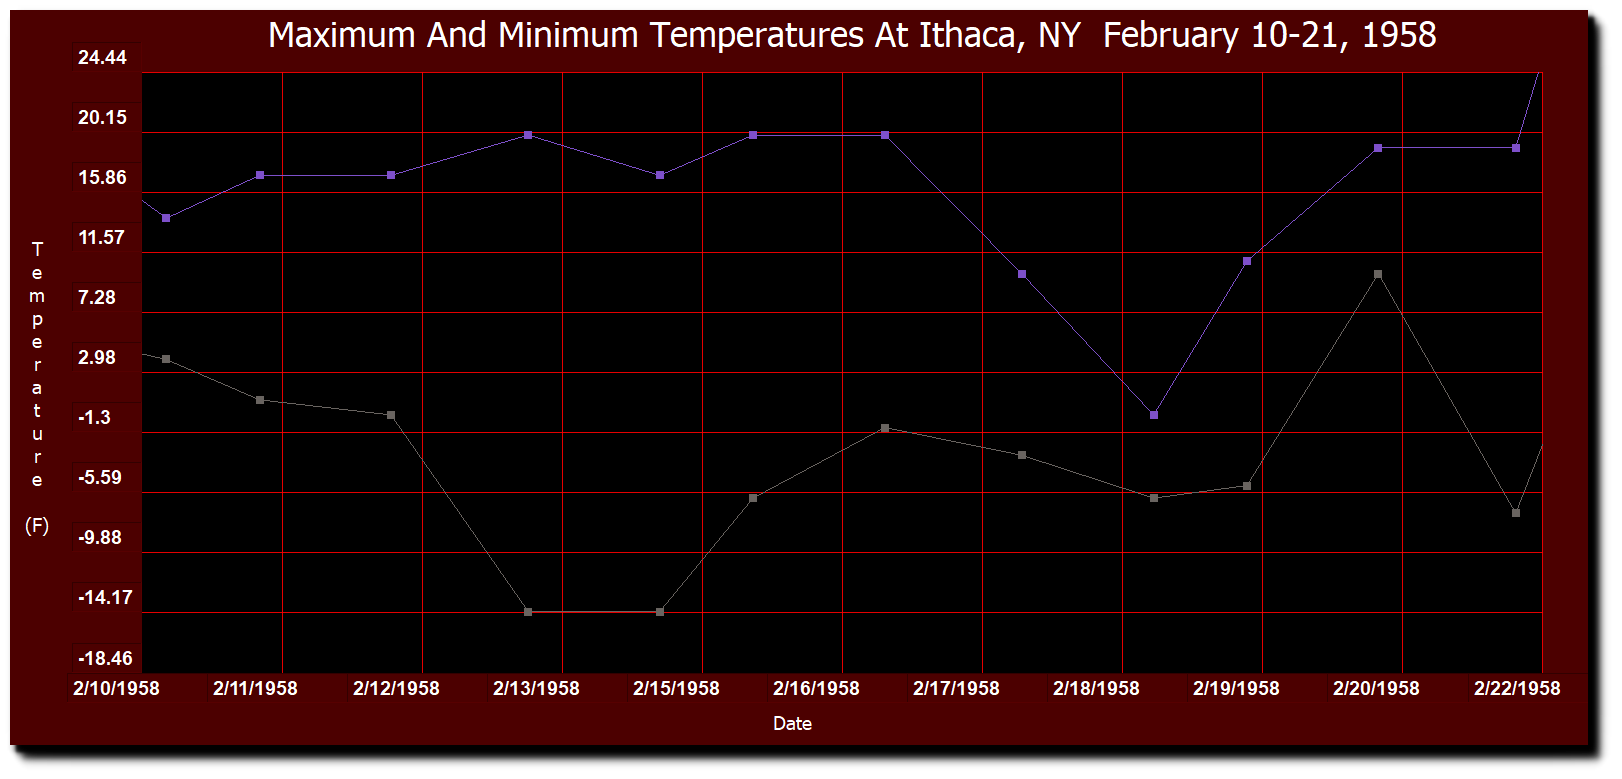
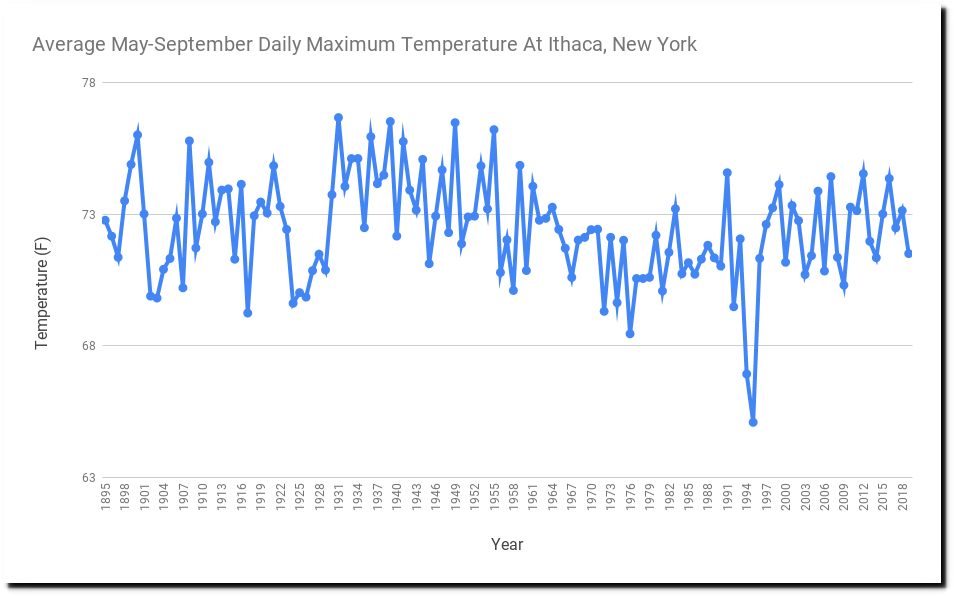
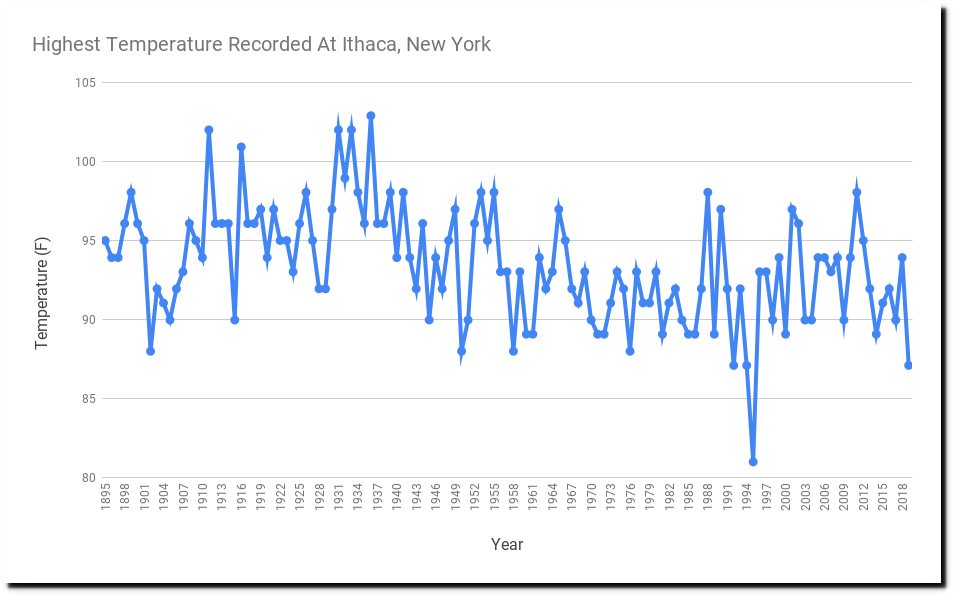
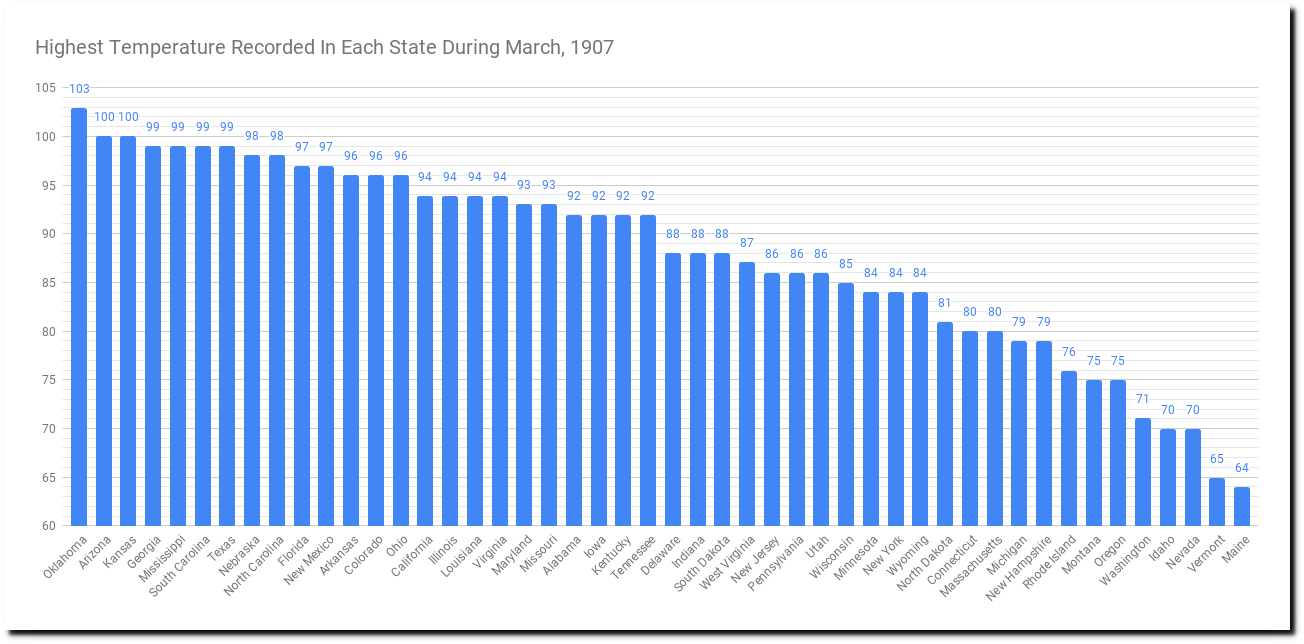
I’m visiting friends at the Finger Lakes in NY, where my life started. One of them grew up on a farm there in the 1950s and told me about a terrible blizzard in February, 1958 which cut them off for weeks and forced them to dump all of the milk they were producing -because there was no way to get to market. So I did some research and found out that Ithaca never made it above 20F from February 10-21, 1958.

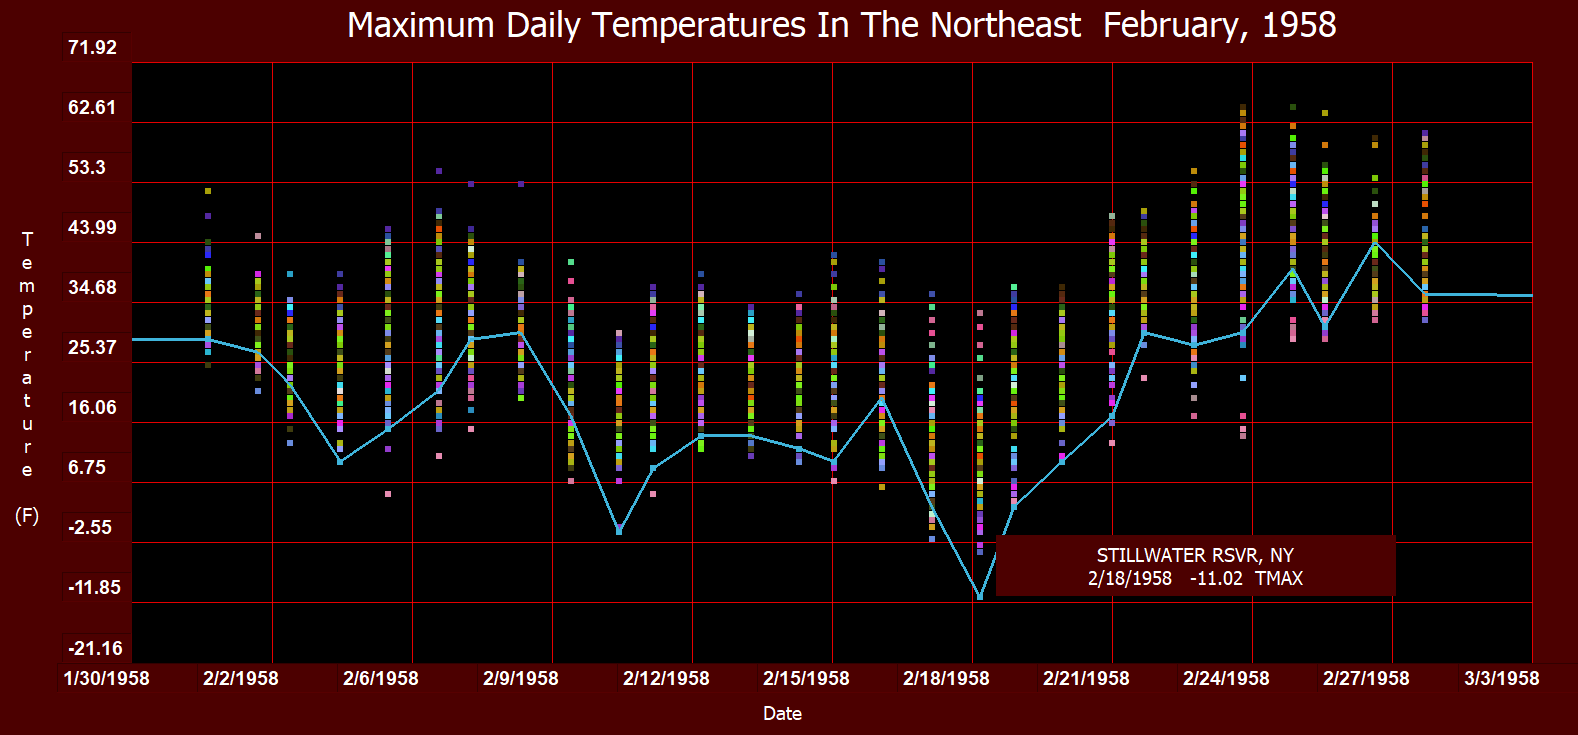
Stillwater Reservoir, New York never made it above -11F on February 18.

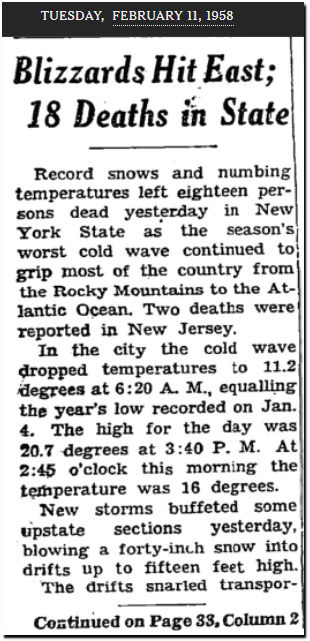
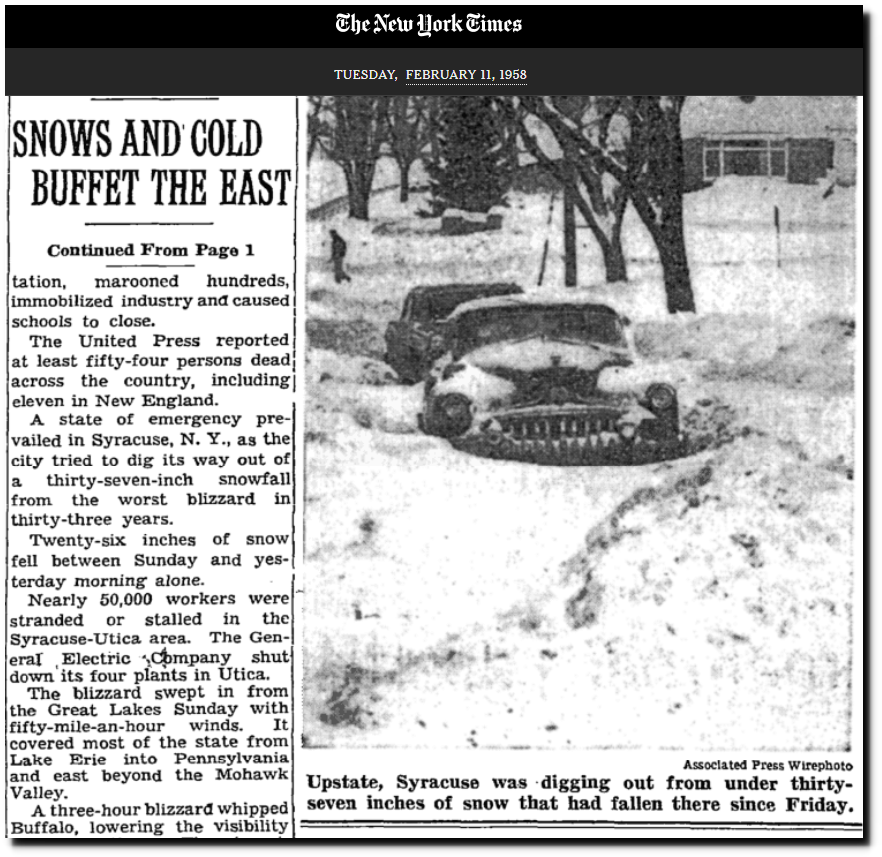
TimesMachine: February 11, 1958 – NYTimes.com

Florida’s vegetable crop was wiped out by the cold.

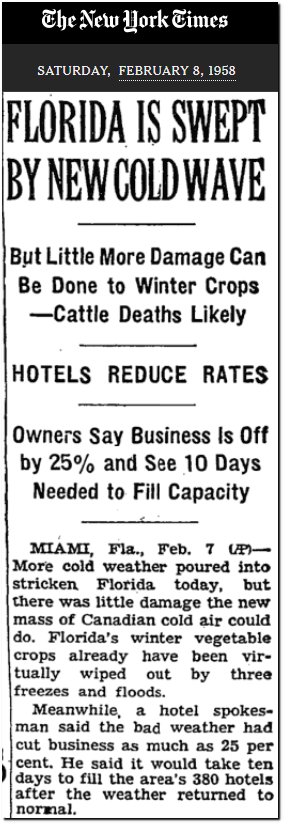
TimesMachine: February 8, 1958 – NYTimes.com

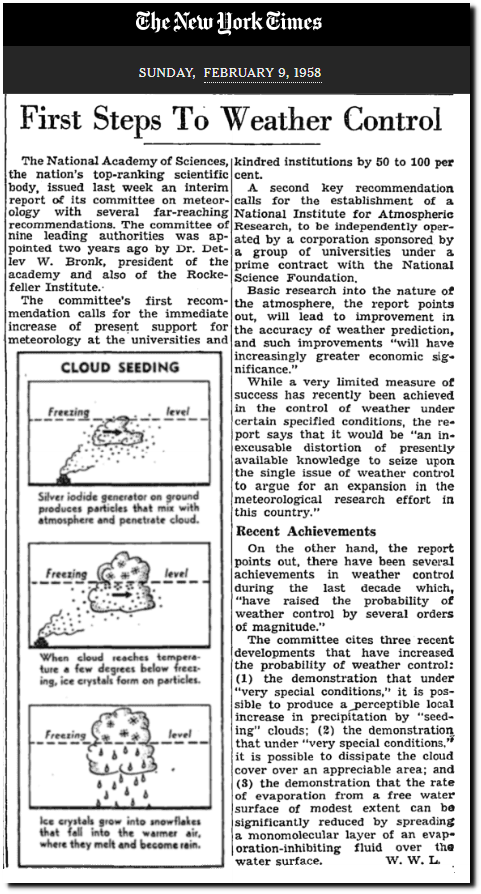
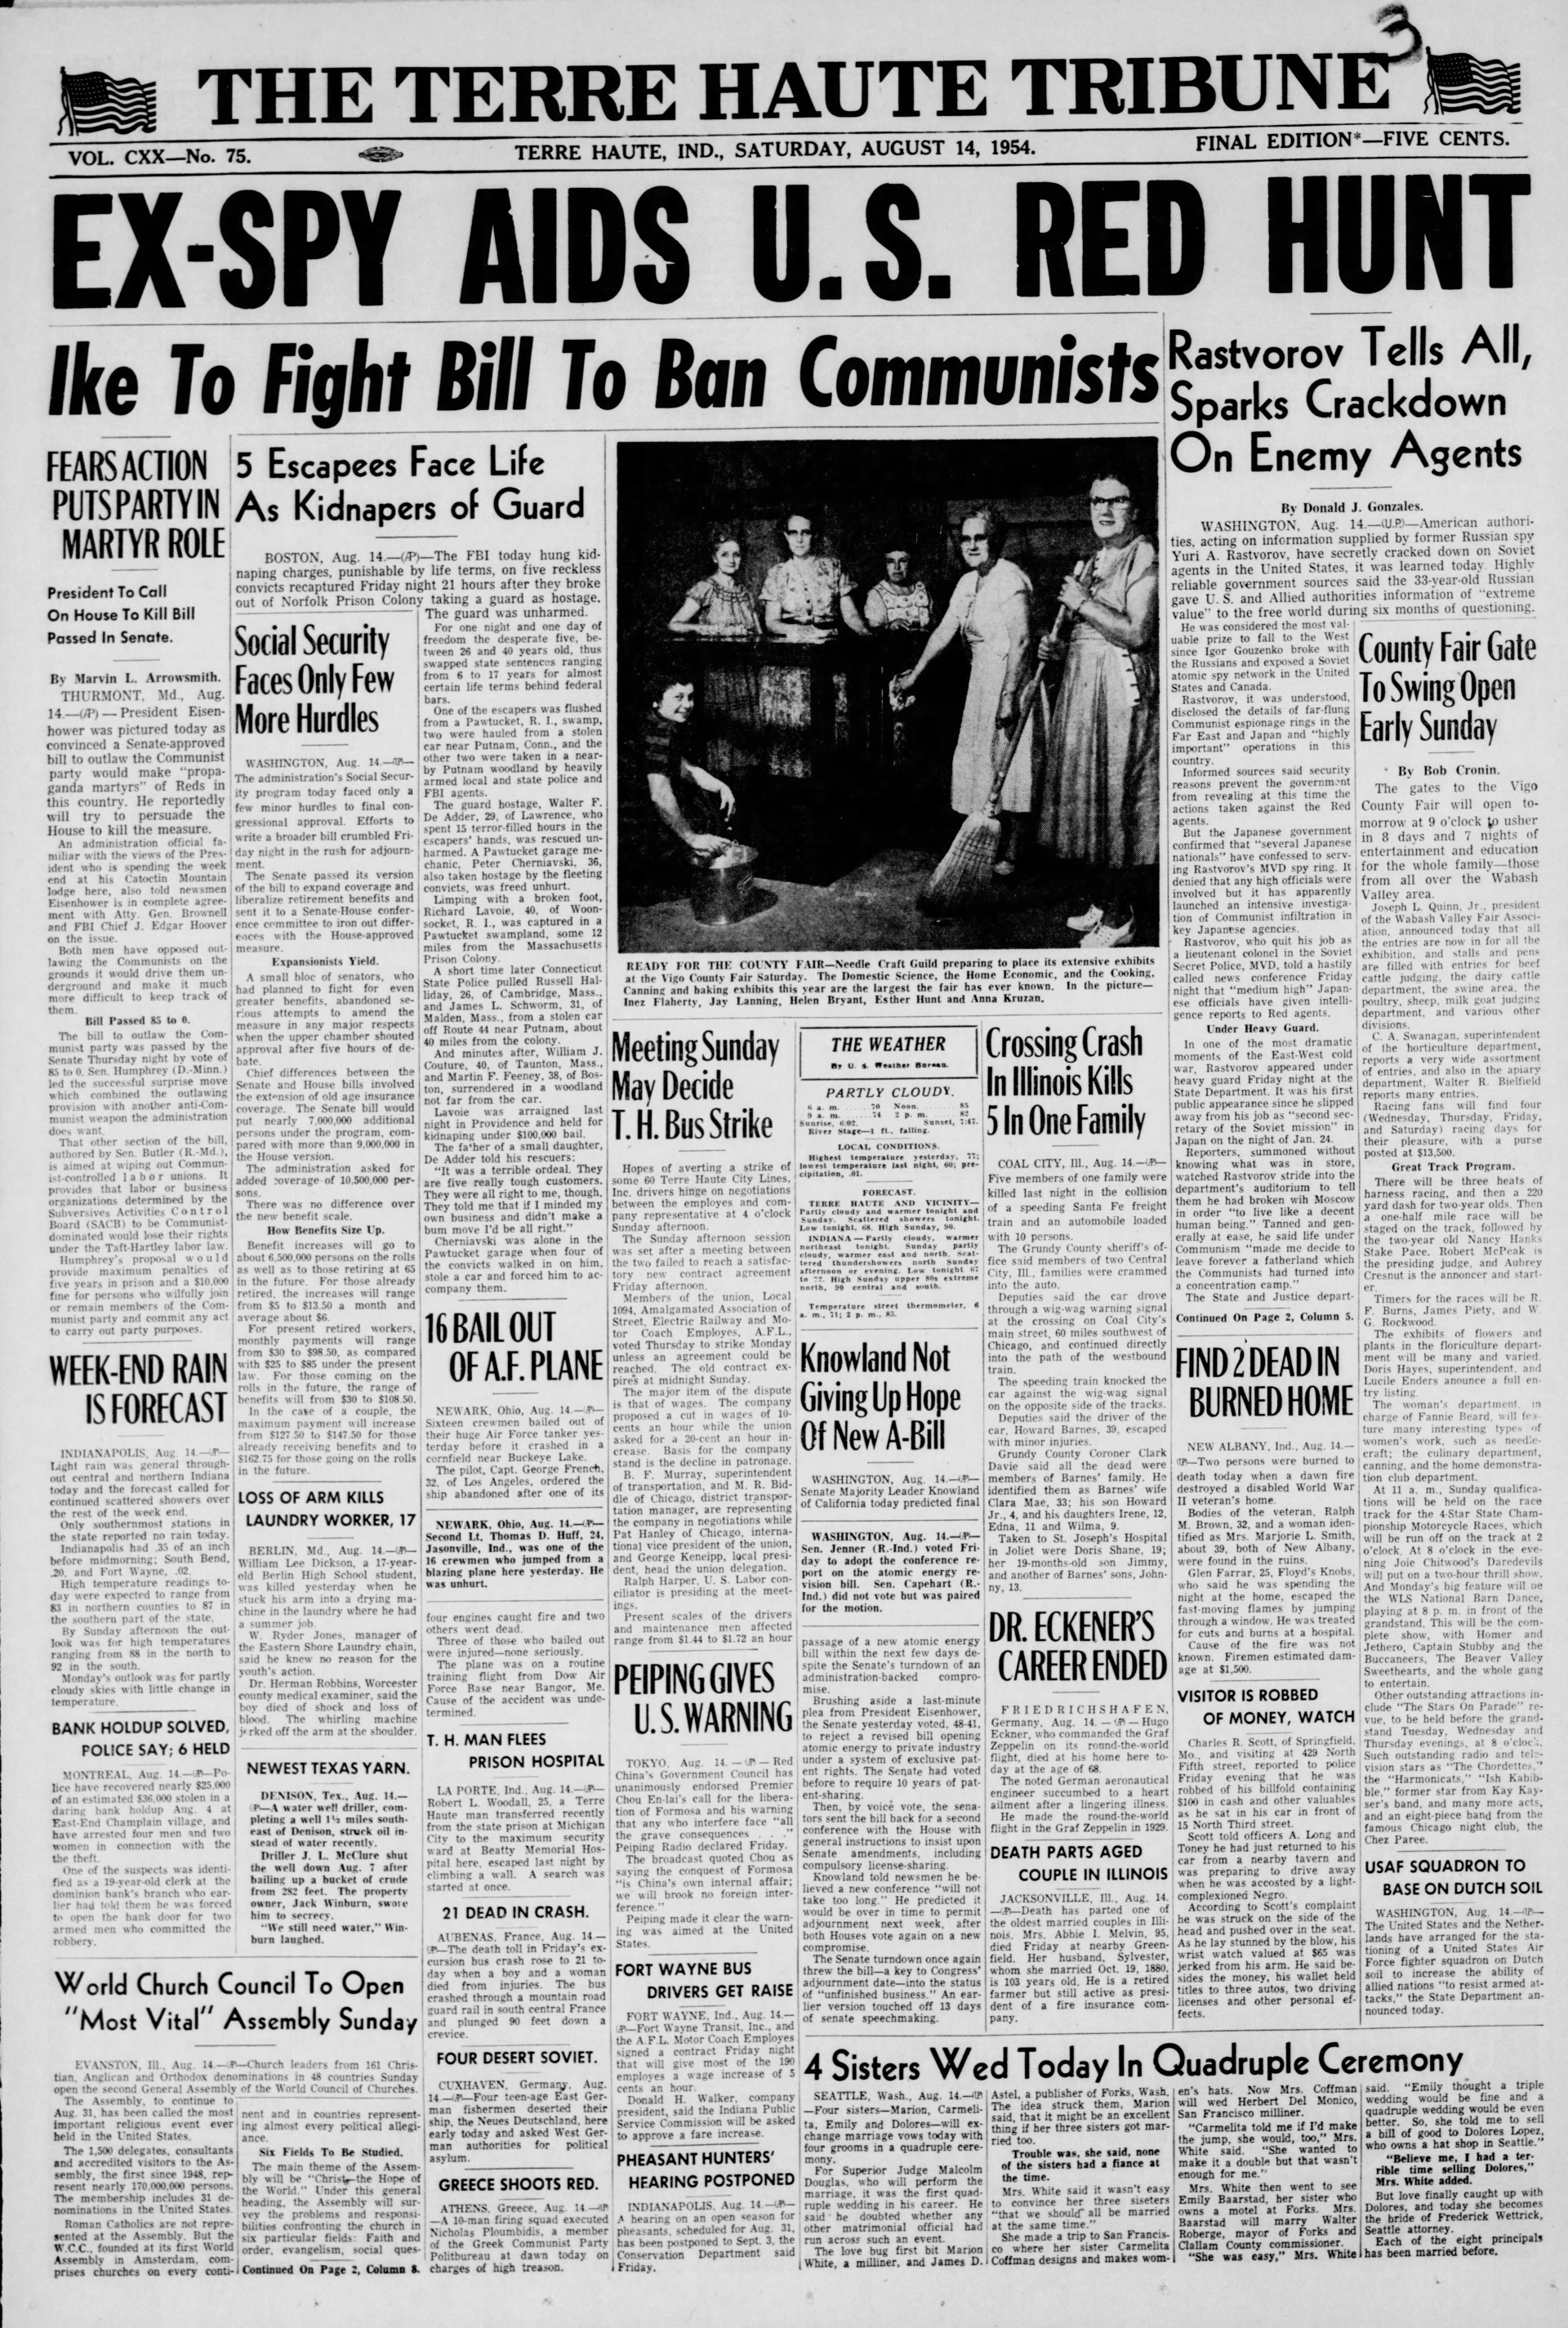
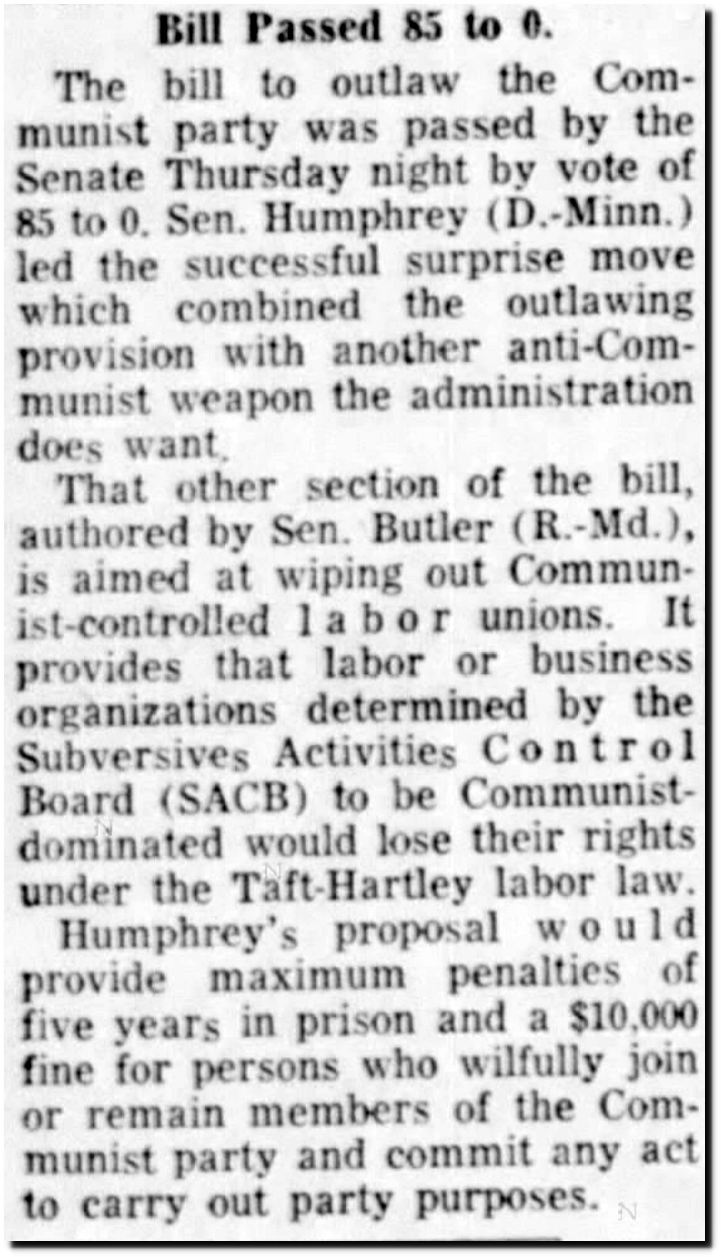
And the National Academy of Sciences said they could control the weather if you sent them money. They called for the creation of a National Center for Atmospheric Research, which now exists in Boulder, gets 180 million dollars in taxpayer money per year, and generates many wildly fraudulent claims about the climate – which I will be discussing more soon.

TimesMachine: February 9, 1958 – NYTimes.com

Posted in Uncategorized | Leave a comment

Picking Cherries In New York Wine Country

I was born in New Mexico, but my life began in Ithaca, New York. I am in the spectacular Finger Lakes country for a few days, and thought I would check in with the New York Times about the future climate here.

How Much Hotter Is Your Hometown Than When You Were Born? – The New York Times

The New York Times has dates going back to 1921 in their menu – but if you submit a date before 1960, this message comes up:

Our dataset goes back to 1960

There is plenty of data from before 1960. But they hide it because it completely destroys their “climate change” propaganda. Ithaca was much hotter when CO2 levels were lower. The 1960 start date is carefully cherry-picked.

Then they make a forecast of Ithaca burning up, based on hiding historical data and models which are completely discredited by the data they are hiding.

Ithaca was much hotter before I was born. But the New York Times has no interest in facts. They are pushing propaganda towards a political goal.

Posted in Uncategorized | Leave a comment

Climate Glossary

Climate science is complex, and the terminology can be tricky.  I created this visual glossary of Greenland Surface Mass Balance to help guide people through it.

Surface Conditions: Polar Portal

Posted in Uncategorized | Leave a comment

New Video : Fakest July On Record

Posted in Uncategorized | Leave a comment

New Video : The Joy Of Science

Posted in Uncategorized | Leave a comment

Someone Just Volunteered To Debate!

August 15, 2019 at 8:57 pm

Posted in Uncategorized | Leave a comment

Coolest Year On Record Continues

The frequency of hot days has plummeted in the US over the last 80 years. This year will easily be the lowest on record after the last four months of the year get counted.

Posted in Uncategorized | Leave a comment

1907 – When Scientists Did Science

March heat waves were common in the US prior to 1950. One of the most impressive was 1907, which brought 90 degree temperatures to the US almost every day of the month. Twenty-four states were over 90 degrees, and three were over 100 degrees. There was also widespread flooding around the country.

15 Mar 1907, 2 – St. Louis Globe-Democrat at Newspapers.com

Scientists actually attempted to explain it, rather than the modern approach – which would be to lie about it or try to make it disappear. This was two years after Einstein published his theory of Special Relativity, which met tremendous resistance from the consensus of know-nothings.

22 Mar 1907, Page 5 – The Sun at Newspapers.com

Posted in Uncategorized | Leave a comment

Freezing Out Arctic Fakery

The press is full of stories about Arctic sea ice being at a record low, that it may reach a record low, and that it is causing lightning to strike near the North Pole.

NSIDC graphs show this year about the same as 2012

Charctic Interactive Sea Ice Graph | Arctic Sea Ice News and Analysis

However their maps show 5% more ice this year than 2012. I’ve caught NSIDC cheating many times. It is the Boulder way of doing climate science.

Index of /DATASETS/NOAA/G02135/north/daily/images/

Arctic sea ice is melting very slowly, there has been almost no change in extent over the last three days.

The Danish Meteorological Institute shows that volume loss has essentially stopped, about two weeks earlier than normal.

FullSize_CICE_combine_thick_SM_EN_20190814.png (1337×1113)

This graph shows extent for all August days in the MASIE record. Ice extent dropped very rapidly during the second half of August 2012.

There has been no trend in Arctic sea ice extent since the start of MASIE records in 2006.

ftp://sidads.colorado.edu/DATASETS/NOAA/G02186/masie_4km_allyears_extent_sqkm.csv

Temperatures have been right at the long term mean near the North Pole all summer.

Ocean and Ice Services | Danmarks Meteorologiske Institut

Temperatures are forecast to be below freezing across the remaining ice for the rest of the summer.

10-Day Temperature Outlook

Nothing the press is saying about the Arctic has any validity, and when the summer ends they will continue to lie. But at least someone in the academic community is challenging their BS.

Posted in Uncategorized | Leave a comment

This Date In 1954

On this date in 1954, the US Senate, led by liberal Democrat Hubert Humphrey, voted unanimously to ban communists.  Based on information from a Soviet spy, they wanted to put an end to Communist controlled labor unions. Penalty for being a communist was five years in jail.

Had the president signed it, many current senate Democrats would be spending most of their term in the Federal penitentiary.

14 Aug 1954, Page 1 – The Terre Haute Tribune at Newspapers.com

Posted in Uncategorized | Leave a comment