
The press is full of stories about Arctic sea ice being at a record low, that it may reach a record low, and that it is causing lightning to strike near the North Pole.
NSIDC graphs show this year about the same as 2012

Charctic Interactive Sea Ice Graph | Arctic Sea Ice News and Analysis
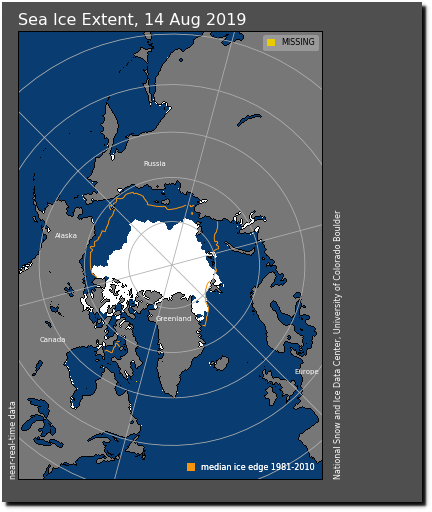
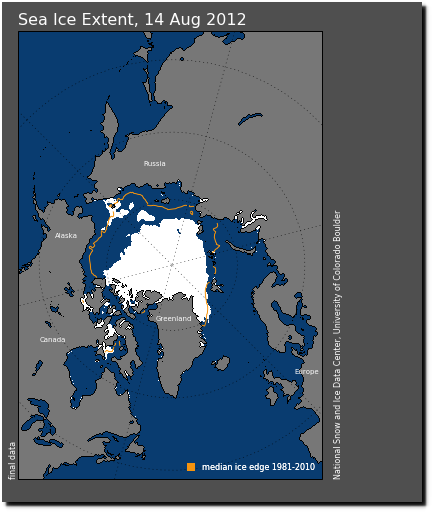
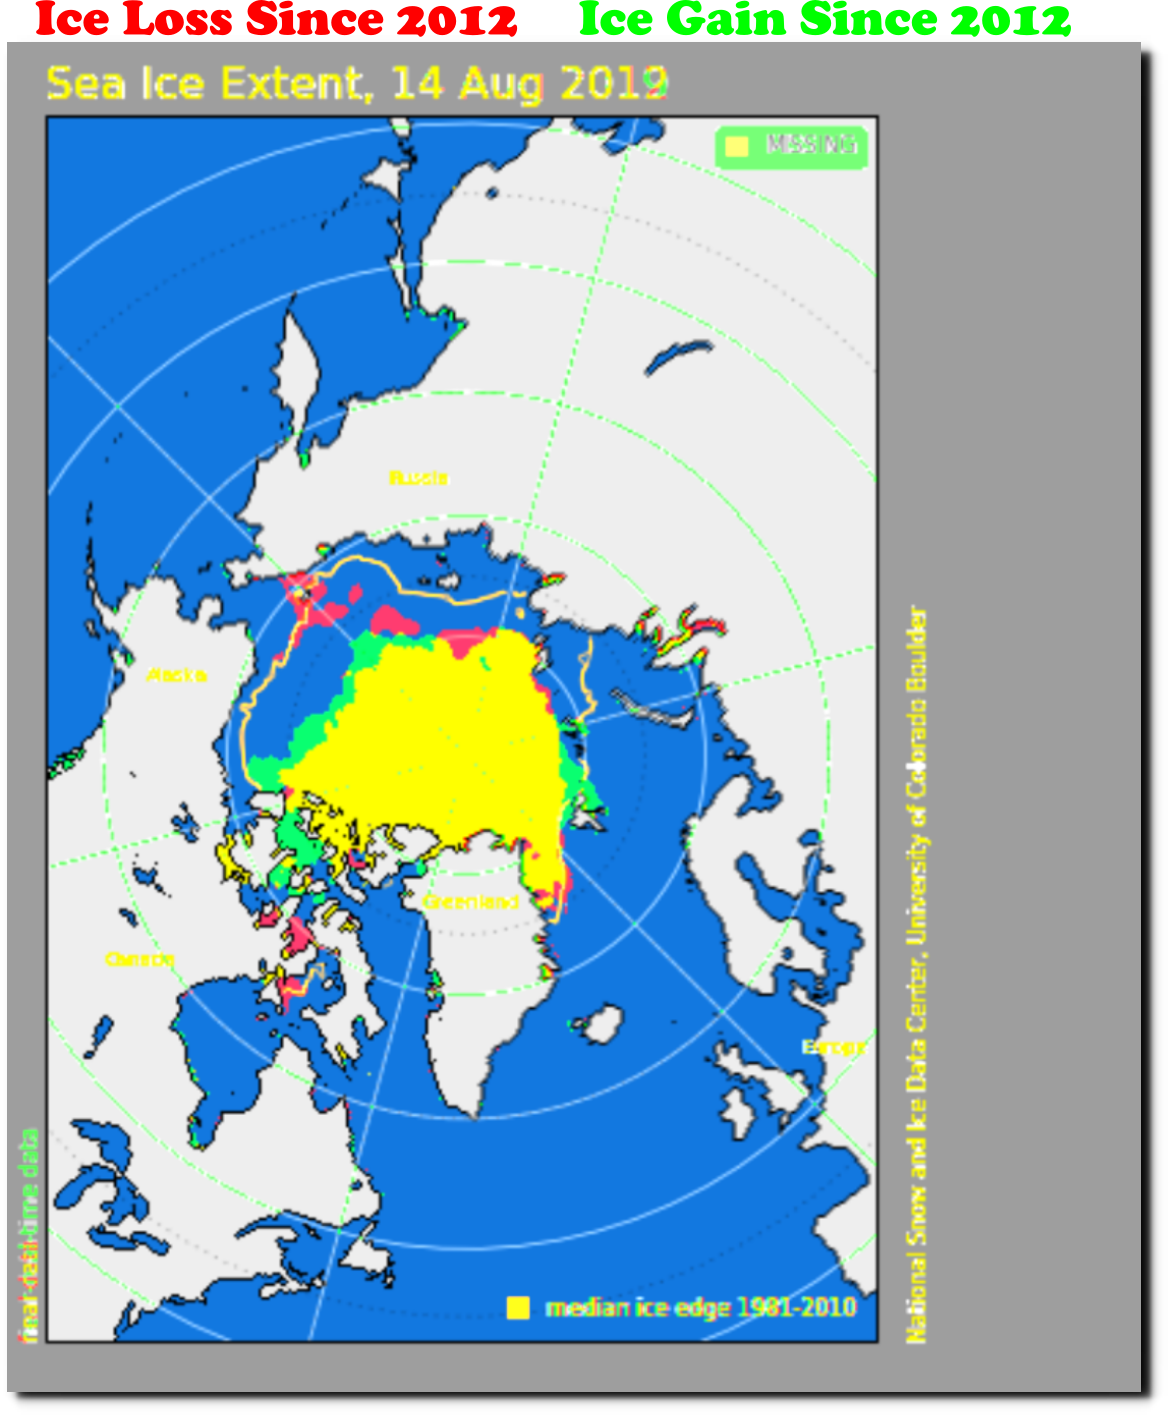
However their maps show 5% more ice this year than 2012. I’ve caught NSIDC cheating many times. It is the Boulder way of doing climate science.
Index of /DATASETS/NOAA/G02135/north/daily/images/
Arctic sea ice is melting very slowly, there has been almost no change in extent over the last three days.

The Danish Meteorological Institute shows that volume loss has essentially stopped, about two weeks earlier than normal.
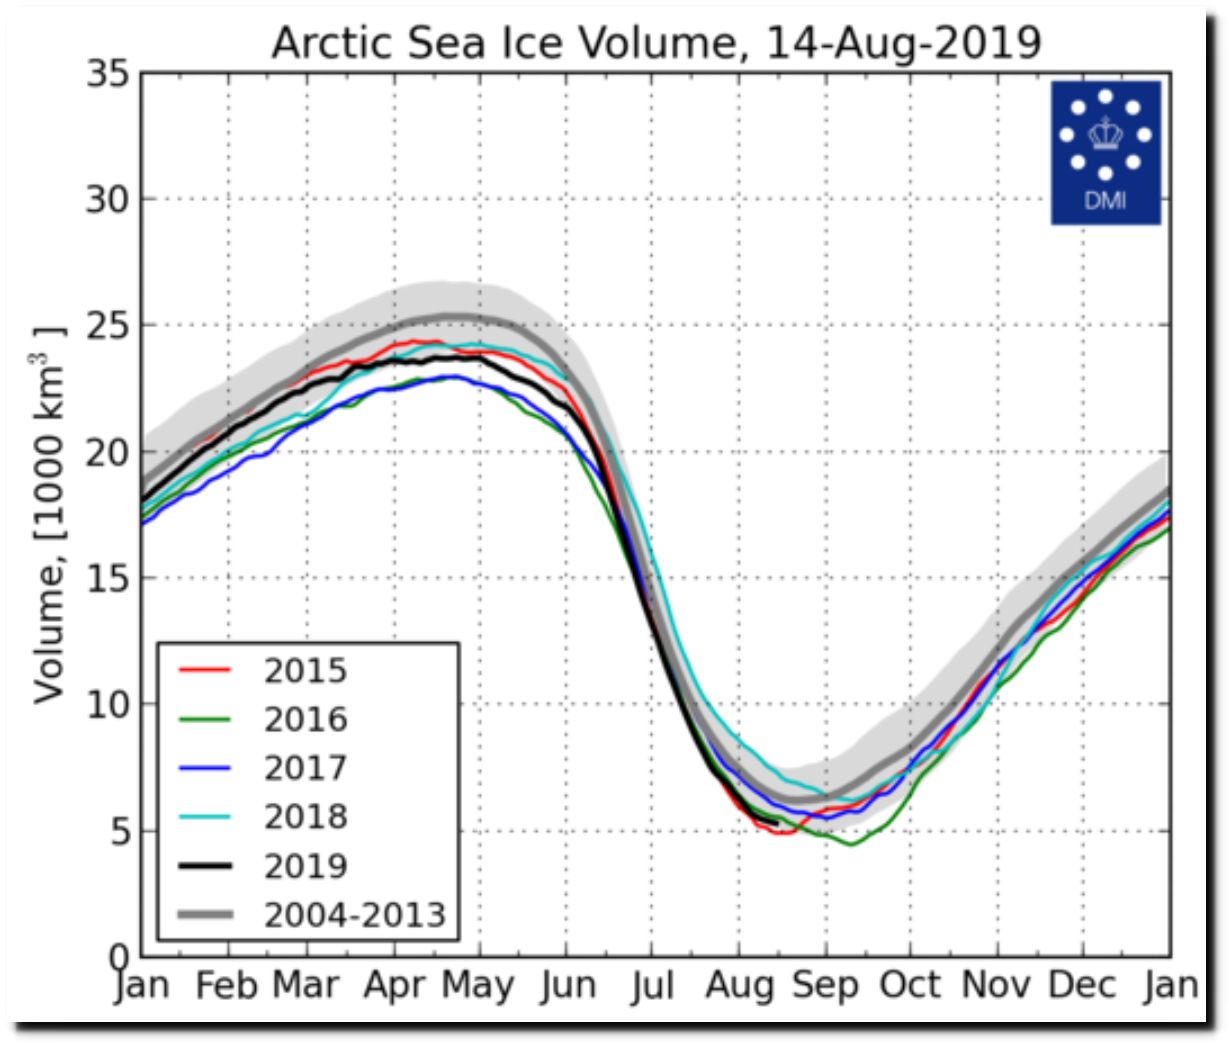
FullSize_CICE_combine_thick_SM_EN_20190814.png (1337×1113)
This graph shows extent for all August days in the MASIE record. Ice extent dropped very rapidly during the second half of August 2012.

There has been no trend in Arctic sea ice extent since the start of MASIE records in 2006.
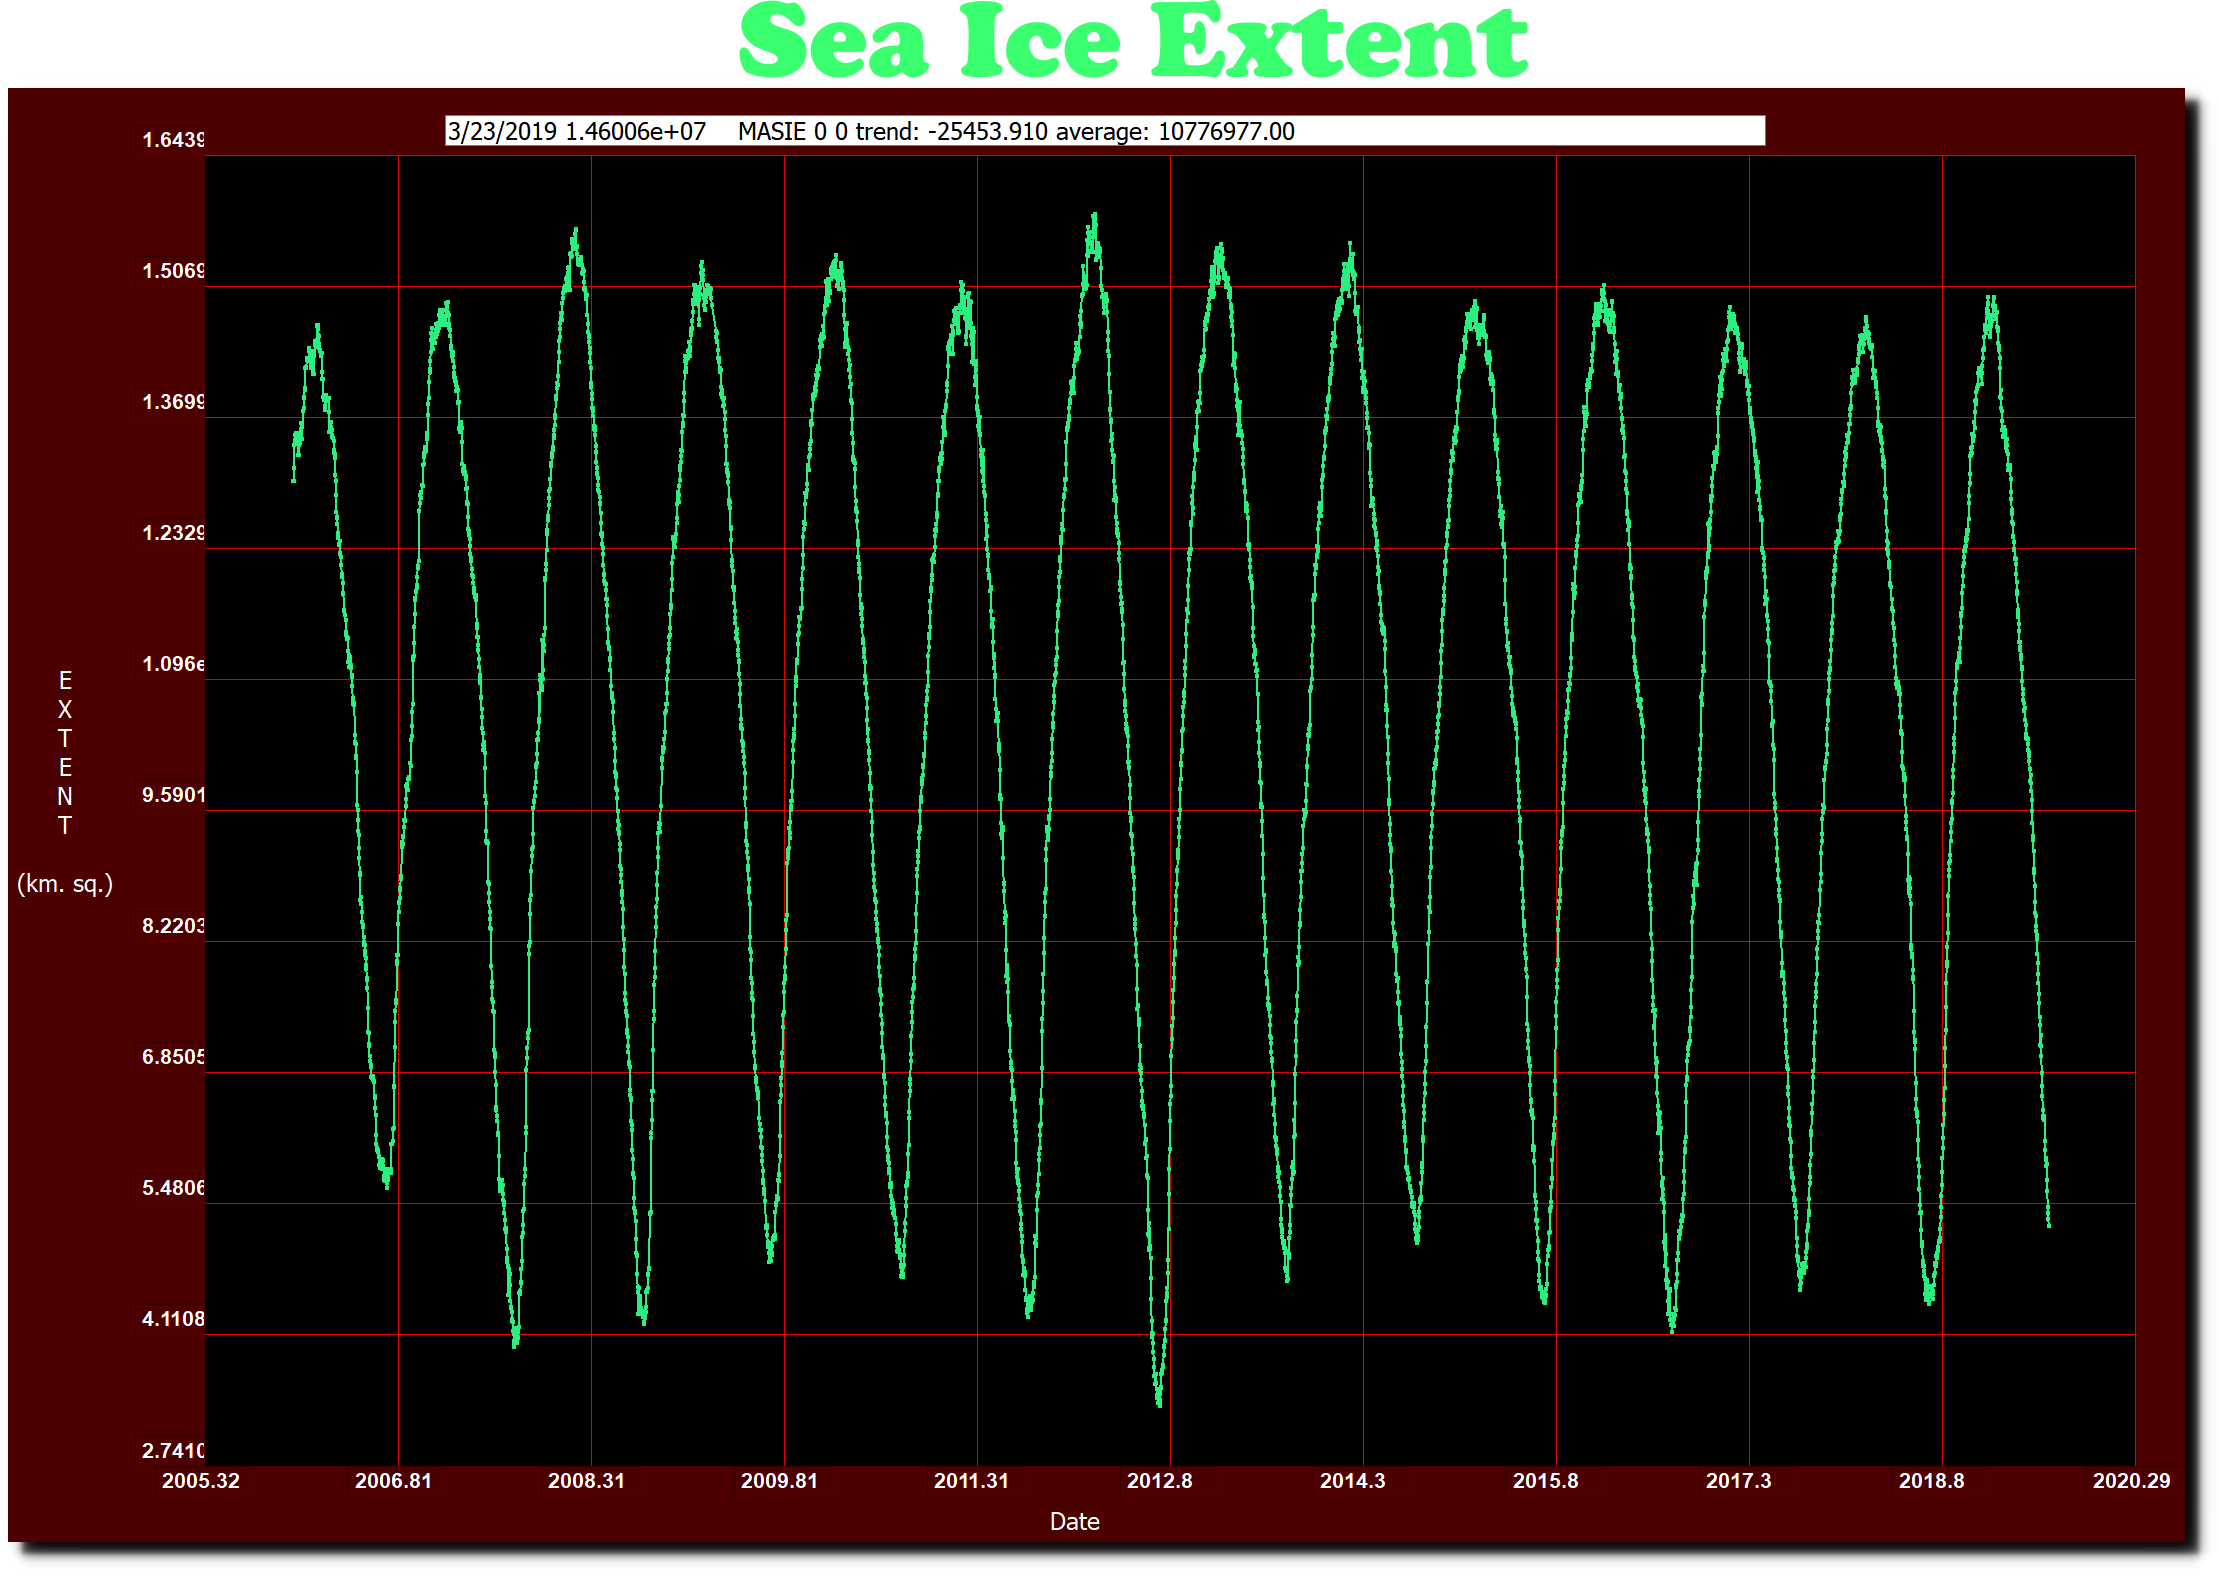
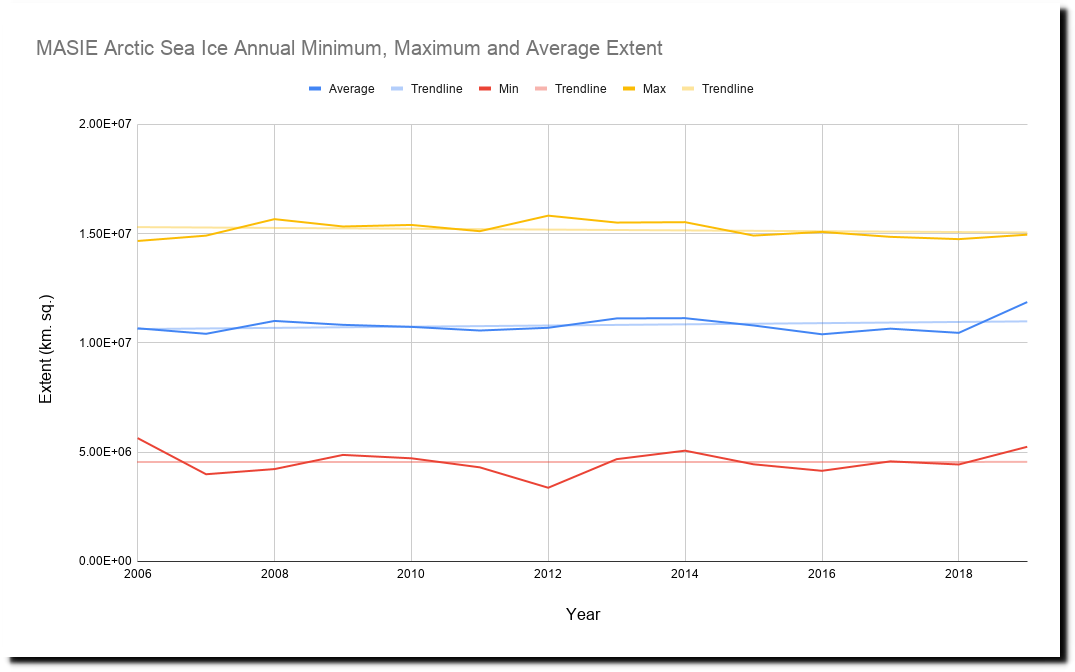
ftp://sidads.colorado.edu/DATASETS/NOAA/G02186/masie_4km_allyears_extent_sqkm.csv
Temperatures have been right at the long term mean near the North Pole all summer.
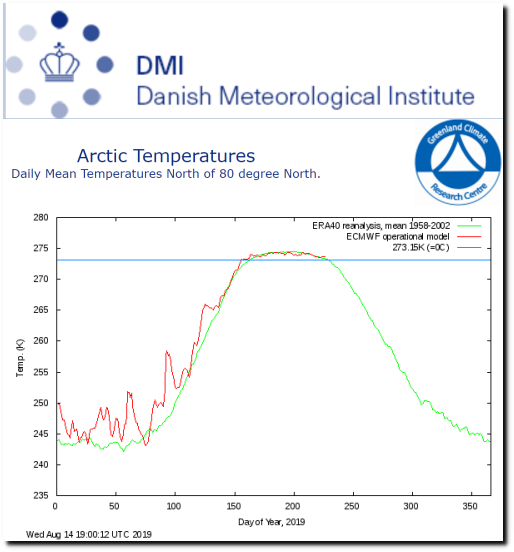
Ocean and Ice Services | Danmarks Meteorologiske Institut
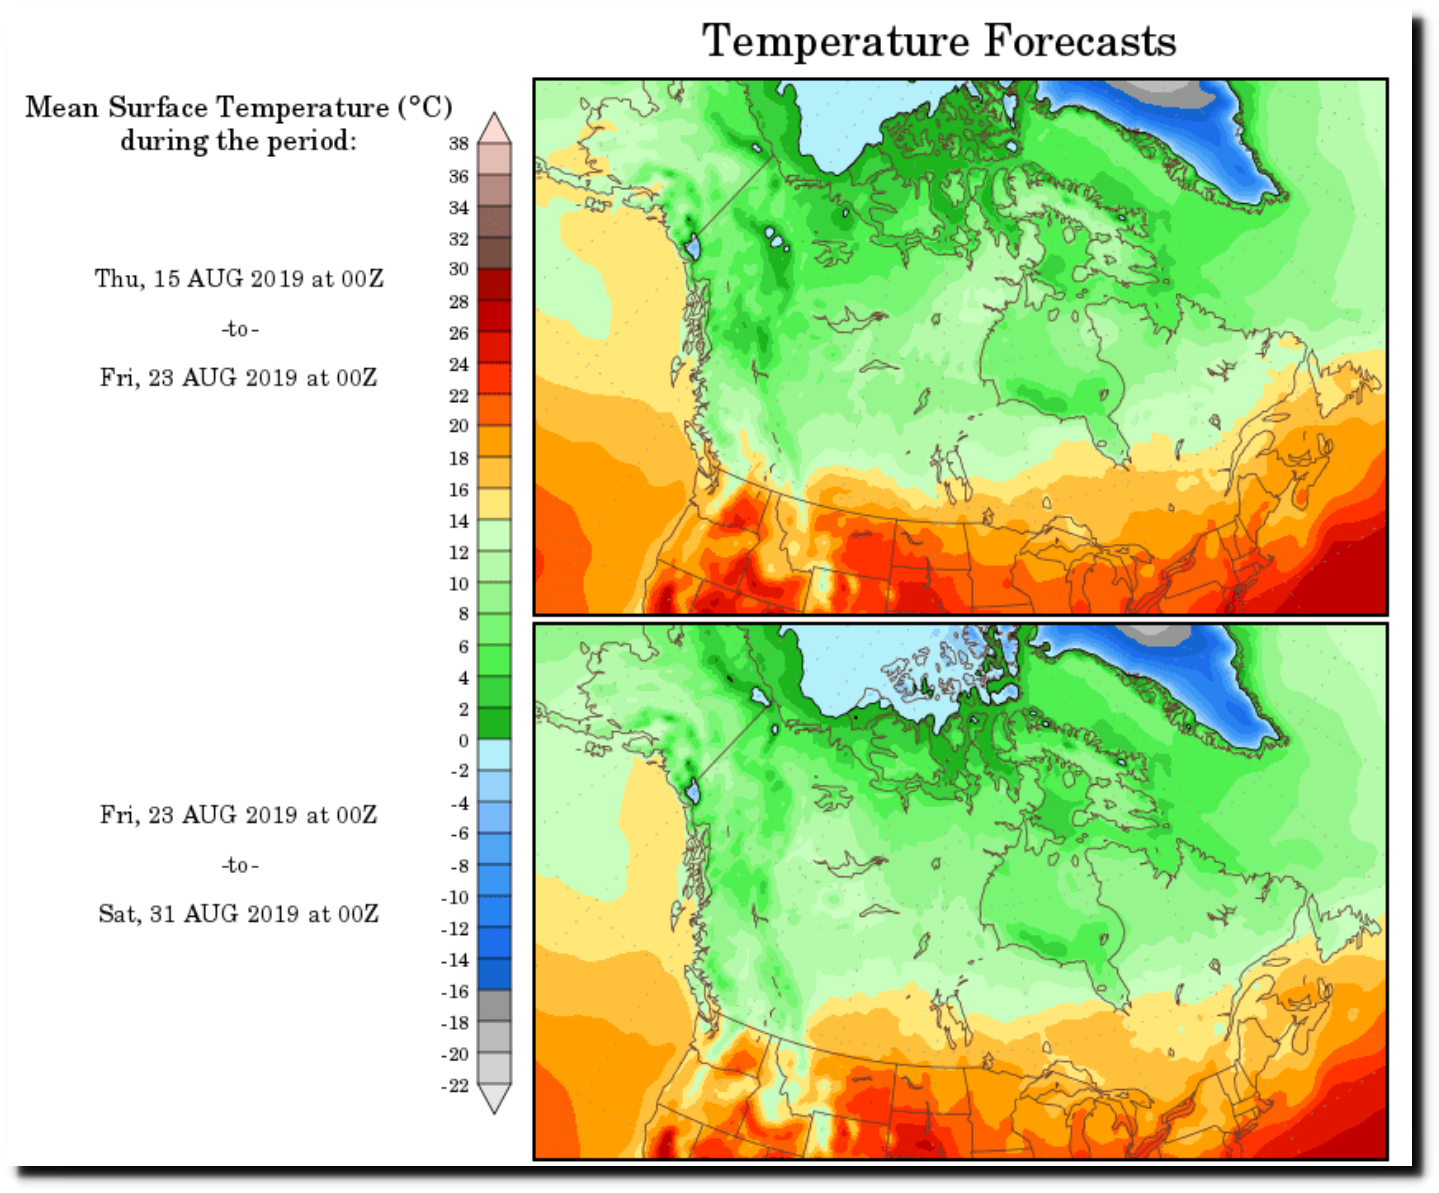
Temperatures are forecast to be below freezing across the remaining ice for the rest of the summer.
Nothing the press is saying about the Arctic has any validity, and when the summer ends they will continue to lie. But at least someone in the academic community is challenging their BS.
