The Incredible Heatwave Of August, 1936

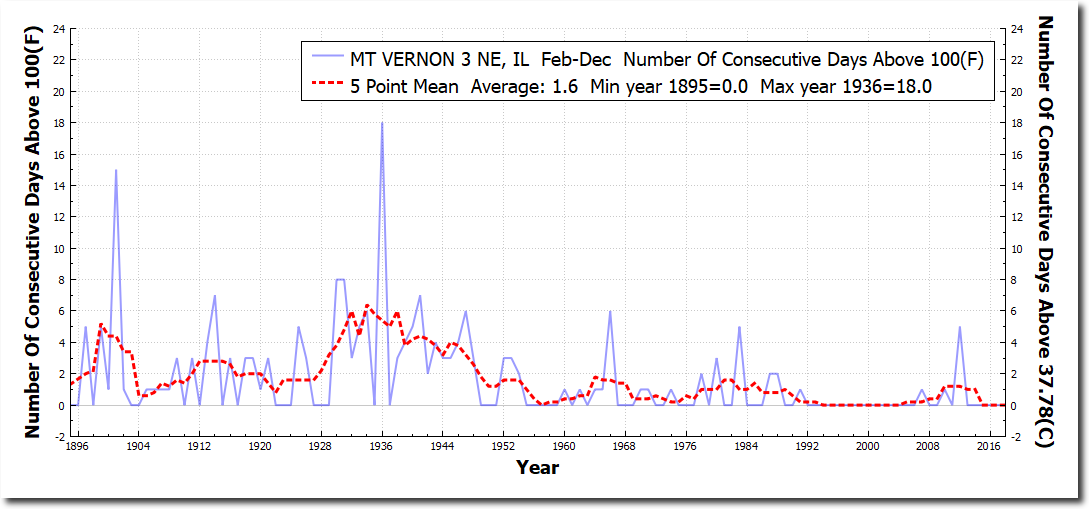
Mt. Vernon, Illinois had eighteen straight days over 100 degrees during August, 1936, and afternoons averaged 105 degrees during that heatwave.

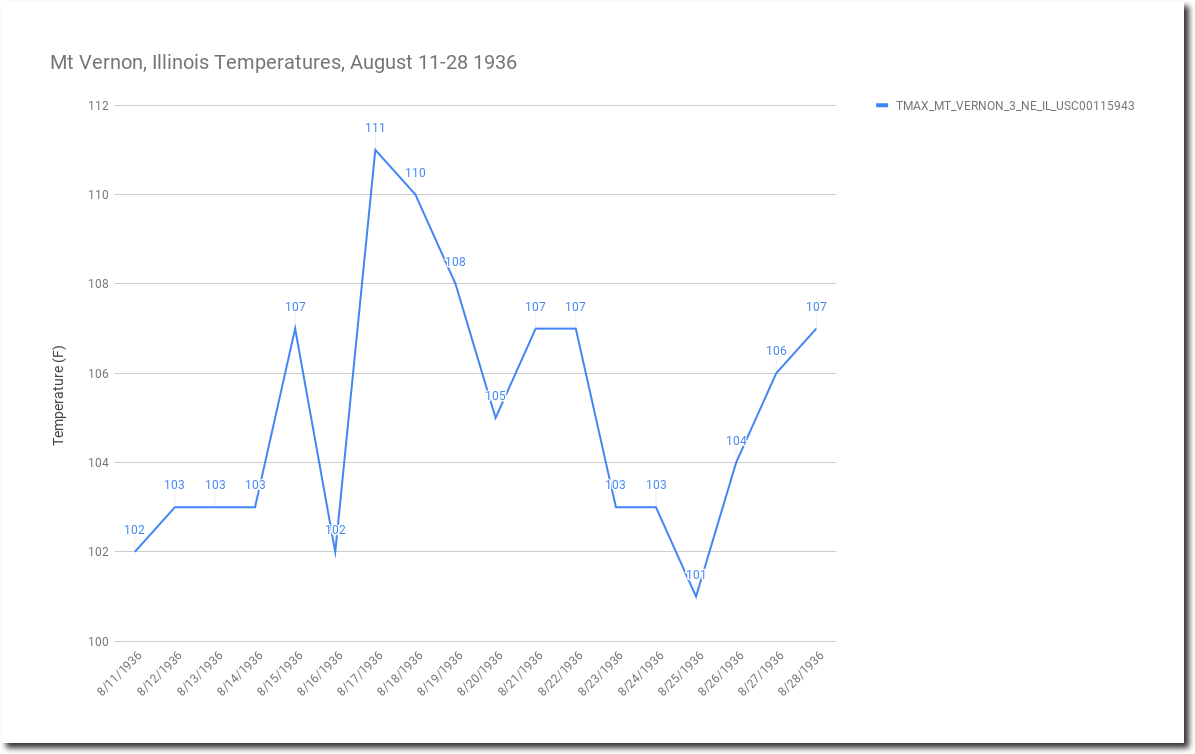
The only other year which cam close to that was 1901, when they had fifteen straight days over 100F. Illinois almost never gets above 100 degrees any more.

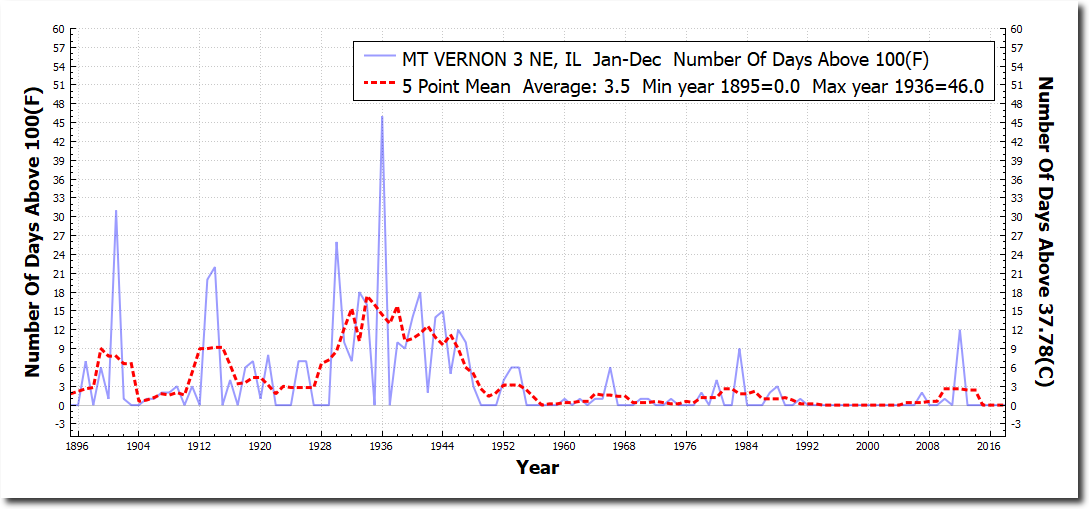
There were a total of 46 days over 100 degrees during 1936 at Mt. Vernon.

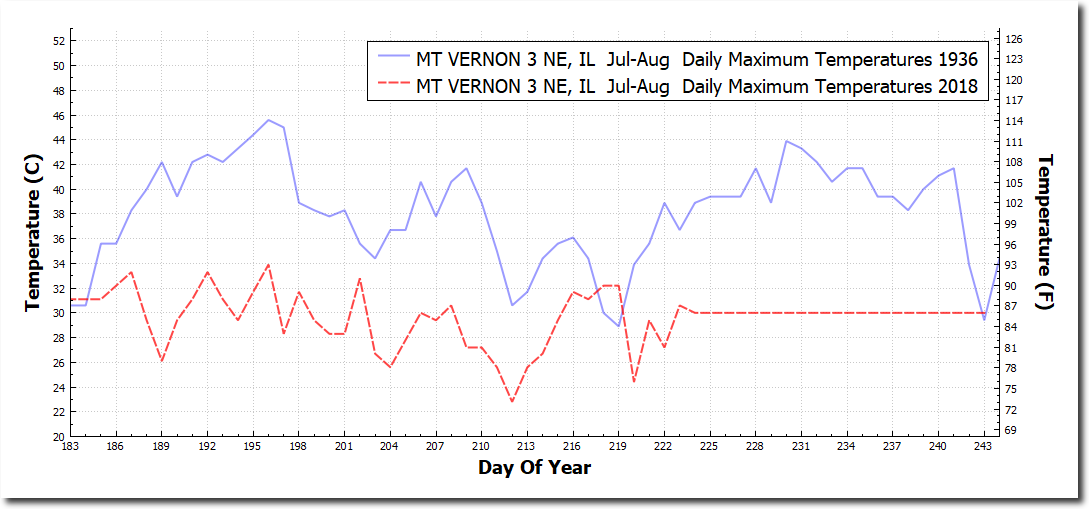
Mt Vernon averaged 101 degrees during July and August, 1936 – sixteen degrees warmer than this year.

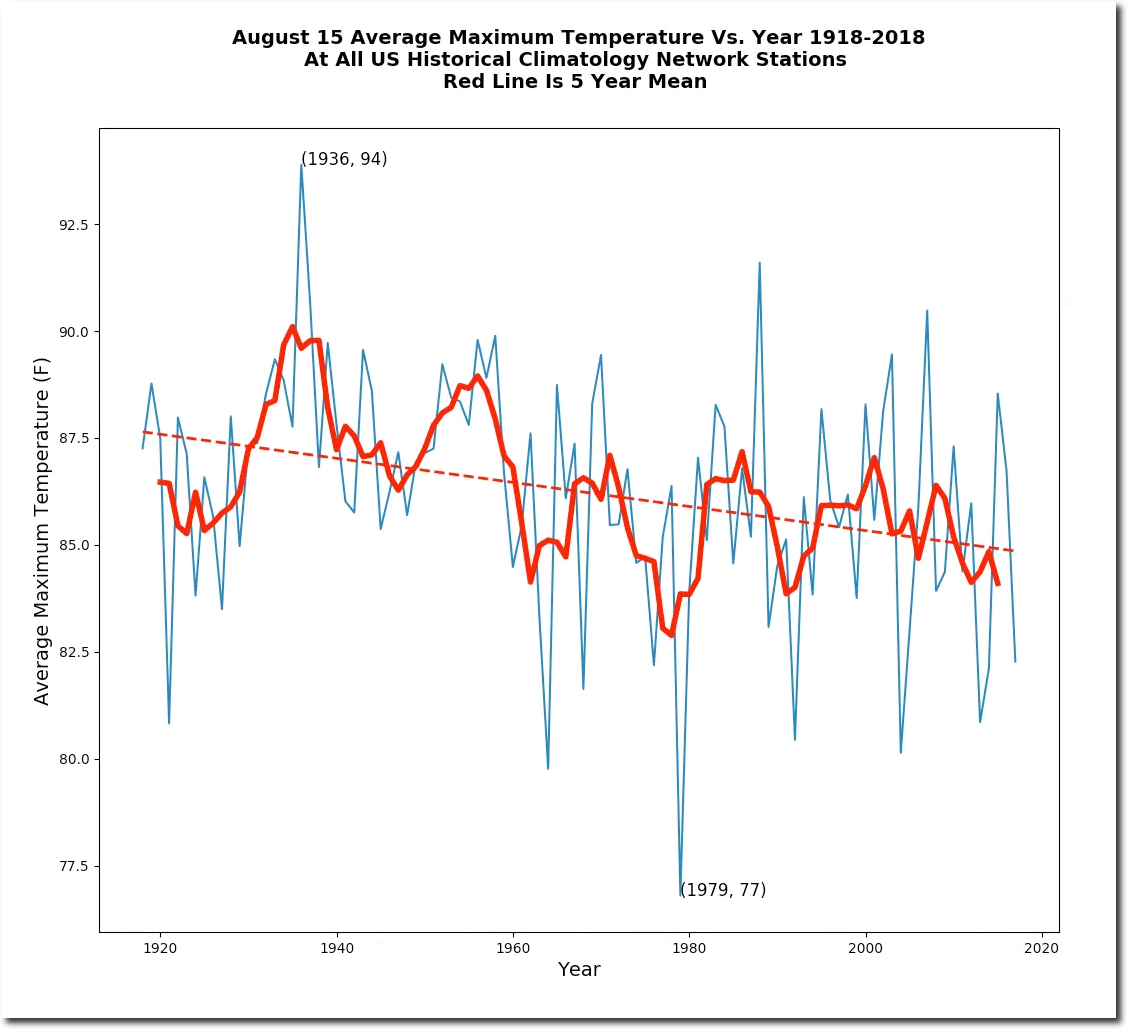
August 15, 1936 was an incredibly hot day in the US, with an average maximum temperature of 94 degrees, and much of the Midwest over 110 degrees.

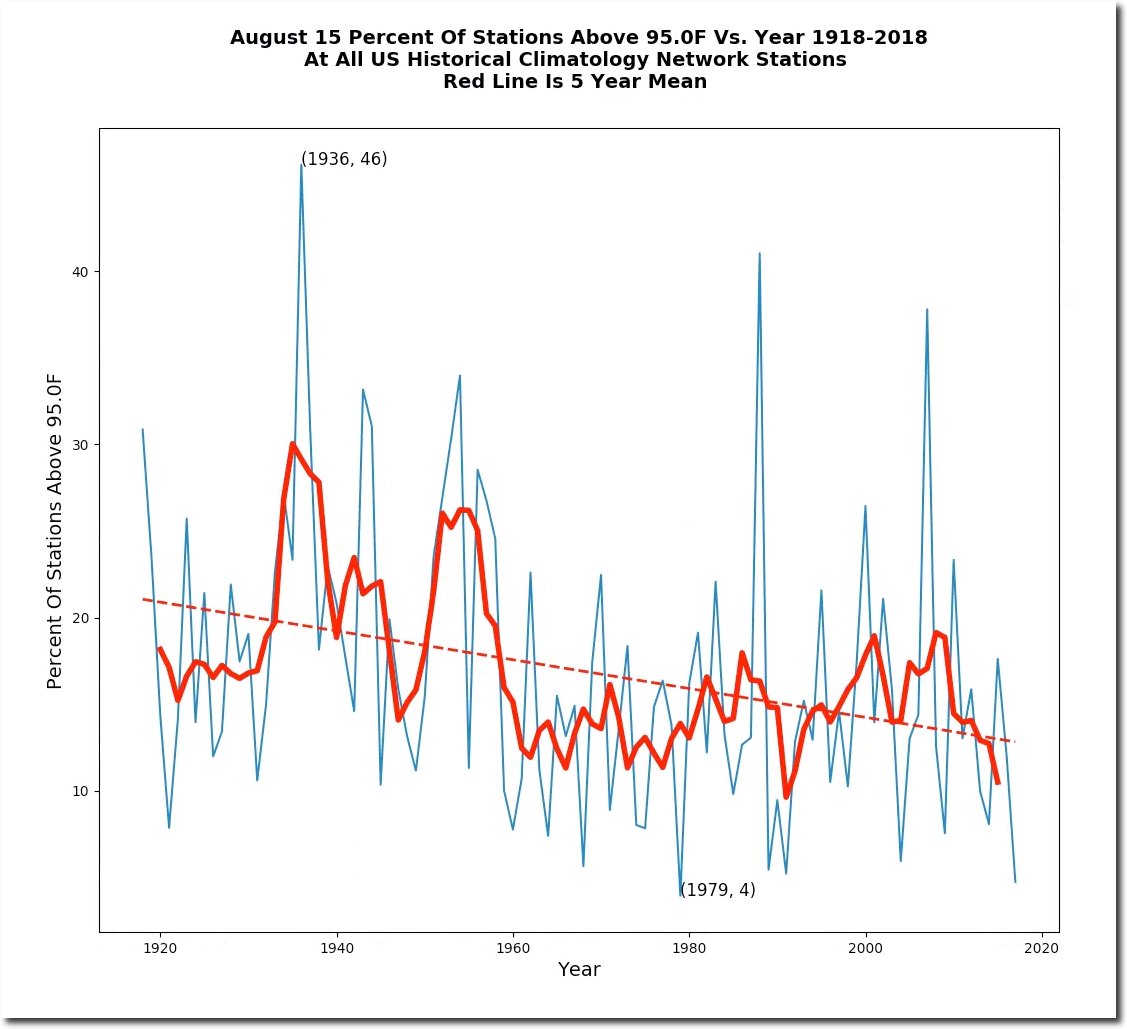
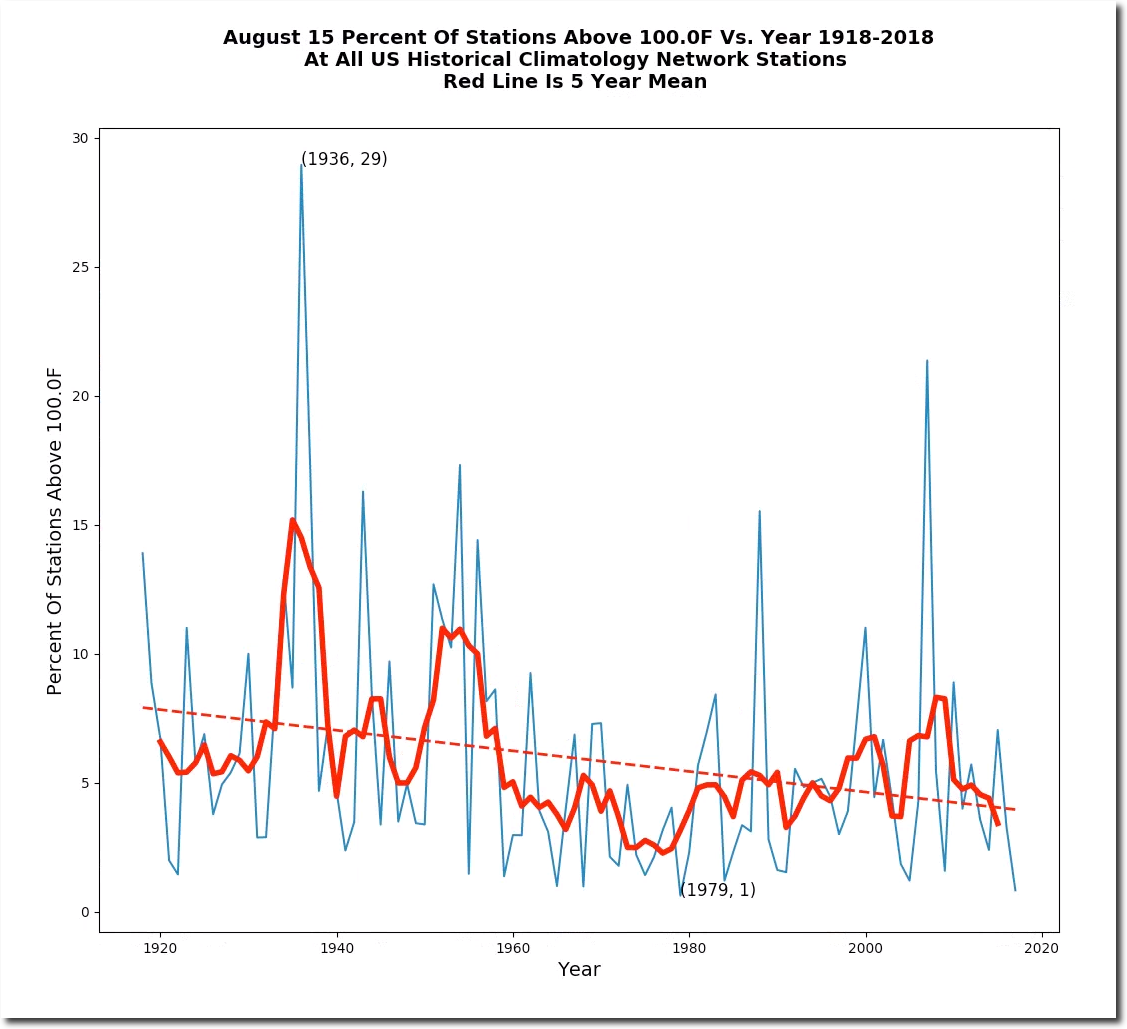
August 15 temperatures have plummeted in the US over the past century.


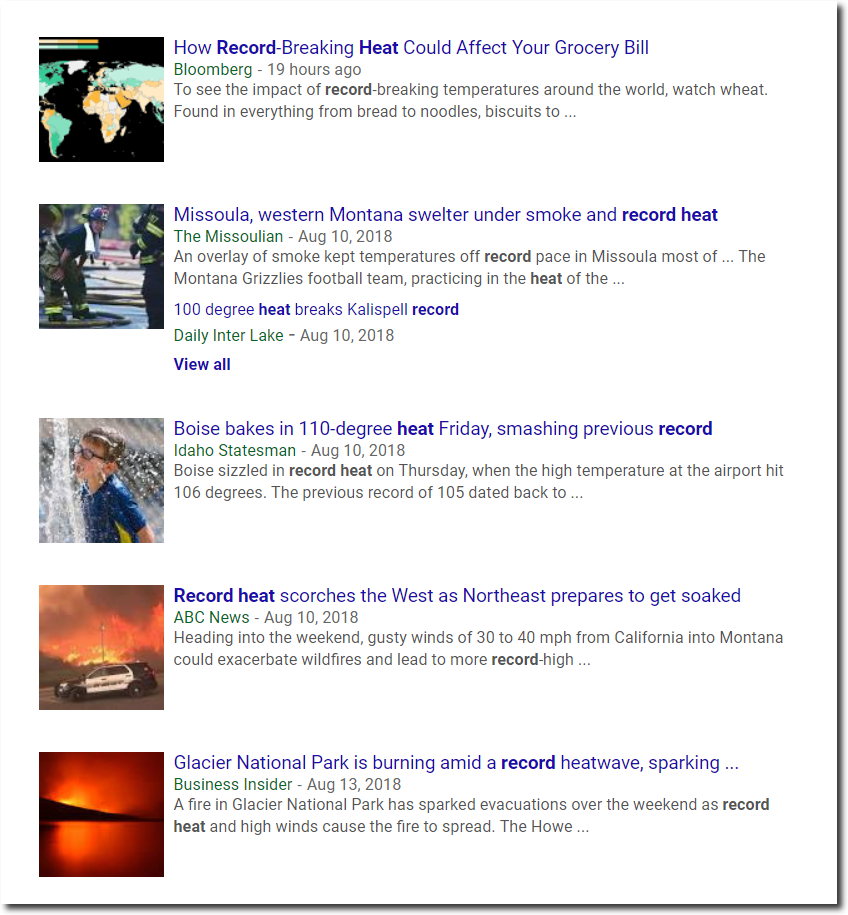
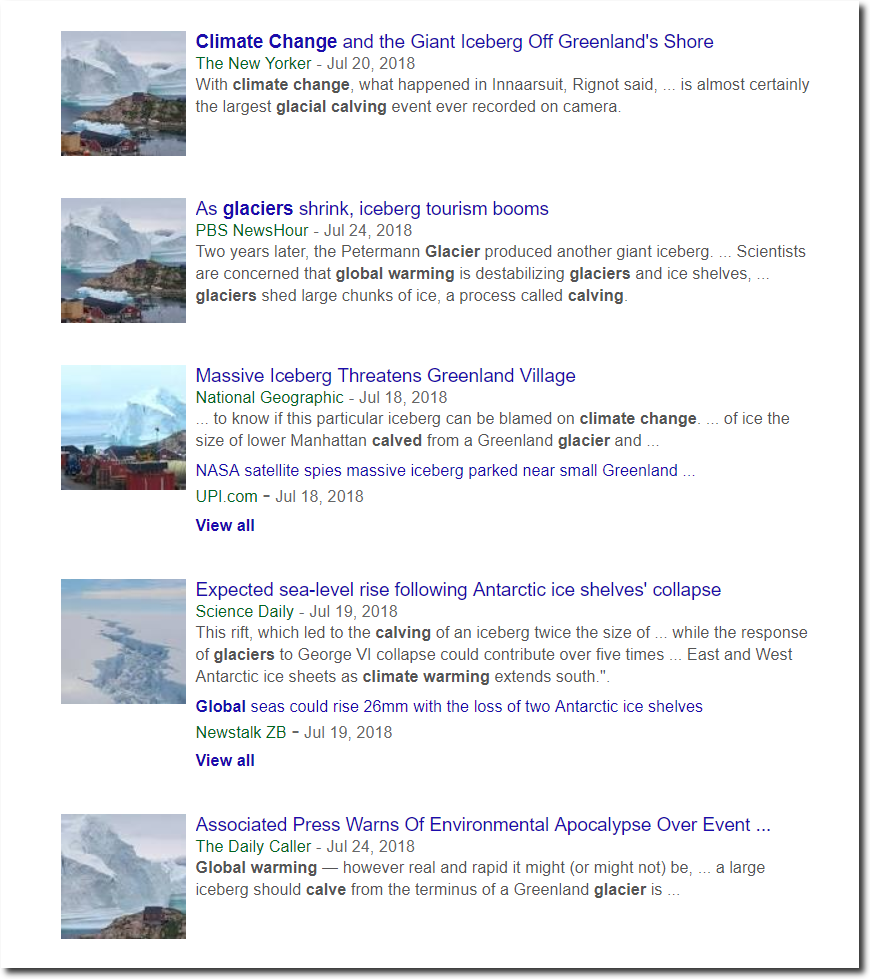
It is cold and wet here in Boulder, as the fake news about record heat and fires continues unabated.

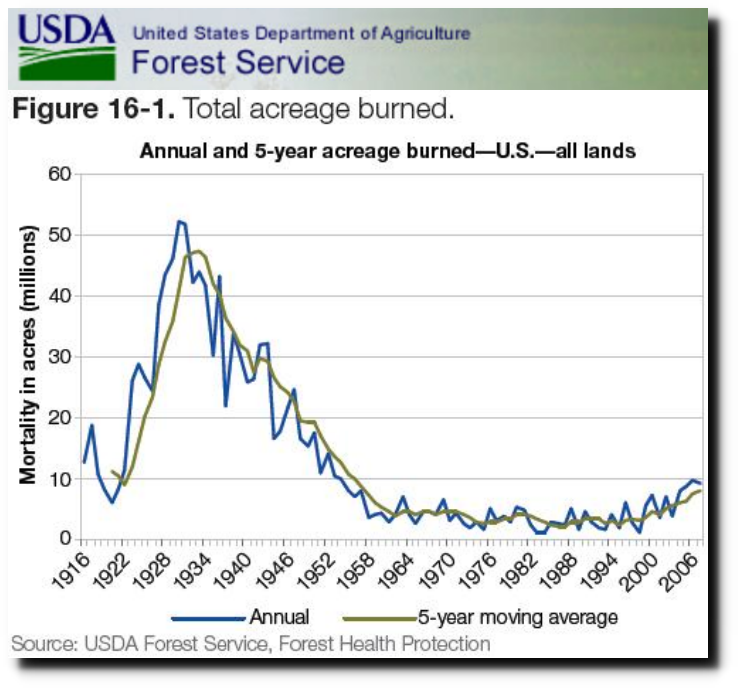
Indicator 3.16: Area and percent of forest affected by abiotic agents

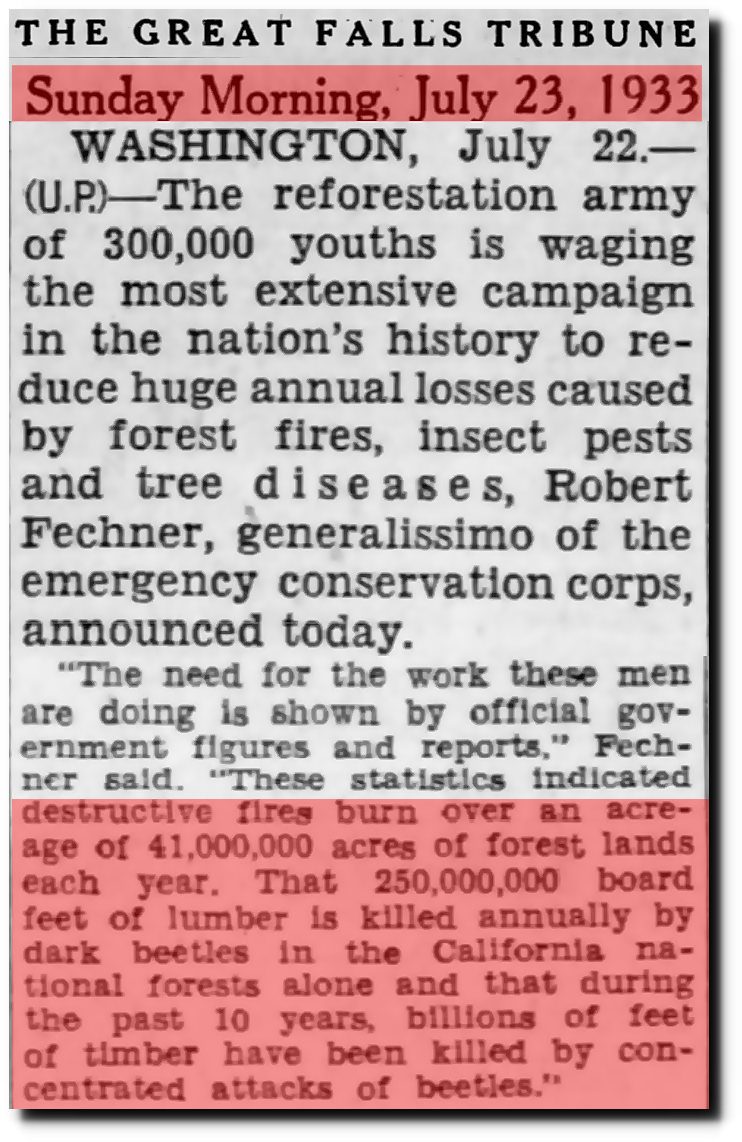
23 Jul 1933, Page 12 – Great Falls Tribune at Newspapers.com

TimesMachine: October 9, 1938 – NYTimes.com

Posted in Uncategorized | Leave a comment

July 8th, 1905 – California’s Hottest Day

On July 8th, 1905 California averaged an incredible 104 degrees. More than half of the state was above 105 degrees, and more than a third of the state was 110 degrees or above. Orland, in Northern California was 120 degrees.  CO2 was 300 PPM at the time.


Posted in Uncategorized | Leave a comment

“HATE HAS NO HOME HERE”

This is where I lived in Philadelphia.  I went in that Wal-Mart once, and was the only white person in the store.

The rich white Democratic progressives live on the east side of Highway 309, and they keep the black people in the projects on the west side.

Q. What kind of people put a sign in front of their house with the word “HATE” in bold, capital letters?

A. Progressive Democrats

Posted in Uncategorized | Leave a comment

The Canada Y2K Bug

I have been analyzing the Canadian temperature record, and it is a farce. There are less than 25 stations in Canada with a relatively complete long term daily temperature record .

The average maximum temperature for all Canadian GHCN stations has plummeted since the 19th century, but the trend is meaningless because the average latitude of the stations has moved four degrees further from the equator during that time period.


If we look at only the stations which were active in both 1918 and 2017, they show a big jump in temperature at the year 2000. But there are some problems which make the trend meaningless.

First (huge) problem is that there are only about 20 GHCN stations in Canada which have reported consistently for the past century, compared with more than 700 in the US.

But here is the real killer.  The jump in temperatures after 2000 is largely due to something going on at one station – Banff. Something went seriously wrong with that station after the year 2000, where almost all of the low maximum temperatures disappeared.

Without Banff, 2010 is barely warmer than 1940.

The yellow pin is at the latitude and longitude where GHCN lists the thermometer. It is almost like the moved the thermometer indoors.

You really can’t make this stuff up. Like just about every other country outside the US, the Canadian temperature record is a farce. I’ve developed some pretty sophisticated tools for detecting these problems, and I doubt that the people at Berkeley Earth, NASA and NOAA are even aware of how awful the global temperature record is.

The number of stations with long term records in Canada and their geographical location is much too small to draw any meaningful conclusions about Canadian temperature trends. You can get whatever trend you want by picking the right set of stations.

Posted in Uncategorized | Leave a comment

Climate Science : Meaningless Statistics And Gender

#Hail2018 hashtag on Twitter

Posted in Uncategorized | Leave a comment

How Propagandists Abuse Language

Another WWII plane found buried under hundreds of feet of ice in Greenland. Instead of describing the thickening ice sheet correctly, Popular Mechanics calls it a shifting ice sheet.

WWII P-38 Discovered Under 300 Feet of Ice in Greenland

h/t Kent Clizbe

Shifting ice doesn’t bury planes, but thickening ice does.

Greenland Ice Sheet Surface Mass Budget: DMI

As the ice sheet thickens, the excess weight forms rivers of ice (glaciers) which flow to the sea. Climate alarmists watch these glaciers calve into the ocean, and cry.

Climate alarmists are Dark Ages mentality humans, working with 21st century tools to spread their superstitions.

Posted in Uncategorized | Leave a comment

Extreme Weather 85 Years Ago

It was extremely hot at San Luis Potosi, Mexico on August 11, 1933.  (Multiple locations in Arizona reported 117 degrees that day.)

August 11, 1933 – What Happened – On This Day

h/t Don Penim

Five weeks later, the city was destroyed by a hurricane.  Imagine the climate hysteria and superstition if this happened now.

18 Sep 1933, Page 1 – Clovis News-Journal at Newspapers.com

Just another lovely day in San Luis Potosi, Mexico.

29 Jan 1933 – SHOT AND HANGED – Trove

Posted in Uncategorized | Leave a comment

No Change In Arctic Sea Ice Over The Past 60 Years

Sixty years ago this week, the USS Skate surfaced at the North Pole. Arctic sea ice was two meters thick.

The Changing Face of the Arctic; The Changing Face of the Arctic – The New York Times

Compare the North Pole in 1958, to what it looks like 60 years later.

The Bush family immediately recognized it as an opportunity to wage war with Russia.

13 Aug 1958, 1 – Star-Gazette at Newspapers.com

So nothing has changed over the last 60 years. The ice is still two meters thick, and the Bush family still wants war with Russia.

FullSize_CICE_combine_thick_SM_EN_20180812.png (1337×1113)

Wood for Trees: Interactive Graphs

Posted in Uncategorized | Leave a comment

More Canadian Temperature Nonsense

These are all of the Canadian GHCN stations which have daily temperature data in both 1950 and 2017.

They show a sharp cooling trend before 1950, and a warming trend since 1980.

But the data is pretty useless for a number of reasons.  The station count is too small.

The average latitude of the stations has moved further from the equator. This causes a larger cooling trend after 1940 than is realistic.

Like in the US, coverage and intensity of heatwaves has declined.

Because of the lack of data and poor geographical coverage, there is no way to establish a meaningful long term temperature trend for Canada – and anyone with an agenda can produce whatever trend they want.

As bad as Canada is, it is much better than most of the rest of the world. The US temperature record is the only large scale record with any validity, and NOAA massively tampers with it.

Posted in Uncategorized | Leave a comment

“Why Aren’t I Fifty Points Ahead, You Might Ask?”

Leftists have difficulty understanding why their open hatred for America doesn’t translate into votes.

Posted in Uncategorized | Leave a comment