
Democrats not only want nuclear war, but they are actively working to provoke it.
Democrats not only want nuclear war, but they are actively working to provoke it.
Halfway through the summer, the total number of US record daily temperature maximums remains near a record low.
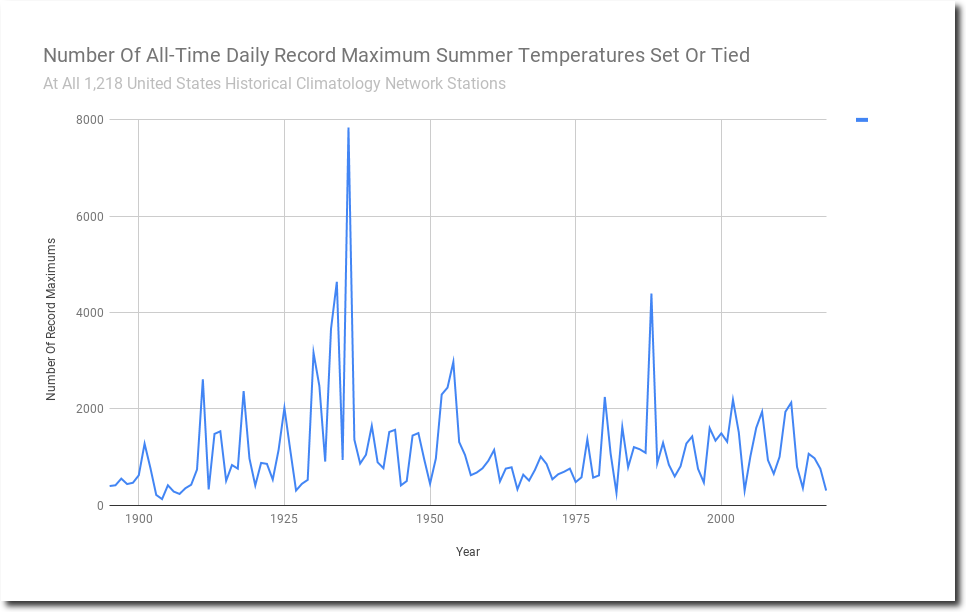
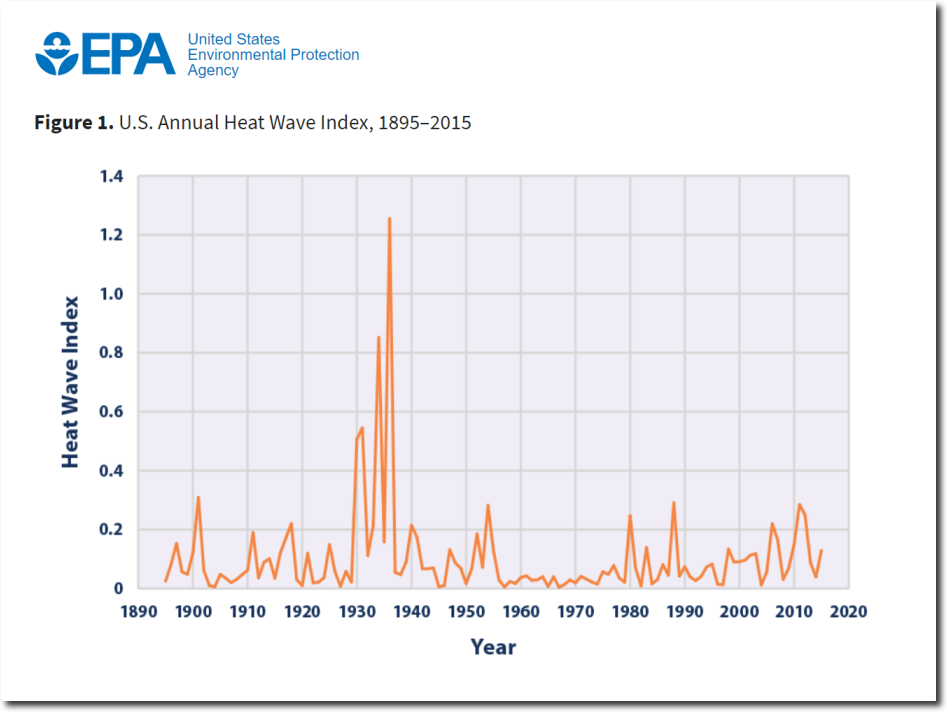
Note how similar this graph is to the EPA heatwave graph below.
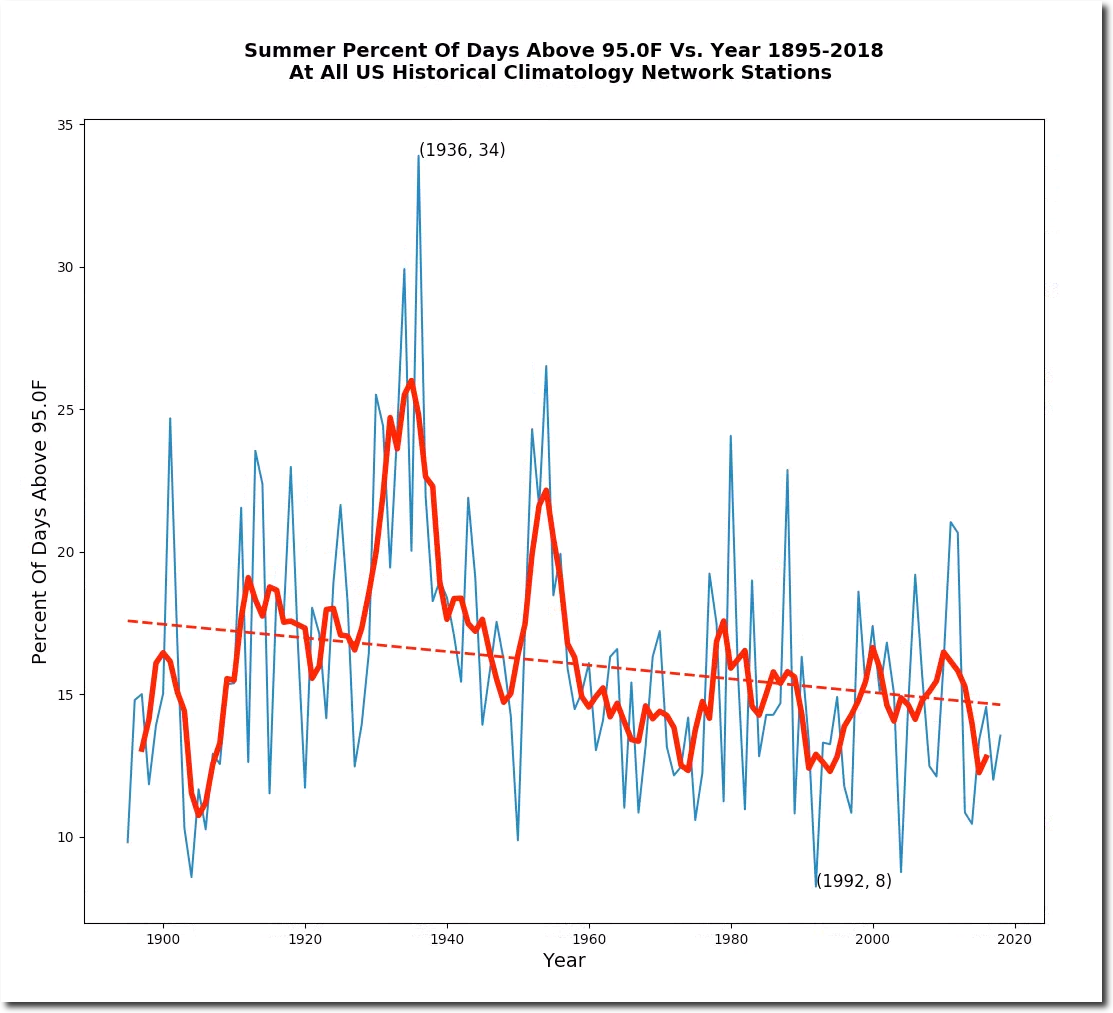
The percentage of hot days has also been low.
Reality has no place in climate science however.
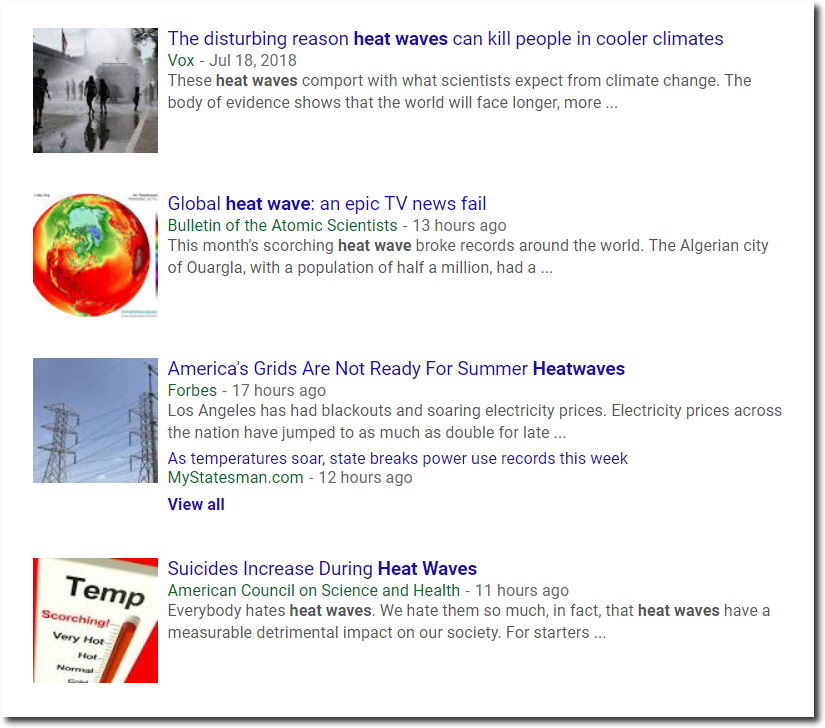
Bloomberg says the Dallas-Fort Worth area “smashed” a heat record yesterday at 108 degrees.
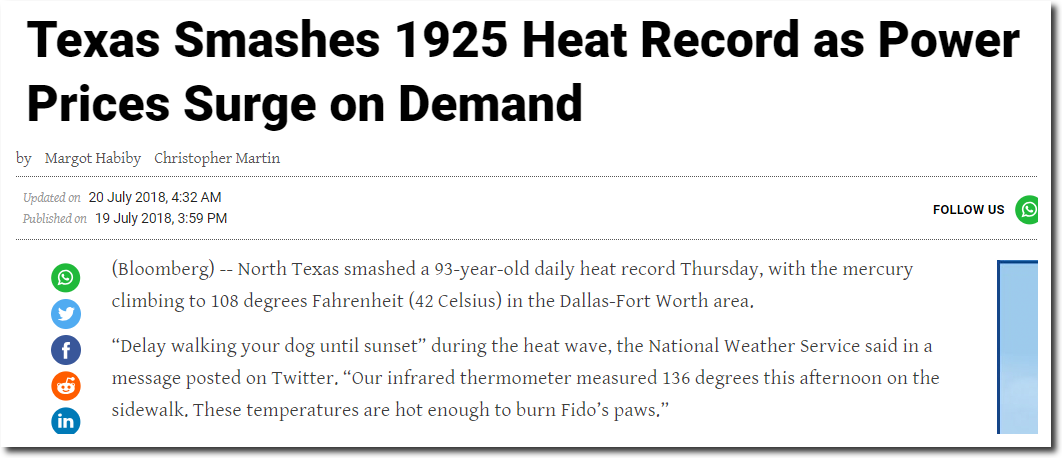
U.S Heat Wave: Texas Smashes 1925 Heat Record As Power Prices Surge On Demand – Bloomberg Quint
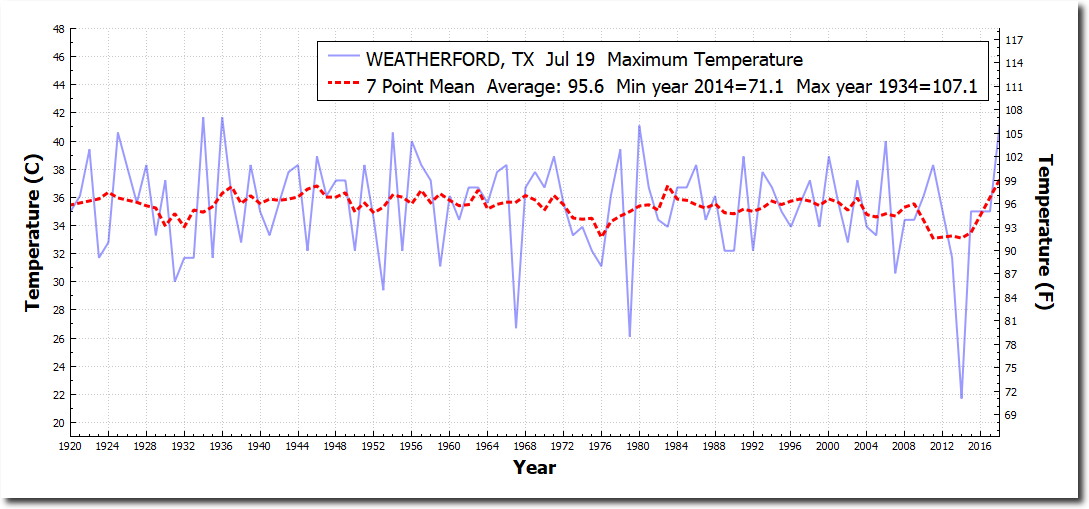
They “smashed” the old July 19th temperature record by one degree.
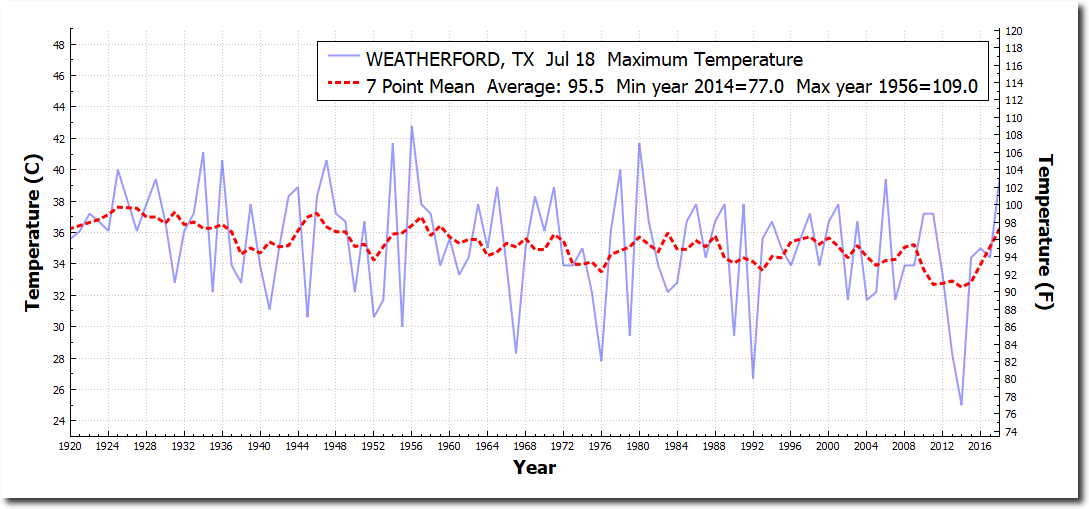
However the July 18 record, set in 1956, was 109 degrees.
For the 120th consecutive month since I started blogging, my big oil/big tobacco check failed to arrive in the mail.
My software development contract in Philadelphia runs out at the end of the month, and am back on the market looking for Javascript, Python, WebGL or C++ programming work.
Over the last six months I have developed an incredible WebGL app for analyzing climate data, which gives me the ability to instantly visualize almost anything I want in the temperature record, but unfortunately it is proprietary technology for the company I have been working for, and I can’t release it. I can’t even show screen shots. But I am thinking about developing a different app from scratch with similar capabilities, to make public.
Please contact me at [email protected] if you are need a top flight programmer.
According to the Danish Meteorological Institute, Greenland’s surface has accumulated 600 billion tons of new ice since last August, and more than 95% of the surface has gained ice. Eastern Greenland is gaining a lot of ice.
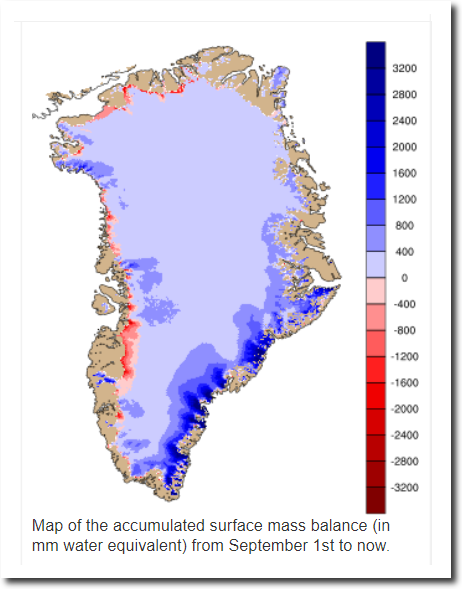
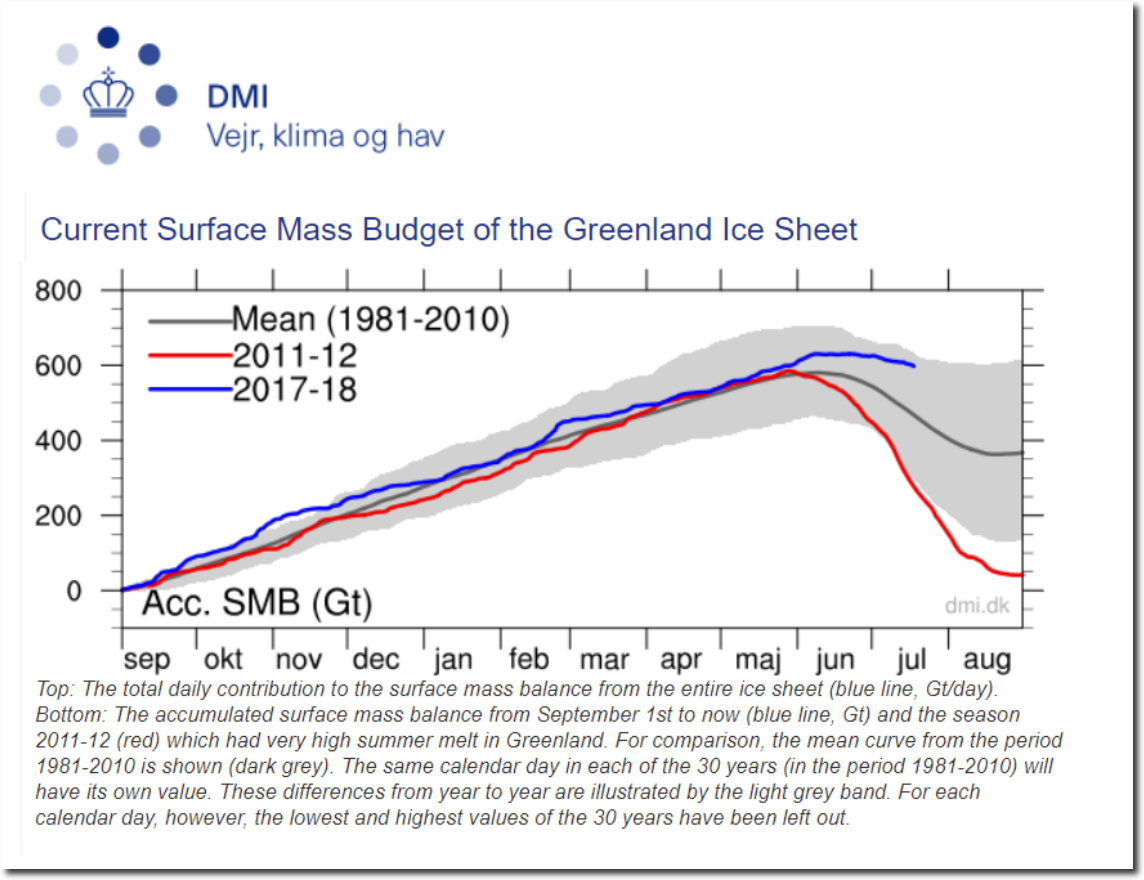
Greenland Ice Sheet Surface Mass Budget: DMI
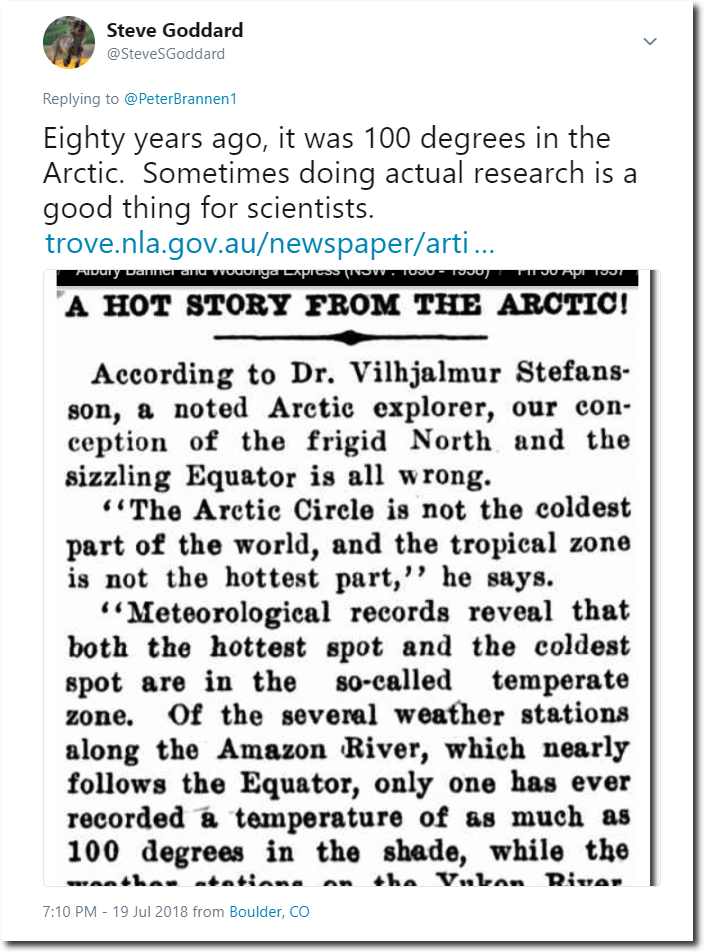
Eighty years ago, the glaciers in Eastern Greenland were “nearing catastrophic collapse”
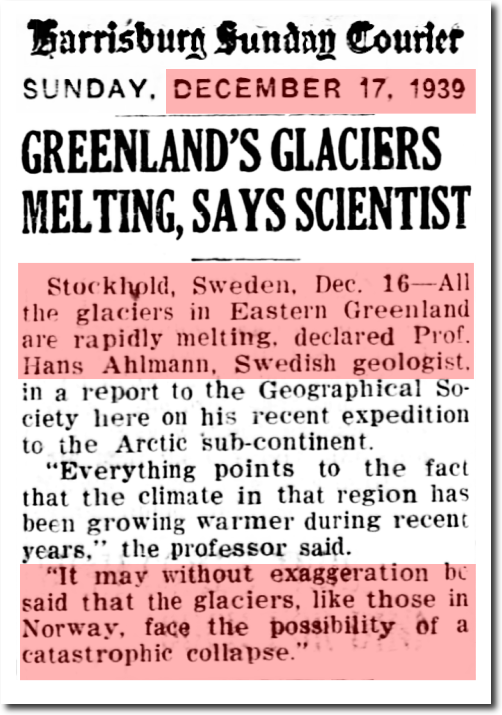
17 Dec 1939, Page 15 – Harrisburg Sunday Courier at Newspapers.com
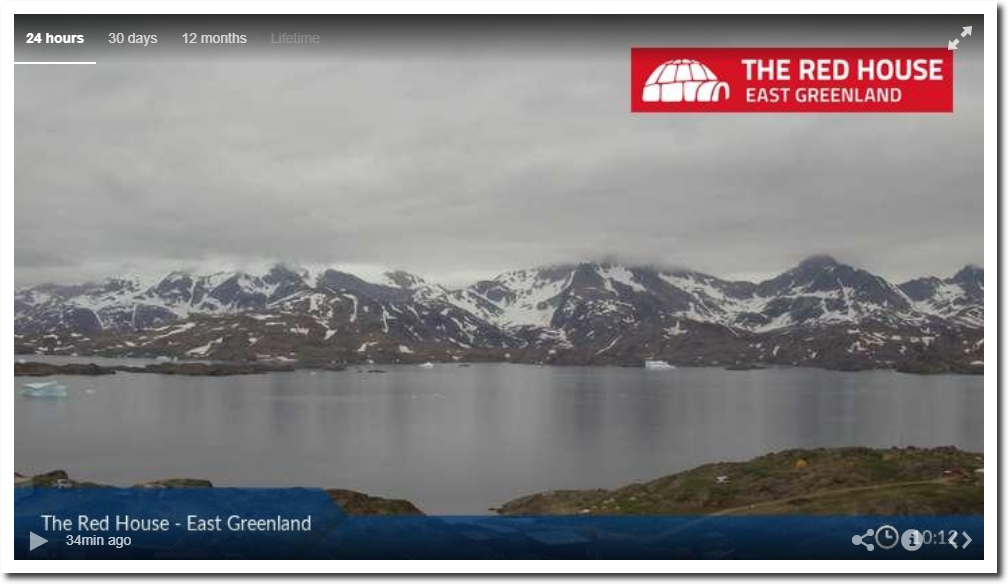
This is what Eastern Greenland looks like today at mid-summer.
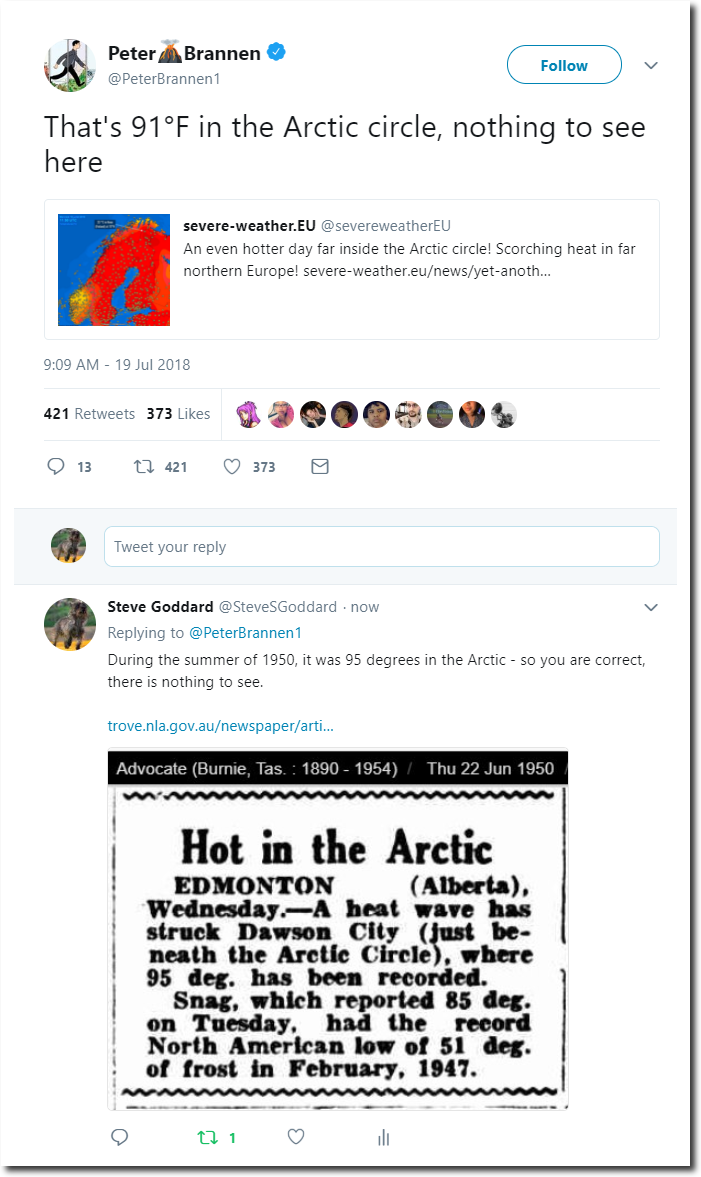
Arctic temperatures increased ten degrees during the first half of the 20th century.
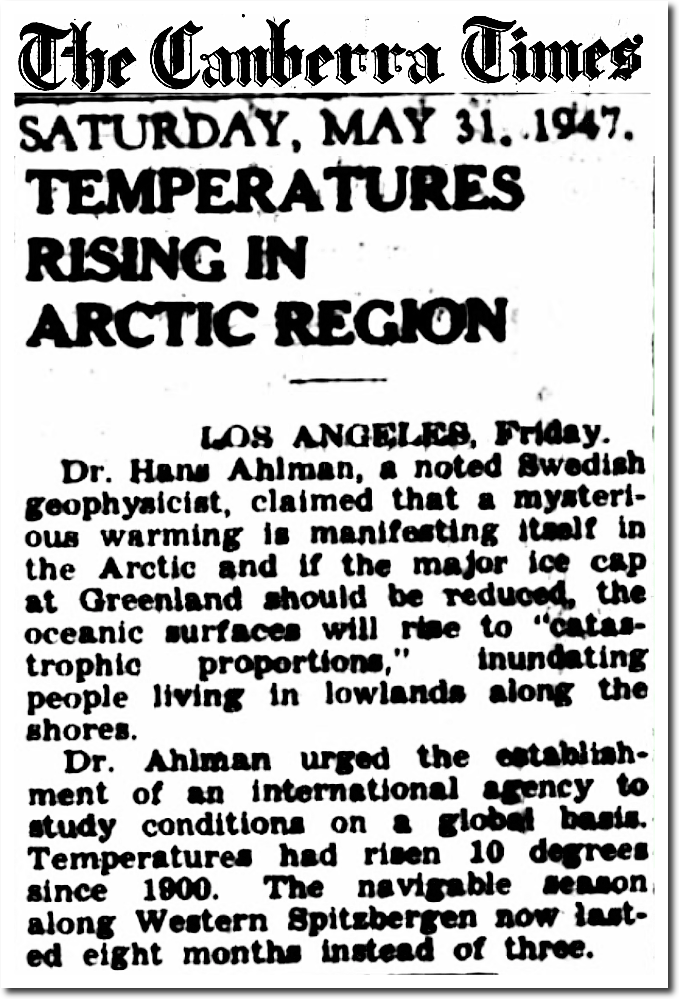
31 May 1947 – TEMPERATURES RISING IN ARCTIC REGION – Trove
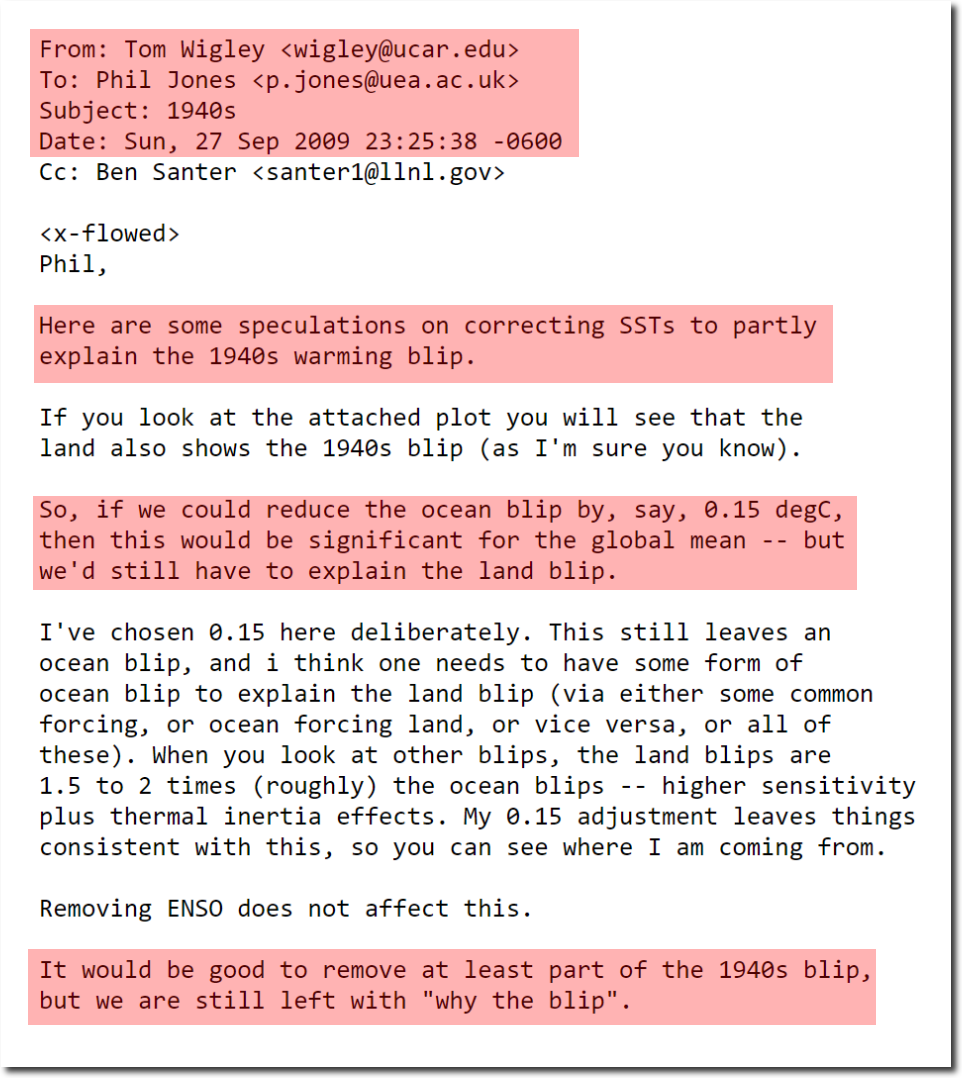
The Arctic warmth of the 1930’s and 1940’s wrecked global warming theory, so scientists who depend on global warming research funding simply erased it.
May 2018 Measured Vs. Adjusted
They altered the data, and didn’t even have their plausible deniability worked out yet.
All US intelligence agencies said Iraq had weapons of mass destruction.

9 May 2007, Page 7 – The Index-Journal
Putin questioned their claims.

Putin demands proof over Iraqi weapons | UK news | The Guardian
Democrats sided with Putin.

Now the same Democrats who sided with Putin, say it is treason to side with Putin.

Democrats were with Putin before they were against Putin, but only after they starved half a million Iraqi children to death over WMD’s Democrats didn’t even believe existed.
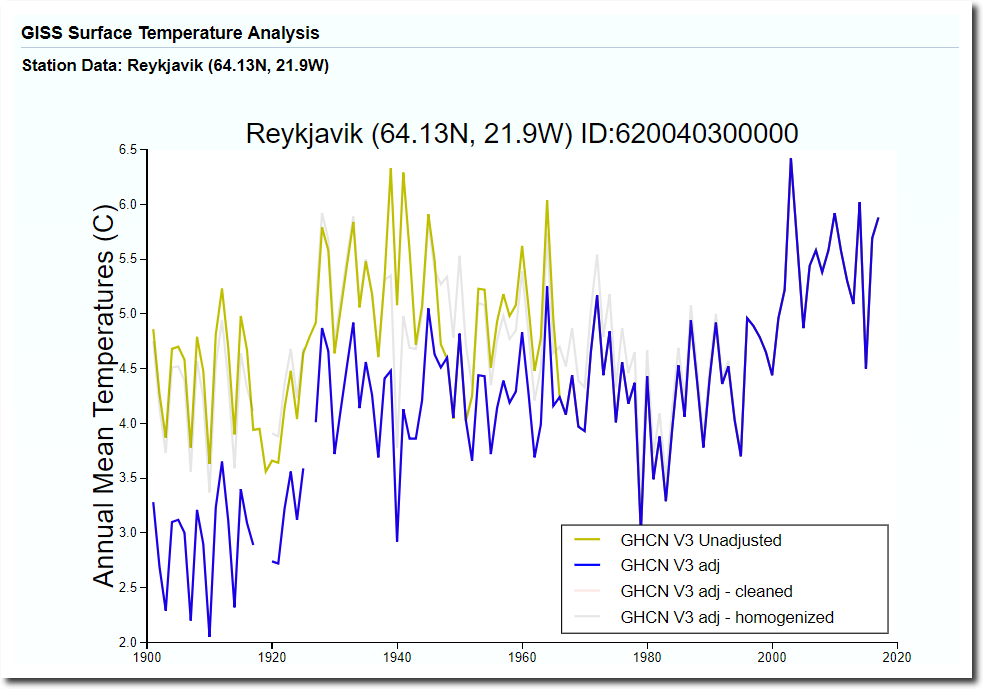
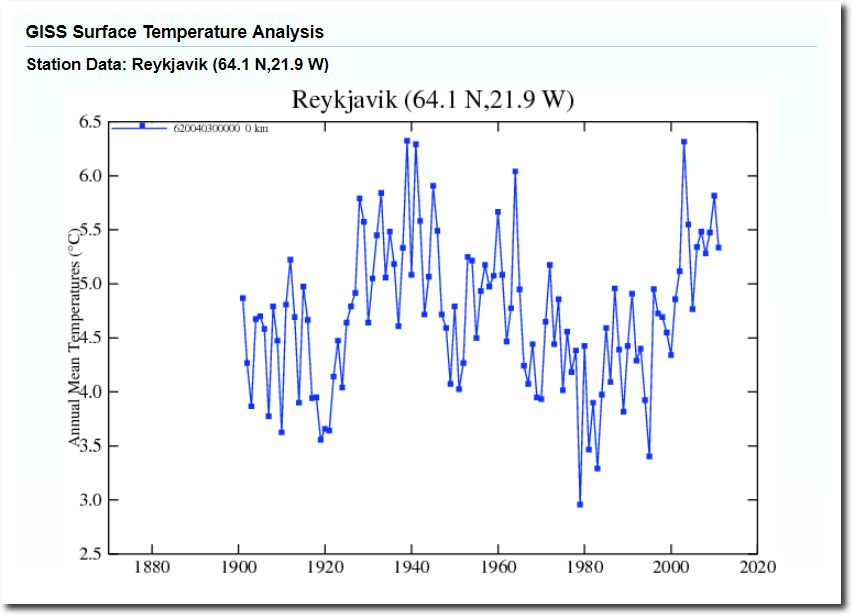
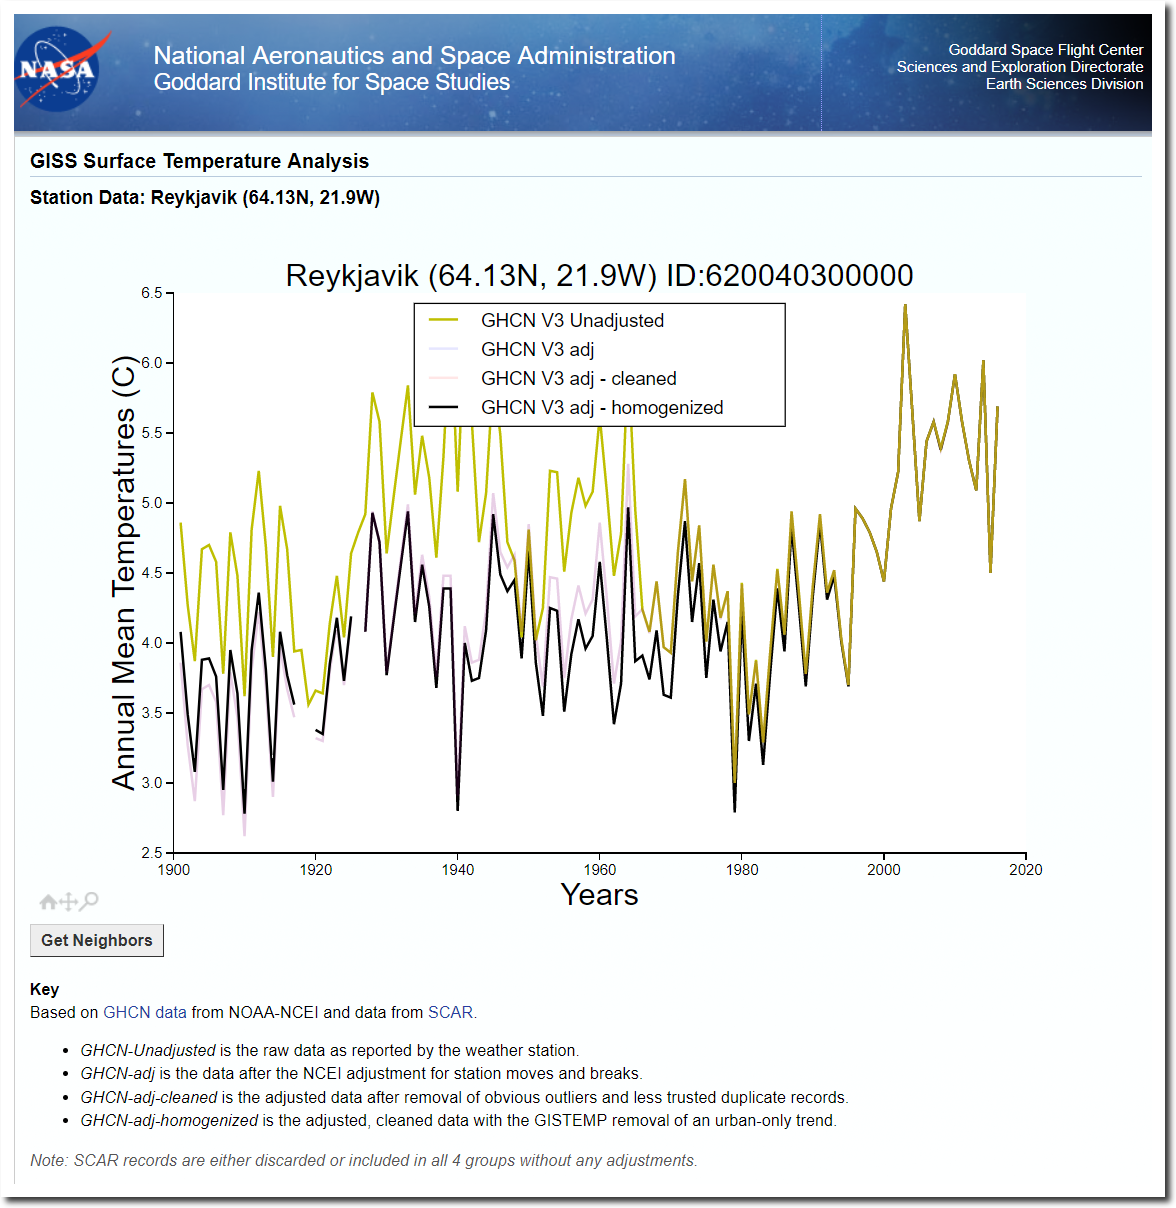
NASA and NOAA have massively altered the Reykjavik, Iceland temperature record over and over again, and have done it yet again – for at least the second time this year. The graph below is the actual data which shows that the 1940’s were warmer than recent years.
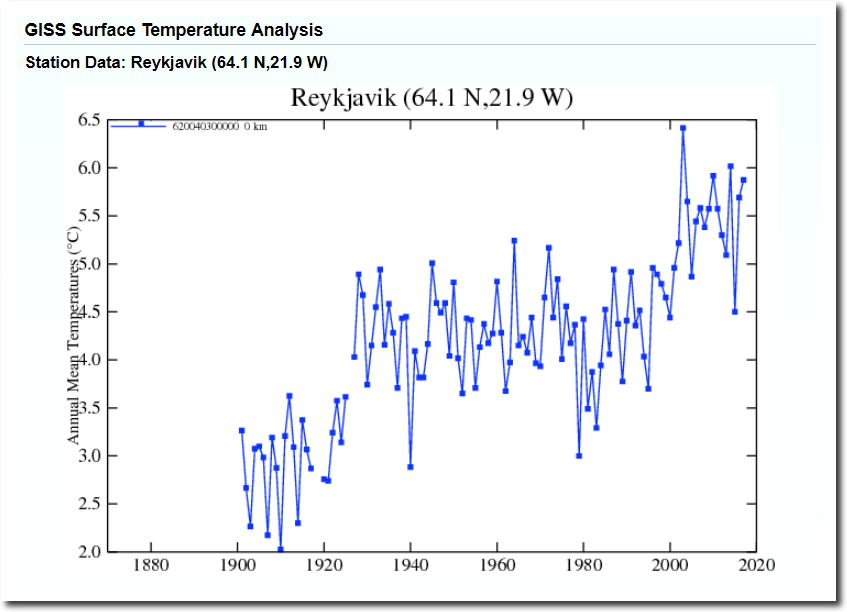
However, the adjusted data from the same data set shows something very different. The 1940’s warmth has been removed, just as Senator Roberts charged.
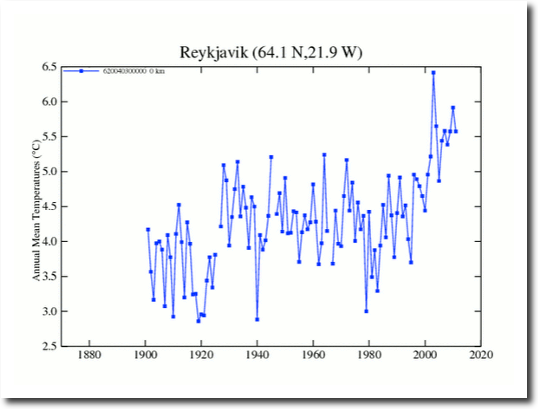
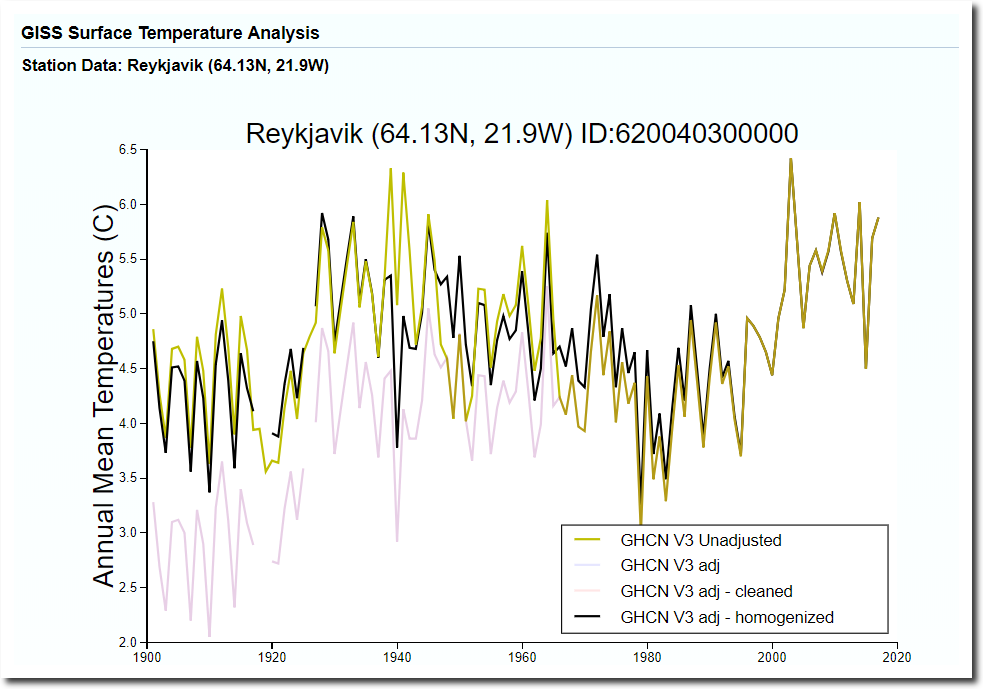
Here is another version of the NASA adjusted graph which was captured in 2012. It is different from the previous two versions.
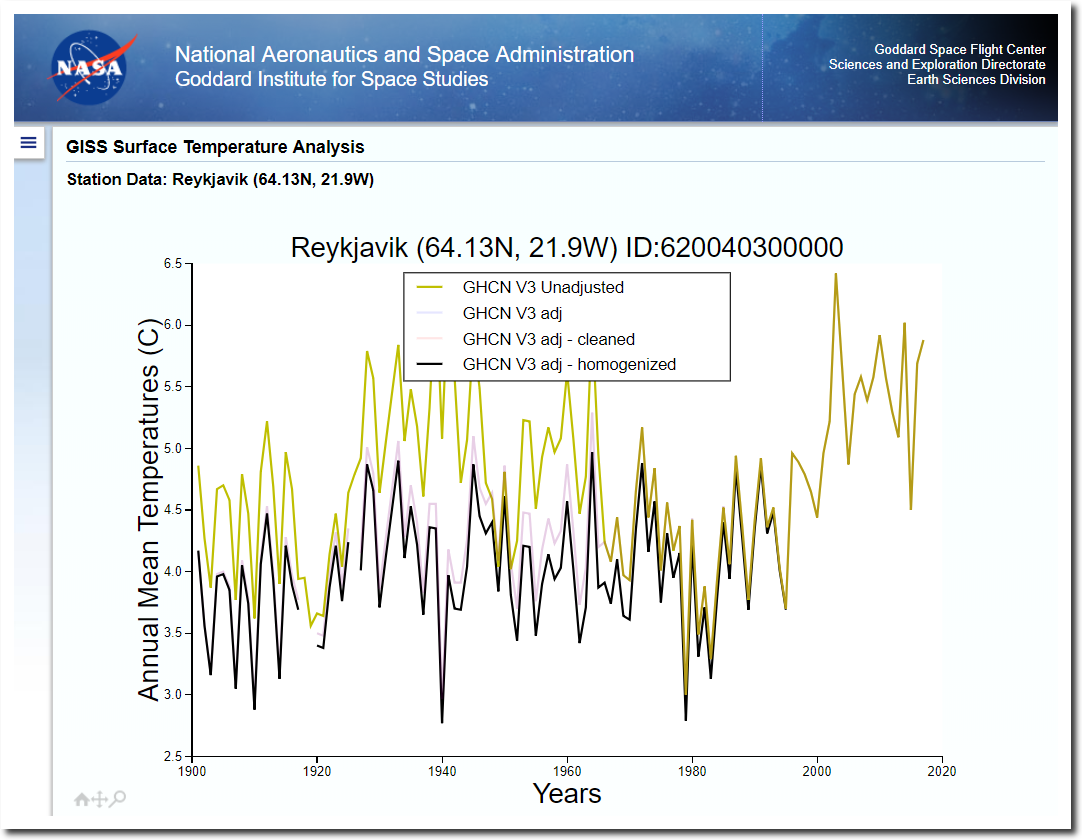
And another version from 2014 – again different from the previous three versions, but with the 1940’s warmth removed.
A fifth version was captured during October last year, with the 1940’s warmth still removed in their final, homogenized data. Note that this was almost one year after Senator Roberts wrote his letter to NASA, and that it shows exactly what Senator Roberts charged.
October 2017 V3 Measured Vs Homogenized
The current NASA adjusted temperature graph still shows the 1940’s warmth removed.
May 2018 Measured Vs. Adjusted
The May NASA homogenized graph restored most of the 1940’s warmth – indicating that there was never any reason to tamper with the data.
May 2018 Measured Vs. Homogenized
But the July, 2018 temperature graph has returned to their prior fraudulent version.
July 2018 Measured Vs. Homogenized
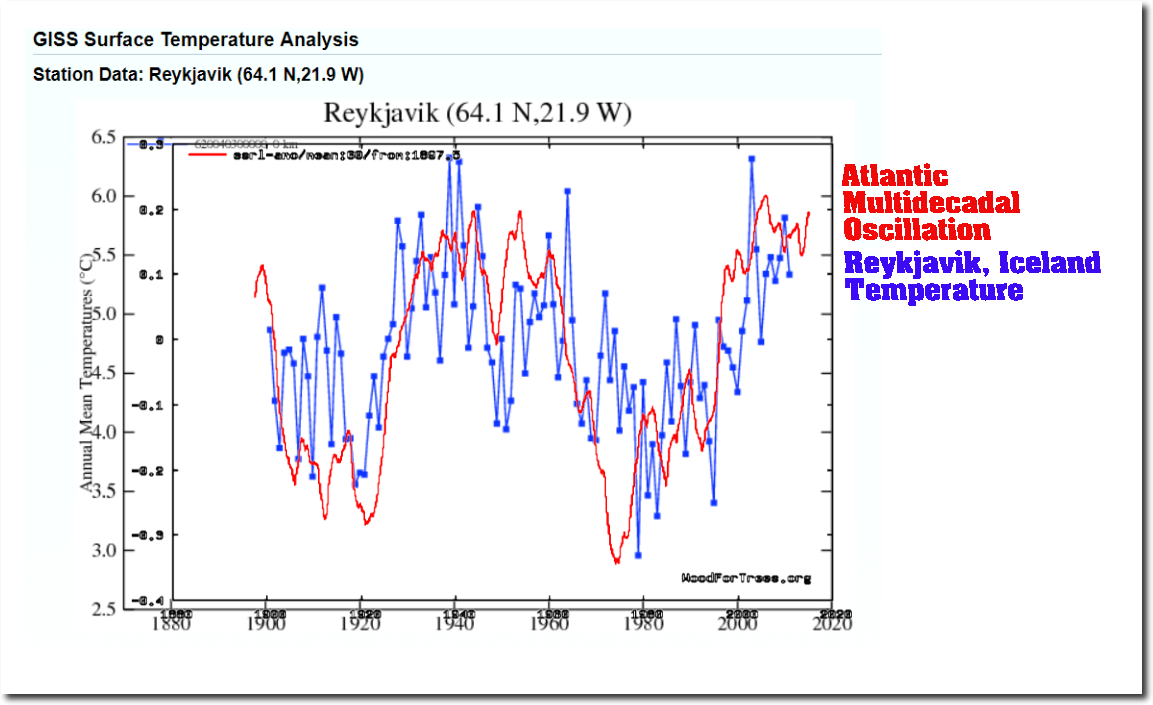
The reason it is so important for climate scientists to make the 1940’s warmth disappear, is that it shows what actually drives the climate – and destroys their multi-billion dollar scam.
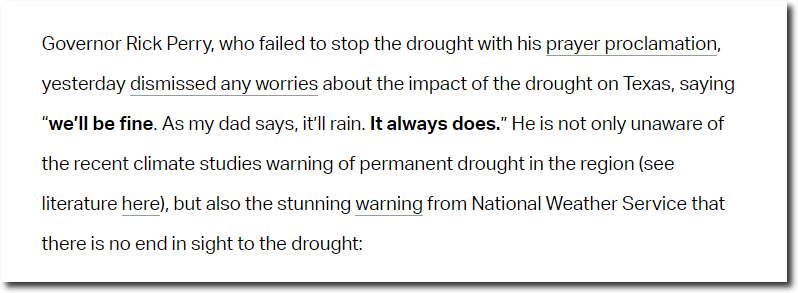
“we’ll be fine. As my dad says, it’ll rain. It always does.”
- Texas Governor Rick Perry Summer, 2011
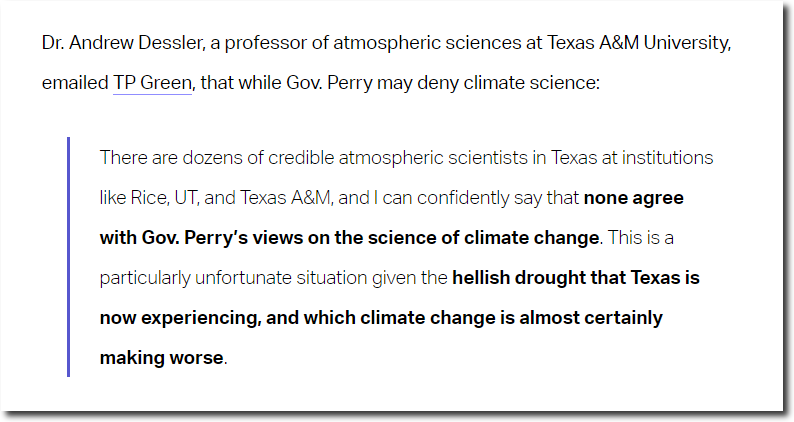
Seven years ago, our top climate experts said Texas would be hot and dry for the rest of the century, and they ridiculed Governor Perry for praying and pointing out the obvious – that drought is always followed by rain.
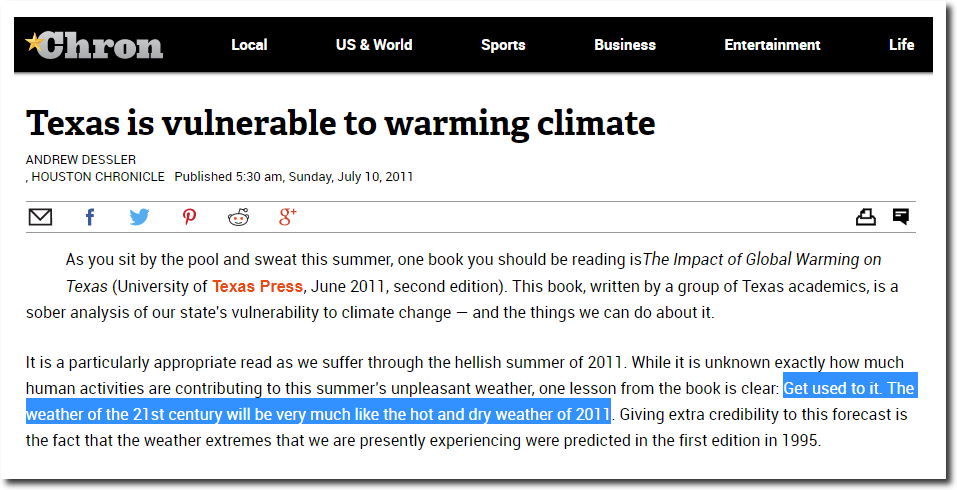
Texas is vulnerable to warming climate – Houston Chronicle
Rick Perry was correct. Since 2011, Texas has been having some of their wettest years on record.
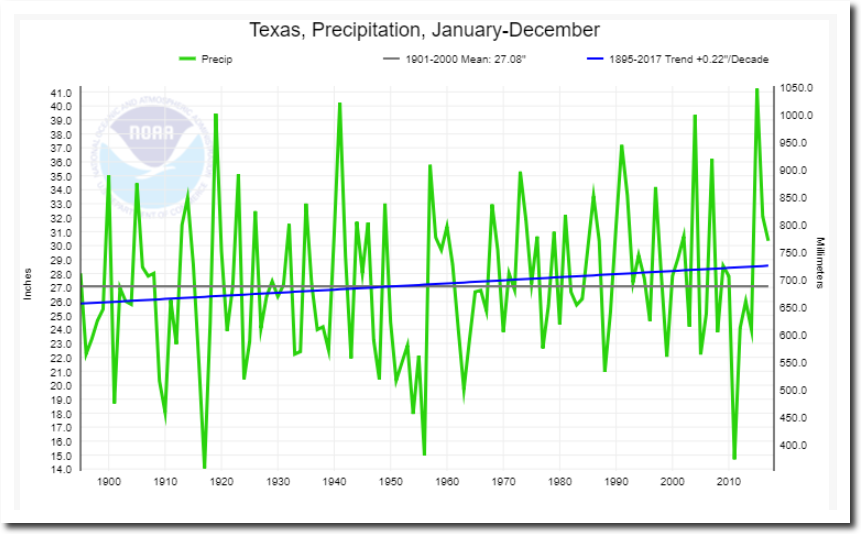
Climate at a Glance | National Centers for Environmental Information (NCEI)
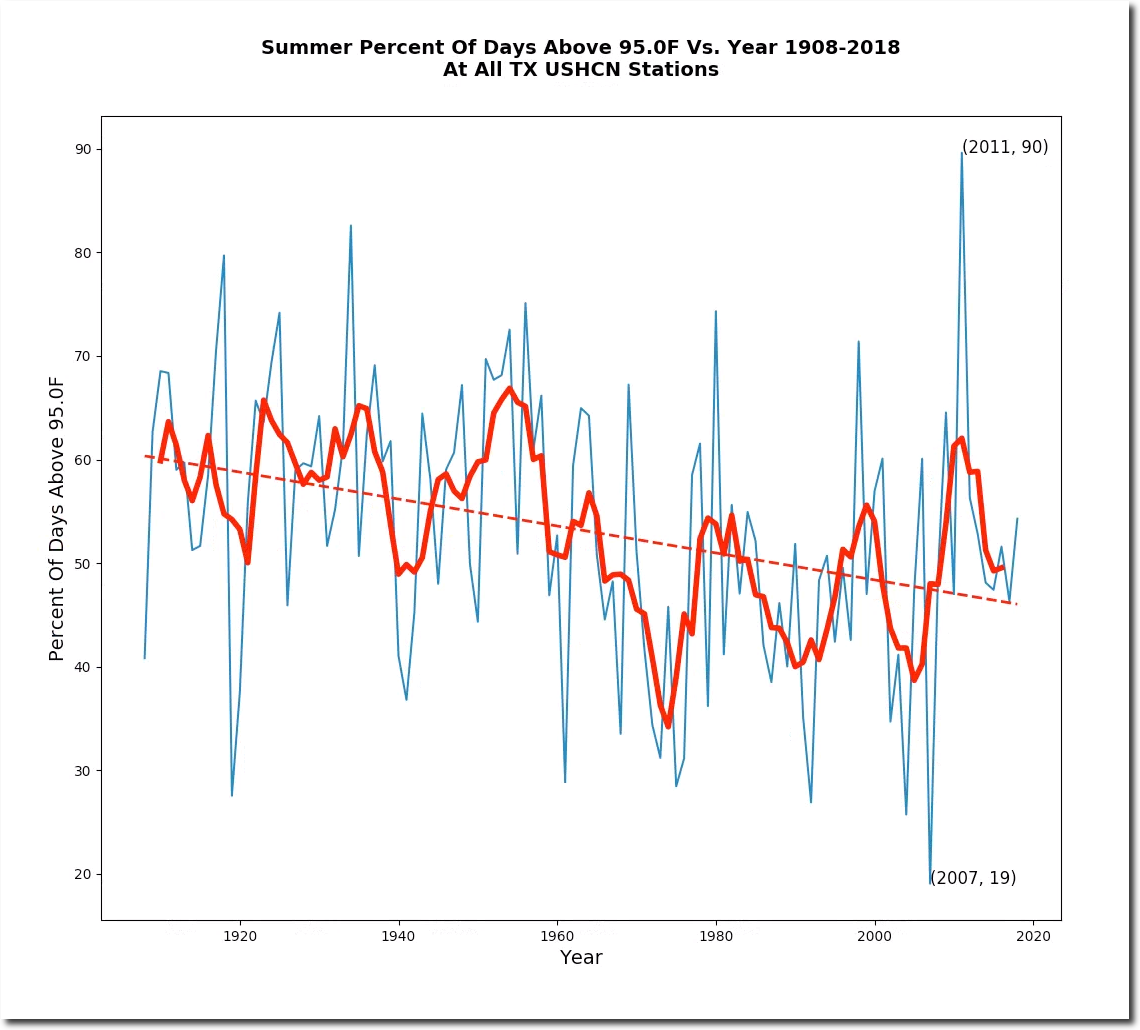
The frequency of hot days in Texas has been declining for 110 years – 2011 was a hot outlier, just as 2007 was a cool outlier. Rick Perry’s statement was based on long term observation, whereas the climate experts based their junk science on a single short term weather event.
And now, the same climate snake oil saleswomen who predicted permanent heat and drought, are blaming the rain on global warming.
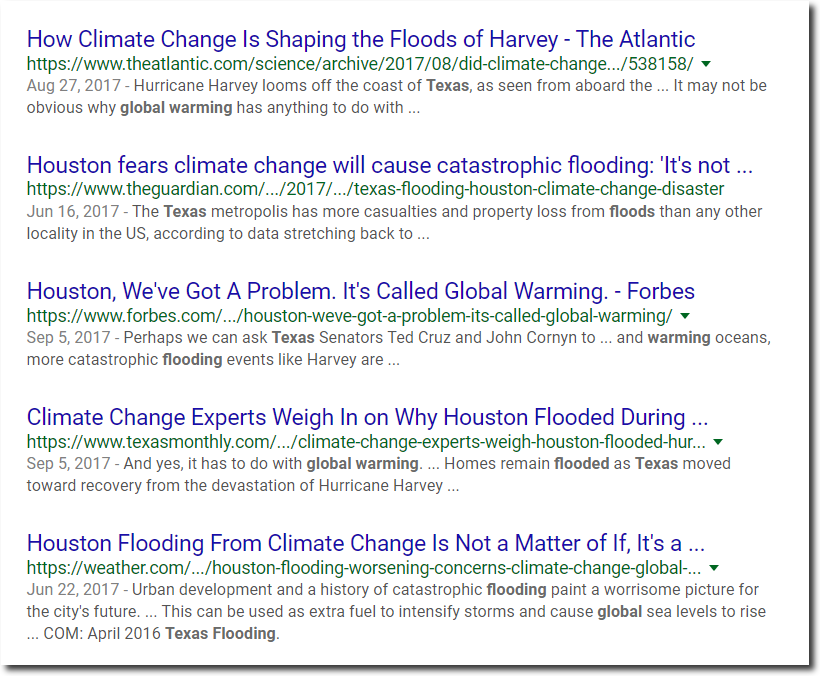
The complete lack of integrity and skill by these people is nothing short of stunning.
Democrats oppose voter ID laws (like they have in Mexico) exactly because they want foreigners interfering in US elections. Democrats describe their own behavior as “treason.”

