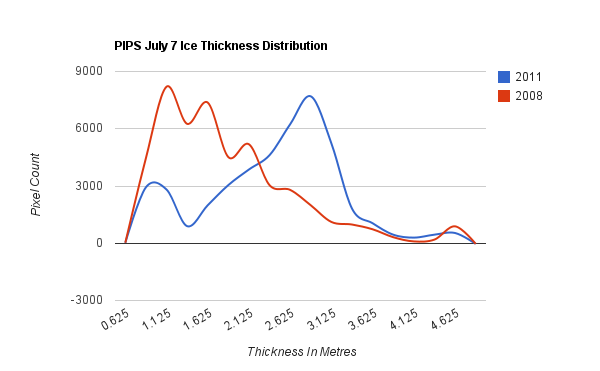
The graph below plots the PIPS July 7 ice thickness distribution for 2008 and 2011. 2008 had more ice area, but the ice was much thinner. As a result, a lot of ice melted in August and September. That is less likely to happen in 2011 because the ice is thicker and located at higher latitudes.
Disrupting the Borg is expensive and time consuming!
Google Search
-
Recent Posts
- “Why Do You Resist?”
- Climate Attribution Model
- Fact Checking NASA
- Fact Checking Grok
- Fact Checking The New York Times
- New Visitech Features
- Ice-Free Arctic By 2014
- Debt-Free US Treasury Forecast
- Analyzing Big City Crime (Part 2)
- Analyzing Big City Crime
- UK Migration Caused By Global Warming
- Climate Attribution In Greece
- “Brown: ’50 days to save world'”
- The Catastrophic Influence of Bovine Methane Emissions on Extraterrestrial Climate Patterns
- Posting On X
- Seventeen Years Of Fun
- The Importance Of Good Tools
- Temperature Shifts At Blue Hill, MA
- CO2²
- Time Of Observation Bias
- Climate Scamming For Profit
- Climate Scamming For Profit
- Back To The Future
- “records going back to 1961”
- Analyzing Rainfall At Asheville
Recent Comments
- Bob G on Climate Attribution Model
- Bob G on Climate Attribution Model
- Bob G on Climate Attribution Model
- Bob G on Climate Attribution Model
- John Francis on Ice-Free Arctic By 2014
- Bob G on Climate Attribution Model
- Bob G on Climate Attribution Model
- Bob G on Climate Attribution Model
- Robertvd on “Why Do You Resist?”
- arn on “Why Do You Resist?”


That huge, thick chunk of ice is melting very slowly. We will probably be quite pleased with the September numbers. In six weeks or so, we should know the story.
How do those plots compare with 2010?
-Scott
2010 was similar to 2011, but 2010 had a lot of thick ice near 70N latitude in Siberia. This year the thick ice is north of 75N and is less likely to melt.