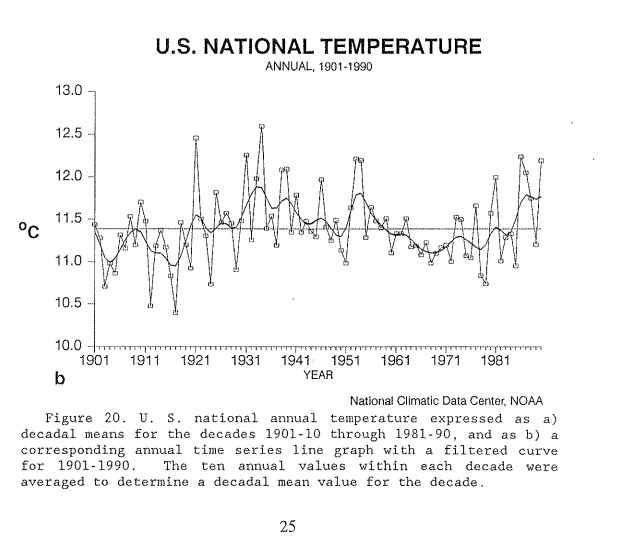
Bill Illis found this NCDC graph from 1991. It correctly shows that 1934 and 1921 were the two hottest years in the US.
www1.ncdc.noaa.gov/pub/data/cmb/bams-sotc/climate-assessment-1981-1990.pdf
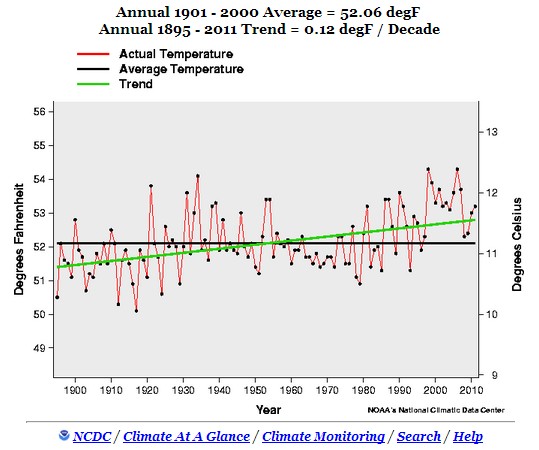
The graph below is NCDC’s current US graph.
CONTIGUOUS UNITED STATES Climate Summary
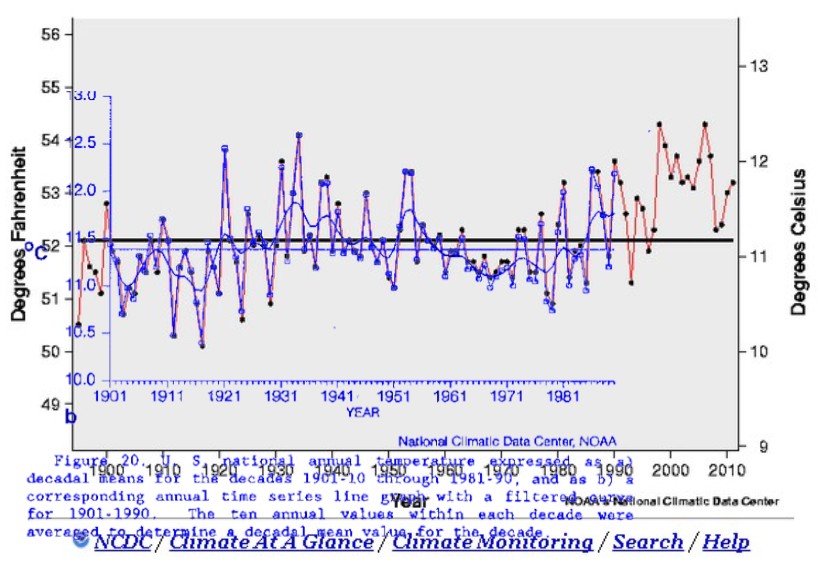
I overlaid them on each other, normalized to 1934. The 1991 version is shown in blue below.
Two things become clear
- They cooled all pre-1970 temperatures by nearly 0.4C. Note how the 10C line is about 0.4C lower on the old graph than on the current graph.
- After 1970, all current graph temperatures are increasingly raised. The 1990 temperature in the 2012 graph is 0.2C above its value in the 1990 graph.
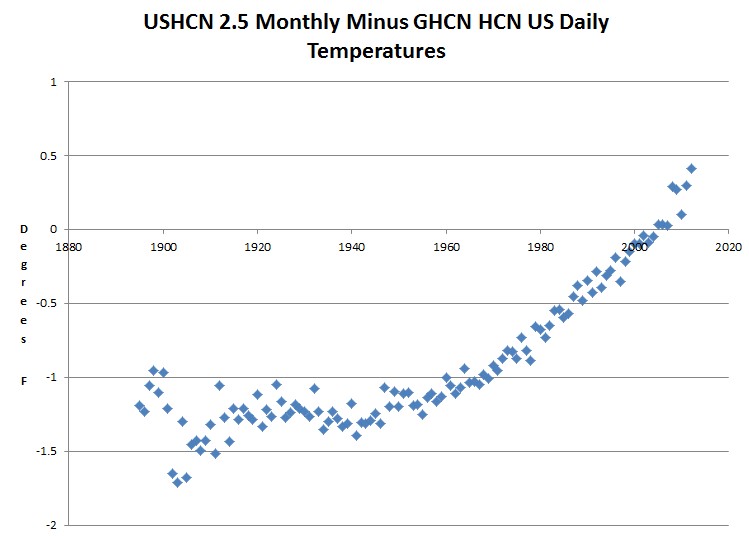
This graph doesn’t show any of the damage done after 1990, but you can see that it increases exponentially by comparing versus GHCN HCN temperatures.
Index of /pub/data/ushcn/v2.5/
Conclusion – NOAA/USHCN/GISS/NCDC US temperature trends are a complete fraud.


Steven offf topic but have you noticed that the Naval Research lab can measure the ice thickness in Hudson Bay at locations where the NSICD and Canadian Ice Services can’t see any ice …. funny how that works 😉
Also with all the cold in the Arctic how is DMI still calculating above average temps … any idea where their “hot spot” is or is it all in the magical adjustments?
I think the DMI temperatures are probably pretty accurate. There are still a lot of areas of open water which hold temperatures up.
Steven I guess that would be my point … looking at the Arctic ocean north of 80 lat & depending on whose site you look at the only open water is at Svalbard … likely on the northwest portion of the coast and so with lots of cold elsewhere it seems that the Svalbard area temps are punching above their weight on the DMI graph. Anyway this was just a FYI / what do you think . Too many sites just can’t ever bring themselves to show a temp or other data that doesn’t support the alarmism.
This fraud should be prosecuted as a form of treason.
National security could become impaired by crippling regulations imposed on society and businesses. Throw the bums in jail.
so how many papers on all this perpetual bull shit have you submitted to the AGU conference this month to publically make your claims of lying, cheating and stealing?
Let this government agency publish their methods so they can be replicated. As for published papers on this issue how about these:
http://www.agu.org/pubs/crossref/1989/JD094iD03p03359.shtml
http://www.agu.org/pubs/crossref/2009/2009JD011841.shtml
http://journals.ametsoc.org/doi/abs/10.1175/1520-0426%282003%2920%3C613%3AEEOVOM%3E2.0.CO%3B2
http://link.springer.com/article/10.1007%2FBF01095157
http://www.agu.org/pubs/crossref/2007/2006JD008229.shtml
If you want 20 more papers on this topic, dumb arse, just yell.
Here you go:
http://www.agu.org/pubs/crossref/1989/JD094iD03p03359.shtml
1989 – does not seem to have changed the science. where is you name on any of these shithead?
Yeap, they have been complaining about this bullshit for decades. Or look at the latest papers if you care.
A few more:
http://www.agu.org/pubs/crossref/2009/2009JD011841.shtml
http://journals.ametsoc.org/doi/abs/10.1175/1520-0426%282003%2920%3C613%3AEEOVOM%3E2.0.CO%3B2
And another two:
http://link.springer.com/article/10.1007%2FBF01095157
http://www.agu.org/pubs/crossref/2007/2006JD008229.shtml
(I’d post several dozen, but WordPress will moderate the post if I add too many external links.)
Here is another one address issues with USHCN:
“The United States Historical Climatology Network (USHCN) temperature database is commonly used in regional climate analyses. However, the raw temperature records in the USHCN are adjusted substantially to account for a variety of potential contaminants to the dataset. We compare the USHCN data with several surface and upper-air datasets and show that the effects of the various USHCN adjustments produce a significantly more positive, and likely spurious, trend in the USHCN data.”
http://www.agu.org/pubs/crossref/2002/2002GL014825.shtml
You shouldn’t have been so harsh with him. He’s probably off drinking again now and will make a profanity laced post after the bars close down.
He is so dopey he actually imagines there is no published research highlighting these problems (again and again and again) in the scientific literature. I’m aware of around 60 papers pointing to problems with land surface temperature estimates, and I’ve read at least a half dozen of them myself.
And a priori these data have always been problematic, and sensible people have recognized this (e.g. in a nice 1953 paper by Mitchell which I don’t see cited here – it’s probably on your list). That’s why there’s a literature on systematic (and non-systematic) errors and trying to adjust for them. And these are often not fine-grained measurement errors; they’re “Oh, they moved the temperatue station 2 miles east in 1946” kinds of errors. These data were never meant to carry the burden that’s now been placed on them. That’s one reason, I think, for all this craziness.
And this in itself brings the credibility of anyone slavishly defending this stuff into question.
Why don’t you look at the data being presented here and comment on that? You always attempt to change the subject, which tells me you are either stupid or dishonest.
I always want to add that Bill Illis is a legend and if they ever have a Bill Illis fan club, I’ll join 😉
Where’s lil’ Davey Appel? He usually arrives about now to inform us that such incontrovertible evidence is bogus since it doesn’t jive with his communist worldview.
“Quamvis sint sub aqua sub aqua maledicere temptant.” However, I’d still recommend the reading of “A friend of the Earth” by your fellow-countryman T.C. Boyle in order to gain an insight (into human nature – to come full circle with reference to the Lycian farmers).