Disrupting the Borg is expensive and time consuming!
Google Search
-
Recent Posts
- Gaslighting 1924
- “Why Do You Resist?”
- Climate Attribution Model
- Fact Checking NASA
- Fact Checking Grok
- Fact Checking The New York Times
- New Visitech Features
- Ice-Free Arctic By 2014
- Debt-Free US Treasury Forecast
- Analyzing Big City Crime (Part 2)
- Analyzing Big City Crime
- UK Migration Caused By Global Warming
- Climate Attribution In Greece
- “Brown: ’50 days to save world'”
- The Catastrophic Influence of Bovine Methane Emissions on Extraterrestrial Climate Patterns
- Posting On X
- Seventeen Years Of Fun
- The Importance Of Good Tools
- Temperature Shifts At Blue Hill, MA
- CO2²
- Time Of Observation Bias
- Climate Scamming For Profit
- Climate Scamming For Profit
- Back To The Future
- “records going back to 1961”
Recent Comments
- Bob G on Gaslighting 1924
- Bob G on Gaslighting 1924
- arn on Gaslighting 1924
- conrad ziefle on Gaslighting 1924
- Gordon Vigurs on Gaslighting 1924
- conrad ziefle on Gaslighting 1924
- Robertvd on Gaslighting 1924
- conrad ziefle on Gaslighting 1924
- arn on Gaslighting 1924
- Gordon Vigurs on Gaslighting 1924
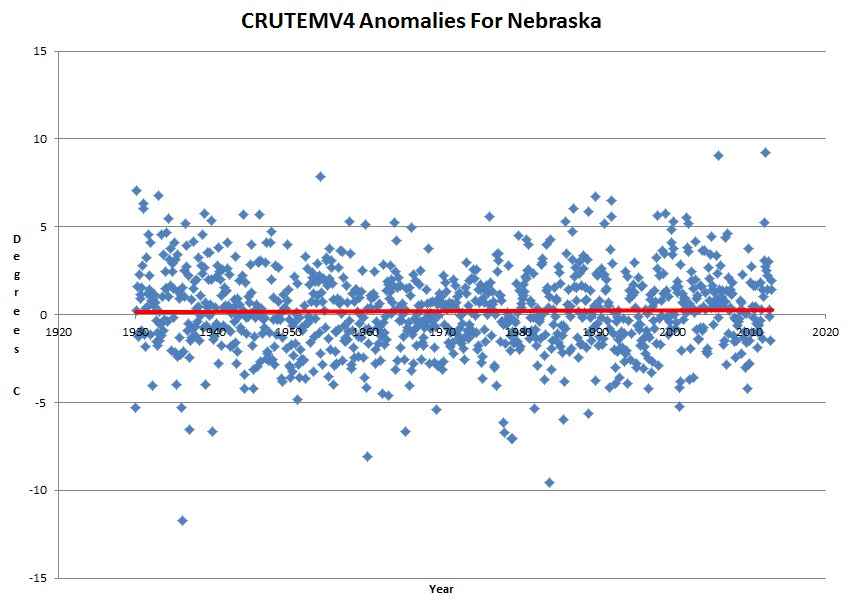
No Trend In Nebraska Temperatures Since 1930
This entry was posted in Uncategorized. Bookmark the permalink.


Steven, I find this graph interesting, but I am not able to find the data at the source indicated, so I am uncomfortable with it.
http://c3headlines.typepad.com/.a/6a010536b58035970c0168e55964fe970c-pi
I like that it is using actual records of Tmax and Tmin rather than Tmean or anomalies. If valid, it appears to show that what little warming has occurred is mostly due to higher minimums.
It seems to me that only hotter maximums can serve as a basis for alarm; milder overnights, and warmer and shorter winters can only be a good thing for humankind.