
Looking through the DMI records going back to 1958, it appears that summer north of 80N is getting off to the coldest start on record.
COI | Centre for Ocean and Ice | Danmarks Meteorologiske Institut
Looking through the DMI records going back to 1958, it appears that summer north of 80N is getting off to the coldest start on record.
COI | Centre for Ocean and Ice | Danmarks Meteorologiske Institut

But deadliest to the ice inside 80N
http://www7320.nrlssc.navy.mil/hycomARC/navo/arcticictn_nowcast_anim30d.gif
Oh, please. Winds from a winter storm has been spreading the ice near the pole and covering it with fresh snow.
You used to rely on that US Navy graph couple of months ago.
http://stevengoddard.wordpress.com/2013/04/09/us-navy-shows-twice-as-much-ice-as-piomas/
Are you now telling that US Navy data is incorrect? So maybe PIOMAS was right after all.
Huh? The Navy map shows exactly what I said. The ice near the pole has been getting spread by a winter storm.
So the ice has been crushed by a strom. Exactly what I said: deadliest to the ice inside 80N.
Jussi, with all due respect, no, that is not what you said. The headline you responded to was “Coldest start to the Arctic Summer on record.” You were not responding to “Arctic Ice Being Crushed By Storm.”
If you wish to disagree with a post, please do so honestly.
The ice wasn’t crushed, it just pushed out of that region.
AGW was supposed to have caused less wind from the Pole southward (well, everything is southward … )
Look it up, AR/4, “Modeling.”
$5 sent to anybody who can show anything that the “modeling” section projected correctly.
Brian — the models correctly predicted an increase in funding. Please send my $5 in the form of pennies dropped from LEO.
… and the effects of the storm will be different from last year due to colder temps, as it’s already showing up in the charts with 1million Km**2 more this year (so far) than 2012.
The warmists can’t win this, it’s a lose-lose situation for them… according to Mother Nature.
Obviously this means nothing.
Let’s face it, the climate has not changed, anywhere, to any recorded observation.
The climate may have changed only in the opposite direction to Warmist mantra. We’ll have to wait and see.
http://nsidc.org/data/seaice_index/images/daily_images/N_timeseries.png
Jimbo,
I wouldn’t be so sure about that: http://www.science20.com/chatter_box/around_arctic_june_2013-114816
Ok my God, 40-50% of the ice melts in that region every year for the last 10 thousand years or so and… wait for it… it’s poised to do THE SAME this year. We’re all going to die! 😉
Why don’t the evil deniers understand that the current melt is evidence that AGW is real and 97% of all scientists agree with this?
Which region Will?
My link has pictures and analyses of 12 different Arctic regions.
From your link I read…
That tells me nothing about the hear and NOW. What I do see is extent is better than last year NOW. The rest says what is happening now but does not tell me whether it’s worse than previous years or not. As you well know you will have to wait and see for the minimum in September extent whether you like it or not.
I meant HERE and now
Jimbo,
“That tells me nothing about the hear(?) and NOW”
Jimbo, that link I provided was of dozens of high-resolution photographs all taken in mid-June 2013 over 12 different regions of the Arctic. All the pictures were accompanied by analyses. This link was the very definition of here and NOW (well, at least it was when i first posted it)
See what man-made-global warming can do? ANYTHING!!!
It sure does a good job of fooling the stupid and gullible (like that’s something we wouldn’t have guessed was likely)
Alan Caruba calls it “Global Fooling”….
These are really, really, reeeeaally GREAT NEWS!! 😉
In the various graphics,
http://ocean.dmi.dk/arctic/meant80n.uk.php
Year 2004 compares well with 2013, especially after ~ day 120.
2004 was below the “climate” curve (barely, at the peak) during the entire summer. Even cold years like 1977 and 1978 reached the average curve at the peak of the summer, but not 2004.
2004 is “distant” (in time) from the minimum of cycles 23-24 (going backwards) by the approx. the same amount of time that we are from that period (going forward). Humm… this is looking interesting, indeed.
Steve,
Melt seasons at both poles tend to follow the calendar usage of “Summer” not the meteorological term. So you may want to hold off on that graph for a few more days yet.
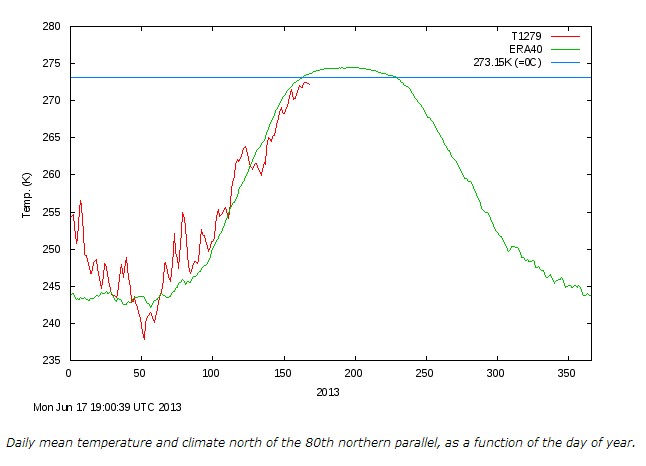
BTW, it is interesting to note from your graph that 2 days out of every 3 have been warmer than the average. Probably a contributor to the very thin ice up there these days.
If you knew how to read a graph you would probably see that the Arctic summer runs from about June 1 to August 31
Steve,
The Arctic Circle region itself is defined by the common calendar usage of summer and winter.
From the NSIDC: “The Arctic Circle marks the latitude above which the sun does not set on the summer solstice, and does not rise on the winter solstice. At the North Pole, the sun rises once each year and sets once each year: there are six months of continuous daylight and six months of continuous night.” http://nsidc.org/cryosphere/arctic-meteorology/arctic.html
FYI, June 21 2013 at 5.04 AM UTC marks the exact start of summer this year.
The seasons are arbitrary, you fool, there is nothing scientific to the definition.
The north pole is normally above freezing from June 1 to August 31. This year being a notable exception.
Brian,
i just showed you the definition of what constitutes the area of the Arctic Circle. If it was arbitrary then so must be the size and shape of the Arctic Circle.
You think the wind cares about your definition, shit head?
Brian,
It is not my definition. It is the definition used by scientists.
The only definition that’s going to matter is the middle of September. Period,.
Jimbo,
Right on.
RE: T.O.O – “The Arctic Circle region itself is defined by the common calendar usage of summer and winter. ” “If it was arbitrary then so must be the size and shape of the Arctic Circle.”
Also from the NSIDC, same link. Read further next time. : “But other people use different definitions when talking about the Arctic.”
Ben,
The definition of Arctic CIRCLE was as I just described.
even dokter trenburf sez duh heet came fwom duw wattur not duh air
By the way, you’re not a real troll, right? You’re just some poser like Motl, laughing under all the while.
I think it’s Tony B reincarnated…. 🙂
No! the real thing. Certain themes and phrases repeated.
Logic and truth never die.
Nonetheless you’re doing a good job of torturing it.
This gets filed under the WTF section of my memory warehouse.
You guys really, really are ingenious when it comes to making irrelevant comments. Anything to try to deflect attention from the basic point being made. Is there a special School for Sophists where you learn all these tricks?
In fact, I think it’s worth unpacking this statement:
As I interpret it, this sentence says that whenever the red line is above the green line, this means the ice is melting; otherwise I don’t understand how it can result in “very thin ice up there”. And this includes the cases where the green line is 30 degrees below freezing.
So I think the real question is, not whether the statement is true or false, but whether even the person who gives birth to such ideas considers his offspring to be legimitate. (Or is this more like a creature scattering eggs here and about, in the ‘expectation’ that some may hatch even if others don’t?)
rw,
On the graph, there is a horizontal line which represents 273k / 32F or the the freezing point of fresh water (sea water unfreezes at a lower temp).
These warmer Winters over the past few decades have contributed to the last 10 winter maximum extents all being ranked as the lowest in the satellite record and to an 80% loss in Arctic ice volume.
All things being equal, colder Winter temps will create thicker ice and a larger extent.
That thin rotten sickly ice must be the reason ice extent is the highest in a decade.
Geez T.O.O.. The last 3 decades of ice extent must prove to you how pointless the rest of the Earth’s history is, considering the last glacial maximum 20kya. Those 3 decades prove we’re doomed, according to you. But the rest of the solar system disagrees, considering temps have been rising on other planets too.
Olaf,
Other planets — really? Well, if that is true, then it must be for reasons other than increased solar output because we have satellites to prove that has happened.
Steve,
You are exactly right — it is thin “sickly” ice that is up there at the moment. Unfortunately it won’t be for much longer as summer starts Friday and all that 1st year ice will simply start to disappear.
The thin, sickly ice has been sitting around watching the calendar. On June 21 Al Gore will give it the go ahead to start melting.
Steve,
Only Al Gore? No Michael Mann or James Hansen or the Union of Concerned Scientists?
What does the horizontal line on the graph have to do with you statement that “2 days out of every 3 have been warmer than average”? Maybe I didn’t get the reference right to “your graph” – but the 2 days out of 3 statement certainly can’t refer to the horizontal line !!
Steve: any thoughts on when ice breakout at Barrow is likely to happen this year? The official prediction site seems defunct, but I’m sure you and your readers might have something to say. Earlier or later than average, perhaps?
I have no idea! Satellites show a very solid pack around Barrow.
http://www.arctic.io/observations/8/2013-06-17/8-N71.435537-W157.818153
Ummh, the Barrow web cam tells a different story. If you call this solid, then good night. I call that an ice swamp.
http://feeder.gina.alaska.edu/webcam-uaf-barrow-seaice-images/current/image
That is called surface melt, Homer. Do you think your satellite picture is lying?
No way. It is just your interpretation lacks the Alaska heat wave.
RE: Arcticio – “your interpretation lacks the Alaska heat wave”
That’s a heat wave? That’s not a heat wave. I’ll see your 10F anomaly and raise you 20F more.
Set your time machine for 1996, when the temp was 72F.
June 18th Barrow Current Avg Max
Max Temperature 52 °F 42 °F 72 °F (1996)
The radar shows that the satellite picture is not the whole story. It’s not a solid pack, but highly mobile (check out the videos at the bottom of the page). Indeed, only today, the fast ice fractured away around 1km from the shore – you can clearly see the huge dark crack in the main radar pic.
http://seaice.alaska.edu/gi/observatories/barrow_radar
The June SEARCH outlook gives an indication as to why:
We also have an “on the ice” report from north of Barrow by Oliver Dyre Dammann and Hajo Eicken, University of Alaska. Shorefast ice conditions along the northeastern Chukchi Sea coast (Barrow to Wainwright) reflect the combination of late freeze-up after the 2012 record minimum summer ice extent and persistent westerly flow advecting warm air throughout fall and early winter. The lack of major storms from the western/northern sector resulted in a shorefast ice cover that is potentially unstable due to the lack of grounded pressure ridges. The complete absence of multiyear sea ice in the region, confirmed by thickness surveys and local observations, is a first for the region in the past several decades.
Is there some reason why this is important?
On Tue, Jun 18, 2013 at 6:51 AM, Real Science
Peter,
I took your advice and looked at the full 10 day animation. There is greater ice cover now than on Jun 8th. Look at that huge hole on the 8th, and then watch it disappear as it gets filled back in.
Thanks. I downloaded the video to save as an example.
Such excitement like running away from high tide because the world is going to flood..
See http://www.drroyspencer.com/2013/06/who-dares-to-deny-arctic-warming/
There _were_ ways of looking at ice before.
I wouldn’t be surprised if we are getting also the coldest start of winter at the southern hemisphere.
http://www.stuff.co.nz/national/8812113/Residents-ready-for-heavy-snowfalls
http://www.farmingshow.com/news/regwn/1450876261–major-winter-storm–heading-for-welly
http://www.snowatch.com.au/new-zealand-snow-forecast.php
http://www.voxy.co.nz/national/very-cold-parts-south-island-wed-evening/5/158755
T.O.O.
Re: your link..
The “open water” you see via the satellite images is normal, it occurs every melt season around the periphery of the ice-pack as insolation increases and temperatures warm. Not unusual, and does not in any way give a clue as to what the final extent anomaly will be come September (that is determined by surface winds and cloud cover/insolation).
Obviously the arctic icepack is less extensive today than it was in the 1970s, but that’s the only conclusion you can come to at this time. Anything further crosses the line from theory to bigotry.
Folks are being hard on you because you’re using a “meltwater” photograph (meltwater is normal during any melt season ) to predict a catastrophic loss in future ice extent. That will get you laughed out of any scientific conference, trust me there.
phil,
“dominated by first year ice”;
“predominantly 1st year ice”;
“due to persistent losses of multi-year ice”;
“the volume is lower than was once normal”;
“This means that an ordinary Summer is sufficient to cause the ice to break up rapidly into mobile floes.”;
“Melt is proceeding there at what is now considered to be a normal pace – for July.”:
“The North East coast of Greenland is now one of the fastest warming areas in the Northern hemisphere.”
“annual cycle of mainly first-year ice”;
“The region is clearly warming.”
This is “not unusual”?