

Disrupting the Borg is expensive and time consuming!

Google Search
-
Recent Posts
- One Atomic Bomb Per Hour
- New Video : Analyzing Oil And Gas
- Is Antarctica Melting?
- High Speed Analysis And Visualization
- El Nino To The Rescue?
- Fake News Update
- Growth Of Antarctic Sea Ice
- 65 Years Of Progress!
- El Nino To The Rescue?
- Worst March Drought On Record
- ChartGL Process Control Demo
- The Biggest Money Laundering Scam
- Drought In The Headwaters Of Lake Powell
- Unrealistic Expectations Of Water Availability
- Did Bill Gates Do This?
- Worst March Drought On Record In The US
- The Real Hockey Stick Graph
- Analyzing The Western Water Crisis
- Gaslighting 1924
- “Why Do You Resist?”
- Climate Attribution Model
- Fact Checking NASA
- Fact Checking Grok
- Fact Checking The New York Times
- New Visitech Features
Recent Comments
- Jack the Insider on One Atomic Bomb Per Hour
- arn on One Atomic Bomb Per Hour
- Bob G on One Atomic Bomb Per Hour
- Bob G on One Atomic Bomb Per Hour
- Bob G on One Atomic Bomb Per Hour
- Hank Phillips on One Atomic Bomb Per Hour
- Hank Phillips on One Atomic Bomb Per Hour
- Bob G on One Atomic Bomb Per Hour
- Bob G on One Atomic Bomb Per Hour
- Bob G on One Atomic Bomb Per Hour
How appropriate that he’s got “Collaborators”, eh?
yes, but just wait until the ice is gone during the winters!!!…shaking head….
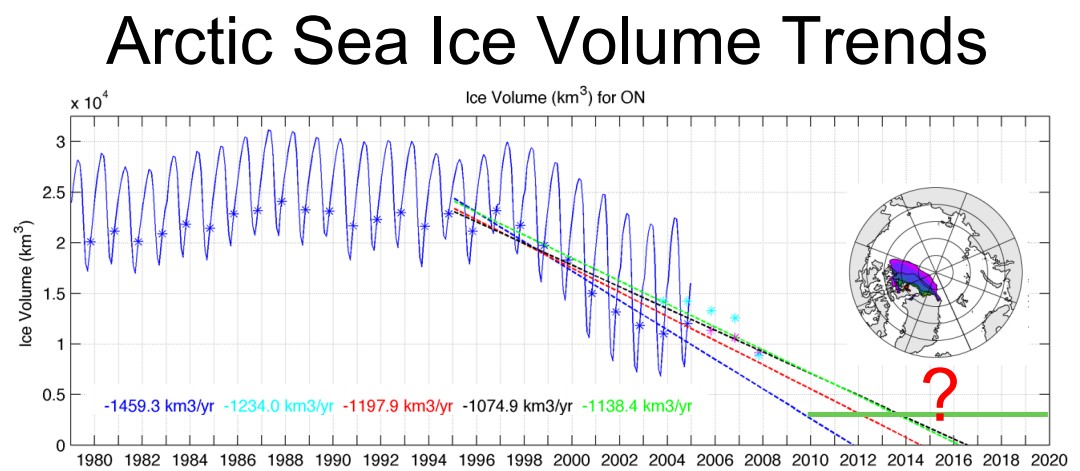
I guess they didn’t get the XKCD comic on extrapolating.
http://imgs.xkcd.com/comics/extrapolating.png
Did anyone ever question as to why the trend through 1998 was essentially positive and then suddenly start tanking?
-Scott
They need to rethink their volume equations. This is a good year to do so, with the melt and melt-water at a minimum. You find a time and place where the ice remains as thick, (un-melted by water underneath,) and locate two large, flat plates, moving towards each other. You know area is decreasing, as a pressure ridge piles up where the two plates meet, but volume remains the same. From then on that plate, (or two plates joined to be one,) has a higher volume attached to it. Even if the two pieces split (forming a “lead”) and some open water appears between the two, the total volume of the two remains higher.
With so much grant money floating around, surely there is some fellow who could take on this task.
So, what makes the authors think that a non-linear system will have a linear trend?
They start by ignoring all data prior to 1979, and calculate trends from a local maximum.