Disrupting the Borg is expensive and time consuming!
Google Search
-
Recent Posts
- Gaslighting 1924
- “Why Do You Resist?”
- Climate Attribution Model
- Fact Checking NASA
- Fact Checking Grok
- Fact Checking The New York Times
- New Visitech Features
- Ice-Free Arctic By 2014
- Debt-Free US Treasury Forecast
- Analyzing Big City Crime (Part 2)
- Analyzing Big City Crime
- UK Migration Caused By Global Warming
- Climate Attribution In Greece
- “Brown: ’50 days to save world'”
- The Catastrophic Influence of Bovine Methane Emissions on Extraterrestrial Climate Patterns
- Posting On X
- Seventeen Years Of Fun
- The Importance Of Good Tools
- Temperature Shifts At Blue Hill, MA
- CO2²
- Time Of Observation Bias
- Climate Scamming For Profit
- Climate Scamming For Profit
- Back To The Future
- “records going back to 1961”
Recent Comments
- conrad ziefle on Gaslighting 1924
- arn on Gaslighting 1924
- Gordon Vigurs on Gaslighting 1924
- Bob G on Climate Attribution Model
- conrad ziefle on Climate Attribution Model
- Ohio Cyclist on Climate Attribution Model
- Bob G on Climate Attribution Model
- Bob G on Climate Attribution Model
- Bob G on Fact Checking NASA
- arn on Climate Attribution Model
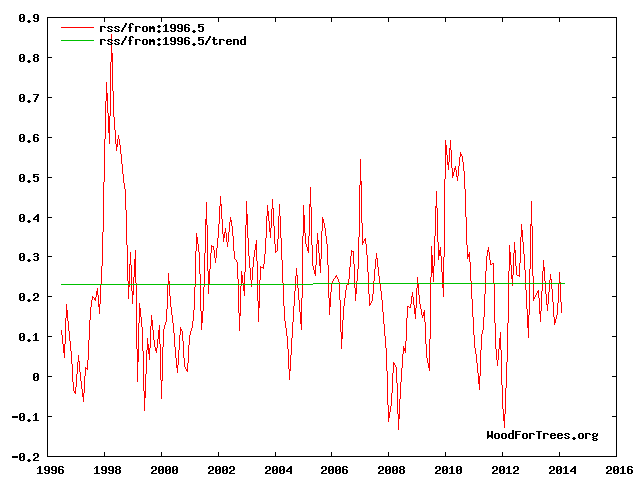
Hockey Stick Update : 18 Years Of No Warming
This entry was posted in Uncategorized. Bookmark the permalink.


are these the recorded temps or the “corrected” temps?
RSS is satellite data. There is not adjustment for TOB, UHI or site changes in RSS (or UAH).
Ever wonder why propagandists like that always use ~1998 as the starting date? It’s because there was an anomalous data spike that year that makes it _appear_ like there hasn’t been any significant warming since then. It’s like comparing the temp of Minnesota in the summer to today to pretend that climate change “is a fake.”
Climate science deniers have used this trick before, anytime there is an anomalous year they can exploit to confirm their bias instead of genuinely examining the data. All shown on this chart: http://www.skepticalscience.com/graphics.php?g=47
Another thing, this chart only refers to some atmospheric data stations, completely ignoring how much heat is being absorbed into the oceans: http://skepticalscience.com/global-warming-stopped-in-1998.htm
The graph starts in 1996, you moron.
ROFL
Science deniers are the retards who reference SkepticalScience. You have no idea how low the reputation of that website is, nobody with a ganglion for a brain would ever cite it. John Cook is a screwball who chases comets. Dana has a very low IQ and doesn’t know science from science fiction. I can’t even say ROTFL because that means I think you’re funny. I wish there were a way to say vomit online. Really? Skeptical science? You might as well cite tiny tots.
I thought SS was gone,but TT are doing well.
You Forgot that Dana works for BIG OIL! ….Run screaming….
Another paid shill? Throwing skeptical science junk in here is like throwing sheep to lions. It will be ripped to shreds.
You guys aren’t funny anymore. Just pathetic.
You start at the PRESENT and work backwards until you get a positive slope.
The reason?
It is all about the statements made by Warmists:
1. Prof. Phil Jones saying in the Climategate emails – “Bottom line: the “no upward trend” has to continue for a total of 15 years before we get worried.” Also see: interview with Judith Curry and Phil Jones
2. Ben Santer in a 2011 paper “Our results show that temperature records of at least 17 years in length are required for identifying human effects on global-mean tropospheric temperature.” onlinelibrary(DOT)wiley.com/doi/10.1029/2011JD016263/abstract
3. The NOAA falsification criterion is on page S23 of its 2008 report titled The State Of The Climate
4. We are looking at no changes in temperature over a period longer than the 10 years that James Hansen once said would show the models wrong;
So the falsification criteria is 15 years to 17 years. That is why we start at the present and count backwards. Once we hit 17 years The Goose is Cooked. Unfortunately the Goose seems to be a zombie and keeps rising from the dead.
Anyone have silver bullets, garlic and a wooden stake?
“You start at the PRESENT and work backwards until you get a positive slope.” Why is that so hard to understand?
Mr. Goddard, you are a prick of the highest order. One day, if we do meet, I’m buying. Damned few of us left.
I clicked that second SketchyScience link and they show a graph that Nuccitelli drew with a crayon.
Skeptical Science also known by SS, especially when dressed in Nazi garb.