
We employed a simple zero-dimensional Energy Balance Model (“EBM”—see references 1 through 5 below) of the form
C dT/dt = S(1-a)/4 + FGHG –A–B T + w(t)
to model the forced response of the climate to estimate natural and anthropogenic radiative forcing.
Why Global Warming Will Cross a Dangerous Threshold in 2036 – Scientific American
An actual scientist would compare his assumptions about CO2 sensitivity versus measured data, and realize that his assumptions are wildly off-base. But Mikey apparently doesn’t come in that category.

Boy oh boy, the “adjusters” sure have their work cut out for them.
Mickey Mann does seem to have a thing for hockey sticks but I doubt he knows how to shoot a puck … more likely he would hump a hockey stick like sex crazed poodle.
Make that “like a sex crazed poodle with its own private jet.”
Ok I did a little looking at MM equation. The mistaken belief that MR SUN is a constant is one of his mistakes, this is from his article in Scientific American, “S ? 1370 Wm-2 is the solar constant”. This means MM is not taking into account the variable of MR. SUN.
All the better to demonstrate the chicanery, when Mr. Sun continues into a low cycle.
I assume we can expect historical measured energy output for the sun to be adjusted downward over the next few years?
Oh, as Monty Python’s lady said, thinking of “professor” Mann:
“I’m a simple soul, and I don’t understand all that”.
Mikey played one too many hockey games without wearing a helmet.
well, it does have a lot of mathy symbols and characters so it must be true.
the S in MM factor can be a variable by as much a .1% from the minimum to maximum. Being that we are now in the 4th year of the up side of the the solar 11 year cycle and the fact that the global temperature has been dropping or staying the same (something even the global warming group has admitted) for the last 13-15 years logic would dictate that in 4-5 years when MR.SUN’s output begins to fall we are in for some major global cooling.
Our maximum for this cycle is less than half of each of the previous two cycles, so it is very weak already. Magnetism is down, and particle streams are also weak for this cycle. Fewer prominences are a result of reduced magnetic field strength.
Sure sounds like Mr. Sun’s Modern grand maximum of activity had a lot more to do with the rising temp and the current fall of than CO2 does.
I think that’s now actually considered a smaller problems relative to the solar-driven cloud effects, which I’m not sure Mann even considers.
The Climastrologist keep spouting on about how TSI doesn’t change more than an itty bitty bit. (Their very scientifical language)
However UV and EUV was recorded as having changed 6% in 2009. This effects ozone formation and destruction, and the amount of energy actually penetrating the seawater.
Also phytoplankton convert DMSP into DMS when they’re stressed by ultraviolet radiation from the sun. DMS moves from the ocean to the air and acts as a nucleating agent for cloud formation.
Global Cooling Awareness project
“John L. Casey, SSRC President says, “The SSRC possesses the capability to conduct planning and research on how best to prepare individuals, businesses, and governments at all levels for the next climate change to a period of long lasting and potentially dangerous colder weather.”
Fellow scientists, unconnected with SSRC, at Principia Scientific International (PSI) share Casey’s concerns. PSI’s own independent research supports the analysis that our planet appears to be entering a prolonged cooling phase not seen since the Little Ice Age (LIA), a climatically harsh era that saw untold famine and war during the 17th and 18th Centuries.”
http://www.principia-scientific.org/the-global-cooling-awareness-project-gcap.html
Michael Mann is a great scientist because he gets a lot of grant money, or so said the Penn State review after climategate. Mann’s ability to raise grant money is based on data analysis expertise that tells the funding agency powers that be exactly what they want to hear. With academic institutions having more voracious capital needs than the American Healthcare system, he is the best kind of scientist and administrator can ask for.
There are squirrels on the PSU campus that have done more productive work in the past 10 years than Mr. Mann has. Plus they often make you smile. Squirrels 1, Mann 0. That’s a real hockey score.
Global Warming has already passed a dangerous threshold, and it’s called public incredulity.
Would be interresting if someone could run the code backwards to see what temperature you should have had in 1980.
Mann has surprisingly shown both the code and assumptions.
Hear hear. RUN — IT — BACK-WARDS! RUN — IT — BACK-WARDS!
Being a non-scientist and barely literate (especially in late evenings after several visits from the venerable Mr. Beam), I assume when run backwards the code’s output will perfectly match history. It must, right? That would be the super easy way to “prove” his code.
If the output from Mann’s code matches 1930 – 2013, I will give him the benefit of doubt, cease further visits to Steven Goddard’s blog and thank Ghu for Mann in next Sunday’s communion prayer.
One of you science-y types crank up the metaphorical DeLorean and give it a shot.
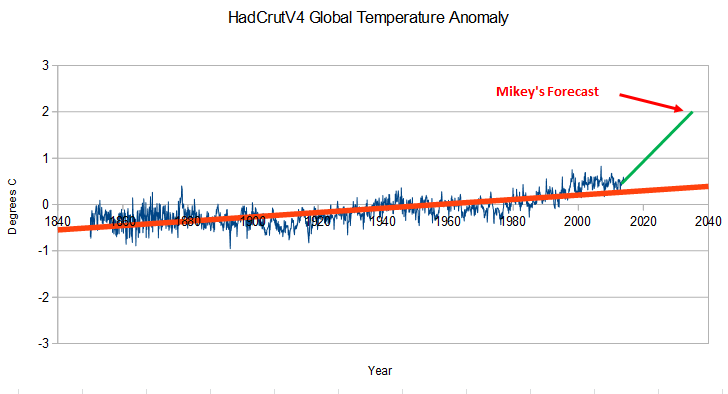
If you look at Mann’ Scientific American article it show the results of the output of his code RUN BACK-WARDS to 1850 (in the graphic at the top of the article). Judge for yourself how well it matches the history.
Svend: “Mann has surprisingly shown both the code and assumptions.”
Now he can claim to be open and transparent …thus mitigating one criticism of his questionable methods. A few more posts of this nature and he will have a working argument to refuse FOI requests.
“Heyzar waitza secaroony, howzacomma deezuh quasiony no-no worken lastof seveen decadal yearsah?! Weezah beesoo hotsah NOWZA, itsa saysza?!”
http://logankrum.files.wordpress.com/2012/06/stupid-jar-jar.jpg
I need a little primer on which data sets have been “adjusted” and which have not. I believe that the HadCrutV4 shown by Steven in this post has already been “adjusted”, but I’m not sure.
“We haven’t been able to get it right before, so here’s another scary scenario, which you can calculate all by yourself; surely that will convince you now!”
Just when you thought Mann could not lose the plot by any further degree…
http://www.youtube.com/watch?v=m3dZl3yfGpc
Haha!
Steve, Prof. Mann’s graph shows warming from 1850 and so that’s where the y-intercept is placed, not around 1950 as your graph appears to do.
I see your point, but would not have a huge impact as the HadCrut anomaly for the 1850’s is only about -0.3C
Further to the comments directly above. The -0.3C leaves a 1.2C jump required for the next 22 years.
As pointed out in http://sunshinehours.wordpress.com/2014/03/22/what-would-2c-of-warming-by-2036-look-like/ , this has occurred on one occasion before (March 1976 to February 1998). Admittedly this was a ‘cherry pick’ of the data by the “sunshinehours” blogger but it shows that a jump of this magnitude is not totally inconceivable, Time will tell.