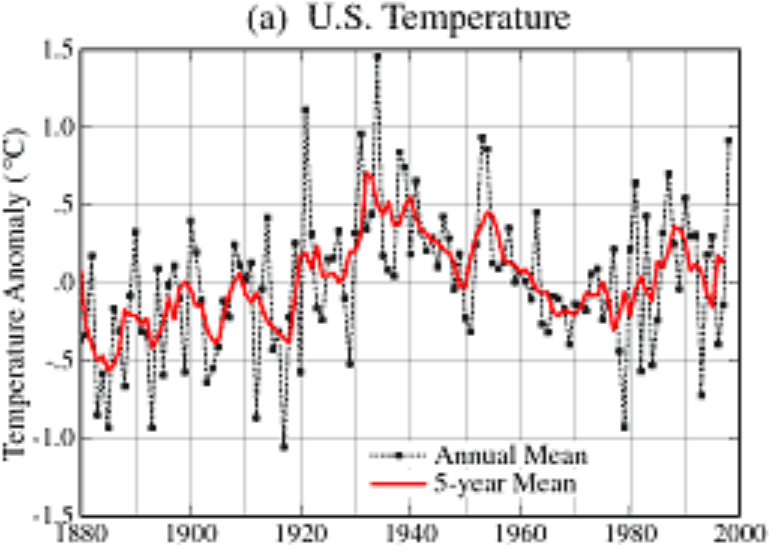
In 1999, Hansen showed that the 1930’s was much hotter in the US than the 1990’s
By James Hansen, Reto Ruedy, Jay Glascoe and Makiko Sato — August 1999
Empirical evidence does not lend much support to the notion that climate is headed precipitately toward more extreme heat and drought. The drought of 1999 covered a smaller area than the 1988 drought, when the Mississippi almost dried up. And 1988 was a temporary inconvenience as compared with repeated droughts during the 1930s “Dust Bowl” that caused an exodus from the prairies, as chronicled in Steinbeck’s Grapes of Wrath.
in the U.S. there has been little temperature change in the past 50 years, the time of rapidly increasing greenhouse gases — in fact, there was a slight cooling throughout much of the country (Figure 2)
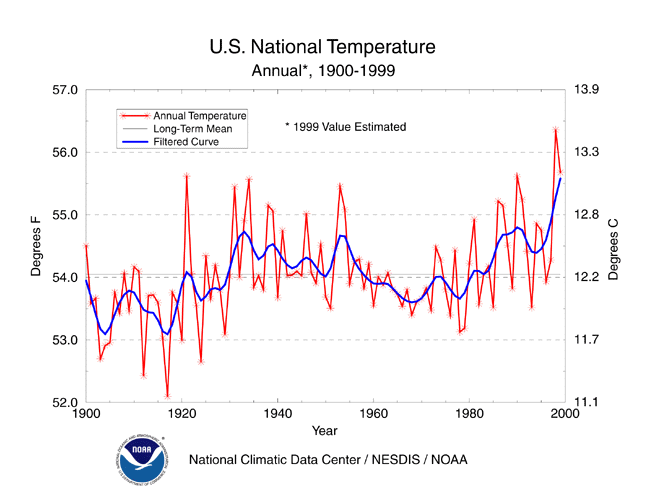
That same year, NOAA published this graph showing the 1990’s as much hotter than the 1930’s.
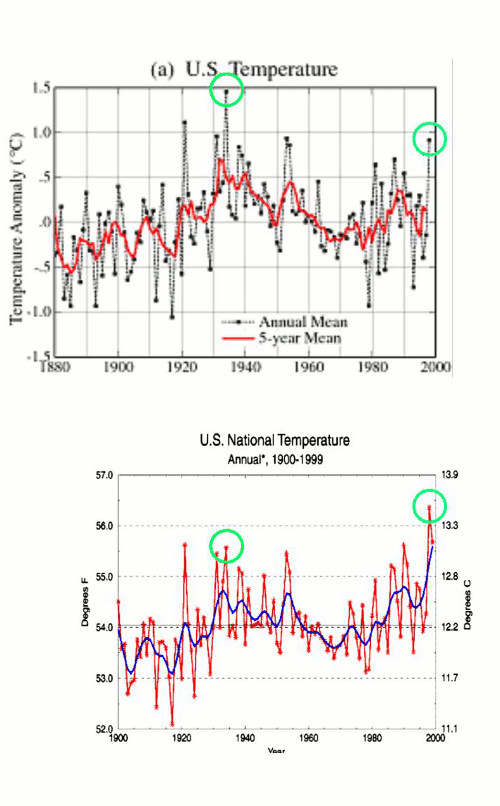
The animation below shows how NOAA massively cooled the 1930’s, and massively heated the 1990’s. This tampering is one of the cornerstones of the global warming fraud story.
The graph below shows NASA in black/green and NOAA in red/blue, normalized to 1996-1998. NOAA massively cooled the past, with 1934 dropping by a full degree C relative to the late 1990’s.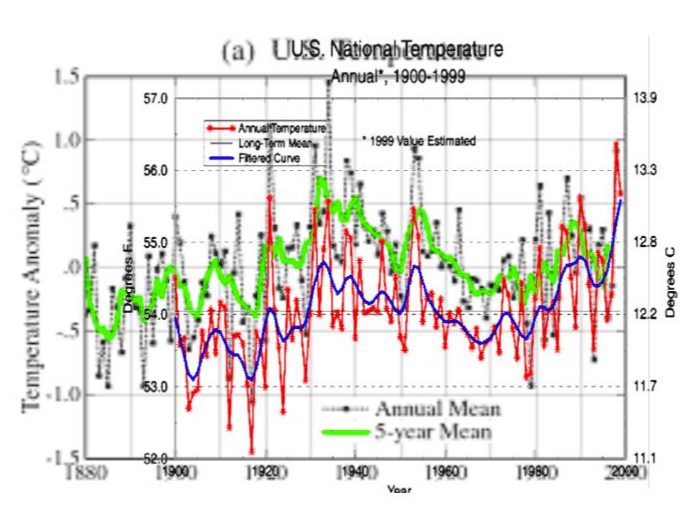
Dave Burton sent this E-mail exchange discussing it
Re: CSRRT Enquiry // Burton // US Surface Temperature (USHCN)

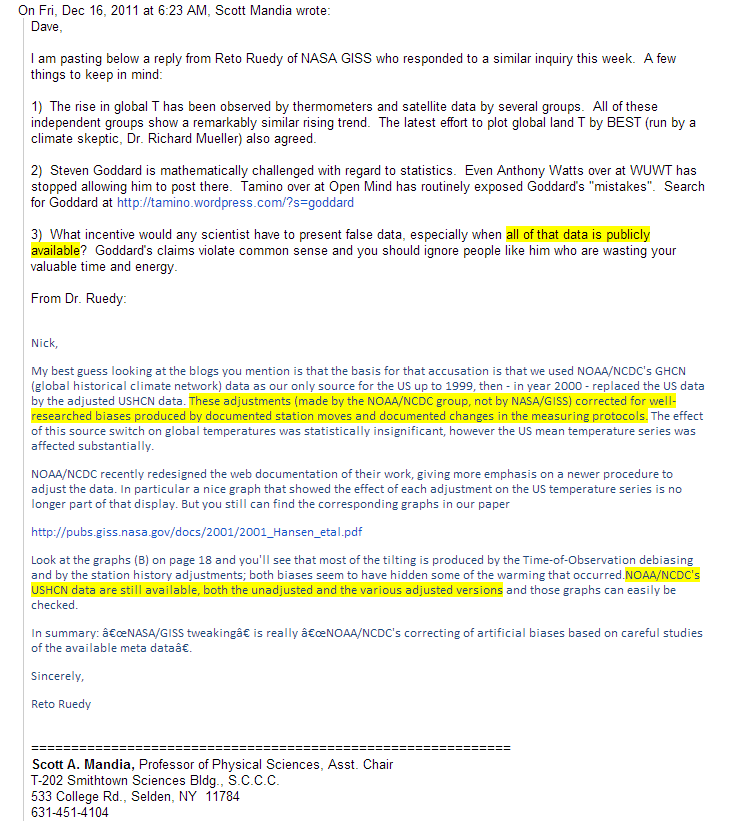

Wow! Wonderful find, Steve!!
This is the first proof I’ve seen that Dr. Reto Ruedy was correct in 2011 when he wrote to someone using the name Nick Schor that, “These adjustments [were] made by the NOAA/NCDC group, not by NASA/GISS…”
I just found this choice nugget from Weather Underground’s ‘Today in Metro Denver weather history’: “in 1887… the longest snow-free period on record… 232 days… began.”
Burton’s link is a goldmine.
Dave, what does your NC sea level group say about the future? It would be very interesting to read a sensible take on it (haven’t seen one yet).
I am deeply impressed by Mr. Burton’s patience and good manners. Note this information he received concerning the USHCN:
“Data sets do change over time, particularly when one station closes and the creators have to select a different nearby station to use instead. Also, the tradition at NCDC and indeed most homogeneity adjusted data sets around the world, is to adjust early data to make them homogeneous with current observing practices, location and instrumentation. So if a station moves in 2005 to a new location that is 0.2 C colder (or warmer) than it was in 2004, then the data set creators would adjust that station’s data in the 1930s (and all other data pre-2005) to be 0.2C colder (or warmer) as well.”
First, if a station is moved to a location that differs strongly from its earlier location is is not a “station move” it is a “station replacement”. Secondly, if varying locations within a grid cell differ that strongly, isn’t that an indication that grid cell size is too large (in which case, why ignore data from so many locations)? Thirdly, let us assume that a properly sited station starting decades ago gradually becomes a poorly sited station with pronounced UHI effect. The station is “moved” to a grassy site and the new location runs 0.2 degrees lower than the old site. How on earth does that justify changing the data all the way back to the 1930s?! Wasn’t the original site good at least when it was started?
Bah…when “adjustments” are as big as the reported change, something is wrong. At least put on some giant error bars!
Oh man, that’s a money quote right there. Hell, if I move a thermometer from one location on October 31 to a new location on November 1, & there’s a 5° difference, it’s obviously a systematic error that I should adjust for. Because Science®.
Seriously, though, they’re outright claiming that they can detect a 0.2° systematic shift in a single thermometer, that can vary by two orders of magnitude more than that year-to-year, on the basis of a single year of observation with zero overlap. They’re not stupid, they’re lying.
Couldn’t agree more. There is no reason to account for moves at all. I would propose that every station has Lat/Lon, and every day you could do a grid cell average from the nearest n stations (even if they are way outside the grid). The larger n is, the more smoothing you would get. You could simply interpolate from the center of the grid cell to every other station location, and take the point that intersects the gridcell edge. Then area weight by 1/(distance^2). Then area weight each grid cell and average them. With that you could actually make daily nationwide charts you could play as a movie, going back to 1880. Missing stations would be dealt with daily, you just take the data that IS there and don’t “infill” anything. The interpolation would make some distortion, but not much. There isn’t a way to do it without having one error or another, but errors tend to cancel (outside climatology, of course).
As UHI effects heat up the thermometers, they have adjust upwards by another degree to compensate.
You hit the nail on the head, there. It also begs the question as to whether changes in elevation, proximity to coastline and geological features are taken into account.
As has been shown constantly, climates can vary a significant amount even within short distances. The only way to be completely sure is to use data only from stations that haven’t been “moved” or “replaced”.
I love the bit about you being ‘intellectually challenged’. I checked the Open Mind blog and found them ridiculing you about arctic ice levels, and sure enough their charts start at 1979.
It would appear the “Models” are simply mildly exponential functions based on CO2 as the independent variable (which is said to be rising in a relatively linear manner). They include variables (real and imagined) which operate in short intervals to fit the line to observed temps.
Then the 1930s presented an inconvenient truth that had to be disappeared. All they had to do was dream up a few reasons to falsify the data to fit the Models.
So NCDC in the late 90’s? Who would that be?
The key to ending this whole scam is simply taking control of a few institutions and conducting a full audit of their “adjustments”.
A great idea, except that the institutions have been very open about any such people
being persona non grata, so the chances of any such audit even being done in a clandestine manner by any person connected to the institutions at all becomes even more remote.
Apparently, the US is “unique”:
> On the USHCN adjustments it is important to
> distinguish the TOB (Time of Observation Bias)
> adjustments from the homogeneity adjustments. TOB
> causes most of the differences, but TOB is unique
> to the US. Elsewhere there has never been this
> switch from afternoon to morning reading of Tx
> and Tn. The rest of the world has always done things in the morning.
http://www.ecowho.com/foia.php?file=5034.txt
It is an interesting discussion, when folk can refrain from making it a debate. To me, common sense dictates most of the lapse rate is atmospheric density driven. Near the top of the atmosphere, individual molecules can be very heated, agitated if you will, by high insolation. The individual molecules are hot, but very few would strike a thermometer, so it would record a low T. Deeper in the atmosphere, that same, but reduced insolation, is absorbed by many more molecules, which also more readily establish a local thermodynamic equilibrium via conduction.
(It is always a mistake to consider radiation only) The lower atmosphere addition of more molecules and a longer residence time of energy due to conduction to non GHG molecules, and GHG molecules, means far more molecules, although at a less individual T compared to the upper atmospheric molecules, striking a thermometer causing it to register a higher T.
Oops, looks like I will have to move this to the appropriate post.
Steve;
Gee, are you now suitably enlightened by the dim Mandia?