
Bookmark this.
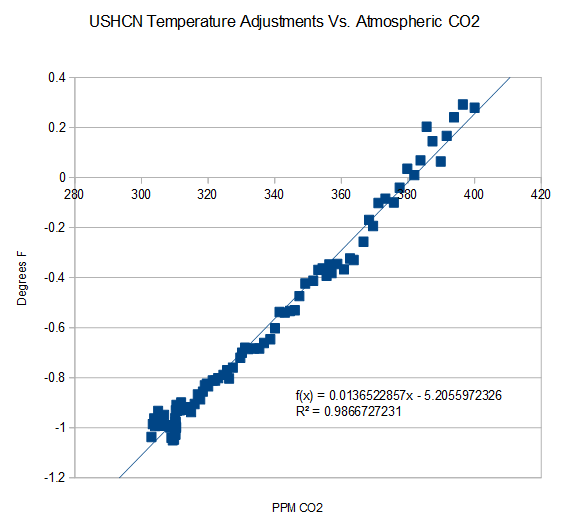
There is only one piece of US climate data which correlates with CO2 – the amount of data tampering NCDC is applying to US temperature.
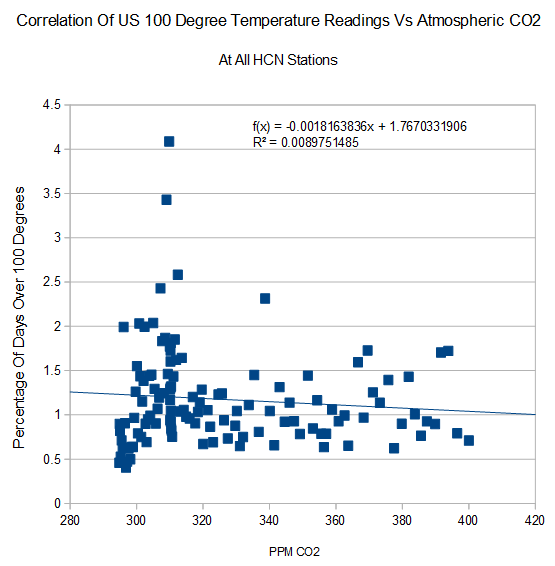
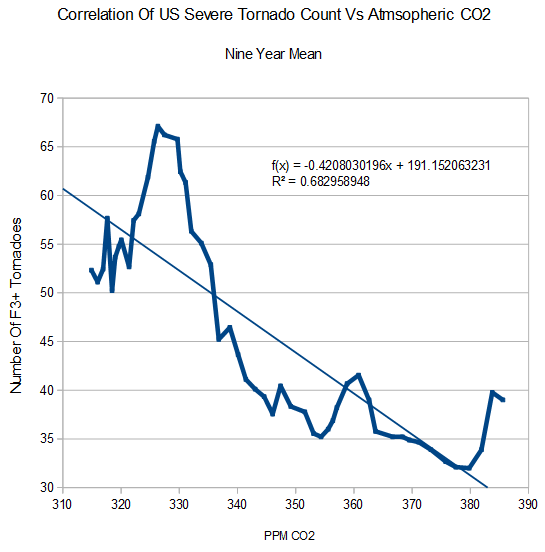
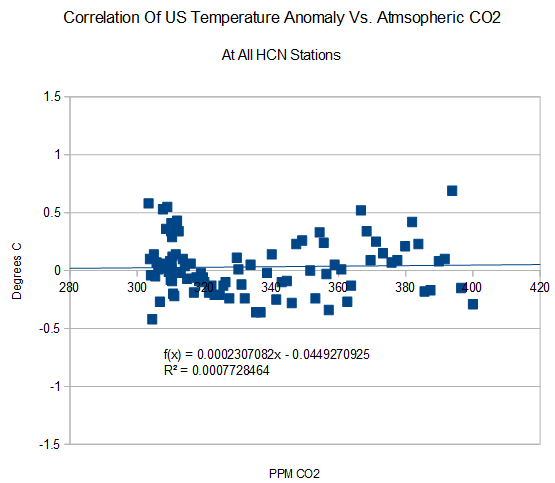
All of the other relevant metrics show either no correlation, or negative correlation vs. CO2. The whole thing is a 100% scam – from top to bottom.
Hot days show no correlation vs. CO2
Severe tornadoes have declined as CO2 has increased
Measured (untampered) US temperatures show no correlation with CO2
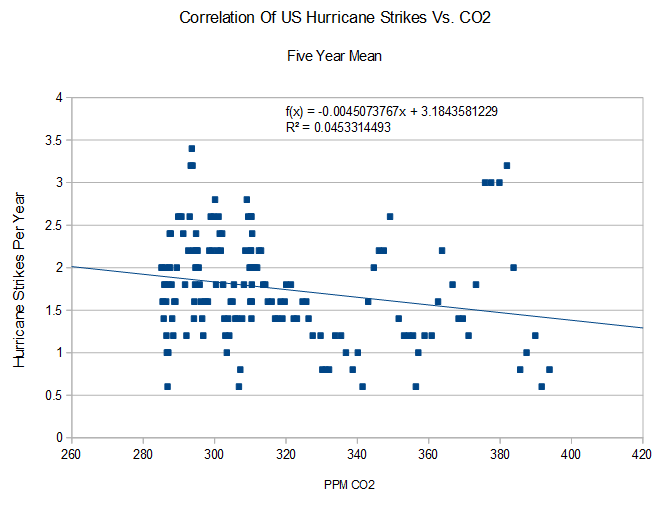
US hurricane strikes have declined as CO2 has increased
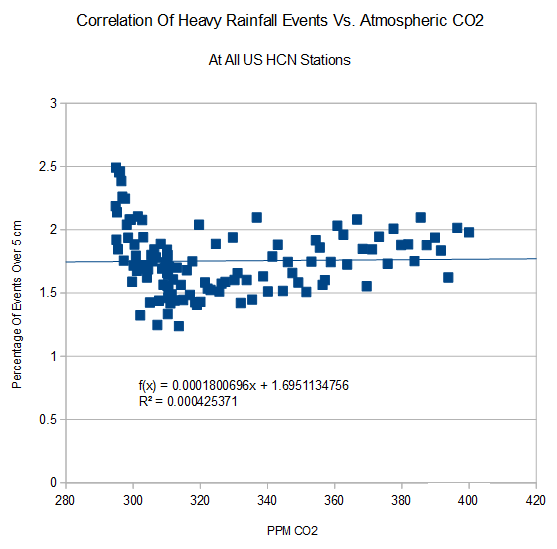
US heavy rainfall events show no correlation with CO2
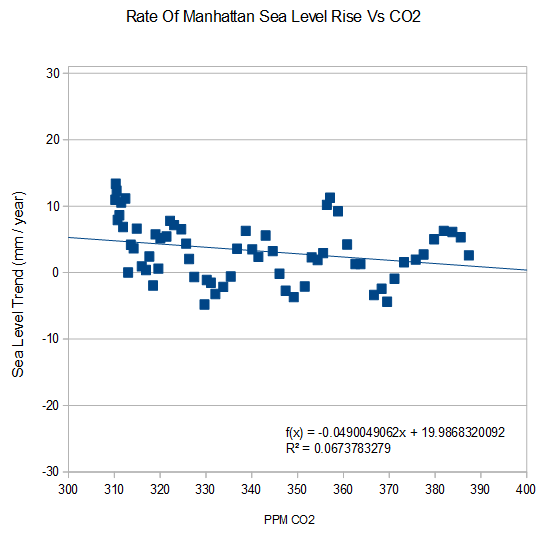
East Coast sea level rise shows no correlation with CO2

But, since correlation is not causation, it follows that lack of correlation must be!
/sarc
“Environmental scientists want to introduce a new system to prove that adverse weather events are directly linked to climate change to counter global warming sceptics.”
http://www.dailymail.co.uk/news/article-2780587/Scientists-fast-track-evidence-linking-extreme-weather-climate-change-sign-panic-losing-propaganda-battle-sceptics.html
Scientists want to be able to provide proof of whether an event was caused by climate change within three day rather than the current system which can take up to a year.
“Dr Otto told The Independent there were many cases where scientists have proved that events have either been triggered or exacerbated by climate change.
She said last year’s heatwave in Australia and record flooding in Britain earlier this year.”
The sentence ends rather abruptly, I presume it was going on to say there was proof that those events were “triggered or exacerbated by climate change”, but I don’t think they have.
Bookmarked!!!
Same here
This illustrates how much science has advanced in the last sixty-eight years.
In 1946, the internal composition of the Sun was abruptly changed without any data, debate or discussion from:
_ a.) Mostly iron (Fe) in 1945 to
_ b.) Mostly hydrogen (H) in 1946
In 2014, one piece of US climate data clearly correlates with CO2.
That’s more than 100% improvement. Congratulations !
To further illustrate the power of consensus science and standard models, . .
1. After Fred Hoyle’s standard solar model of hydrogen-filled stars was unanoymously adopted in 1946 with no dissection or debate . . .
2. Debris of exploded stars revealed
iron-rich (Fe) debris surrounding a central neutron star . . .
3. Obviously made by the explosion because . . .
4. Postnormal scientists already knew neutron stars and iron could not be present in the interior of the star before it exploded.
To even further illustrate the power of consensus science at NASA, . . .
when an impulsive solar flare discharged material from the interior of the Sun directly at the NASA’s Wind spacecraft, . . .
each successively heavier group of elements was observer to be successively enriched by successively greater factors of >10, >100 and >1,0000 . . .
obviously caused by a weird acceleration mechanism since all good NASA scientists knew already that the interior of the Sun is 91% H, just like the top of the Sun’s atmosphere.
[This power of consensus NASA thinking is so powerful nobody will believe it unless I find the link to post below]
http://epact2.gsfc.nasa.gov/don/00HiZ.pdf
Reblogged this on Richard T. Fowler and commented:
Steven, thanks in no small part to your tireless efforts, I think we are finally starting to detect an ever-so-slight change in the direction of the Titanic.
Is it enough, and is it soon enough?? We’ll stay tuned.
Based on the record lows for fire, hurricane’s, tornado’s etc. Could one, not say Increased Co2 is helping the Planet and lowering deaths and damage from Bad Weather. Time to push the Good that has happened. Increased Co2, saves hundreds?? A better provable result than theirs.
That is just as speculative as the opposite hypothesis, at this point.
Fire can be lessened by higher humidity and rainfall levels, which are usually (though not always) associated with higher temperatures. However, fire frequency and intensity can also be significantly lessened by falling mean temperatures.
Hurricanes and tornados are increased by the development of a greater temperature differential north-to-south in a given area, which is generally (though not always) associated with colder temps. However, hurricanes are also reduced by lower sea surface temps, in the areas of their formation and buildup, which are also generally (though not always) associated which declining global mean air temperature. So in the case of hurricanes particularly, the relationship between them and temperature is very, very complex. And there are major cycles of hurricane frequency which could have as much, or more, to do with changes in oceanic circulation patterns as they can with air temperature.
RTF
Oh, also fires are influenced by the frequency and intensity of relatively dry winds originating from higher latitudes, from areas of cold oceanic surface currents, or from orographic zones. And these things, in turn, tend to be exacerbated by falling mean temperatures. So there is a zone of GMT in which falling GMT may actually increase fire intensity, and then if the GMT continues to fall, will began to cause a reduction in fire intensity. Again, a very complex calculus, as with hurricanes.
RTF
And finally there is the fact that if there is any warming trend over the last 40-50 years (which I personally don’t believe there is), it would be vastly more controlled by the Sun that it would by CO2 or any other component of the atmosphere.
Richard, do not forget Higher rainfall also means more growth and if that is followed by a drought and high winds you have a real mess on your hands.
It is the reason for controlled burning. Something practiced here on the N. American continent for centuries prior to the white man’s arrival.
http://www.wildlandfire.com/docs/biblio_indianfire.htm
Yes, it does!
Also we need not forget that higher CO2 is apparently greening the planet, which will have a cooling effect. I just worked with a contractor which is installing a greenhouse CO2 delivery system. It is amazing how much healthier plants in the greenhouse are with the added CO2, which the EPA in some states are labeling as pollution.
Now it is time to copy those charts AND FAX (not e-mail or snail mail) them to your reps. A face to face of someone campaigning for office is even better.
I am not sure if it is still true but when we were fighting NAIS we found there is a law on the books that faxes must be saved while the other methods get round filed.
Well done, Tony. I’ve downloaded them all and will make good use of them.
Thanks,
Don
Sorry I didn’t get back to you this week Don. I’ll send over some more material later.
Hey, I wonder if the folks at Skeptical Science can add this to their list of 97 arguments they pretend to debunk.
Better yet have Jo Nova add it to her Skeptics Handbook.
I think the curve (line) showing the correlation between “adjustments” and CO2 is the most damning evidence of this scam ever.
When you add in the documented data tampering, the massive ‘estimated’ fraud, and other evidence I am floored that the guardians of truth (the LSM) are not just silent but abetting this travesty!
The fact the MSM is not picking this up and running with it (Pullet Surprise!) tells you just how bad the Propaganda Machine is.
Pullet Surprise
😆
Bookmarked and have copied the whole page to a document (with web address) for later offline reference.
Thanks, Steven, for discovering the 2014 Standard Climate Model is as crooked as the 1946 Standard Solar & Nuclear Models
Why Fraudulent Science in 1946 ? Joseph Stalin Won WWII in 1945 !
George Orwell saw this coming in 1946 and warned us a new tyrannical government was coming.
Here is a brief summary of the little-known events in Aug-Sept 1945 – based on my research career and those of Sir Fred Hoyle (1915-2001) and Dr. Paul Kazou Kuroda (1917-2001) – that gave Joseph Stalin the power to change the course of world history:
1. Unreported CHAOS and FEAR of nuclear annihilation in Aug-Sept 1945,
https://dl.dropboxusercontent.com/u/10640850/CHAOS_and_FEAR_August_1945.pdf
2. Preceded formation of the United Nations on 24 Oct 1945.
3. Sir Fred Hoyle changed the internal composition of the Sun from Fe to H and George Orwell started writing his warning to the public in 1946: “Nineteen Eighty-Four”.
http://www.theguardian.com/books/2009/may/10/1984-george-orwell
4. And now we see that “The second most terrifying thing about George Orwell’s “1984” is the supposition that it is possible to destroy humanity without destroying humankind.”
http://www.crisismagazine.com/2013/orwells-1984-are-we-there-yet
5. Or as Edmund Burke concluded, “The only thing necessary for the triumph of evil is for good men to do nothing.”
I love how you just pick all these graphs that support your argument, without bothering to explain them or anything because it’s so obvious
Read the rest of the website.
The top graph for example was a recent discovery of Steves. He plotted the Mauna Loa CO2 numbers against the USHCN adjustments made by NOAA for each year.
If R= there is no correlation and the data sets are completely unrelated.
If R=1 there is a perfect correlation.
0.98667 is a darn near perfect correlation. This means NOAA is committing intentional FRAUD because no way are you going to get over 50 data points to fall on a straight line like that without fudging. ( direct measurements of CO2 on Mauna Loa started in 1958)
USHCN = United Stated Historic Climate Network. With luck you already know what NOAA is.
Thanks, Gail, for clearly saying:
This means NOAA is committing intentional FRAUD because no way are you going to get over 50 data points to fall on a straight line like that without fudging.
In case anyone doubts your choice of words, NASA has also fudged by ignoring natural correlations that did not fit NASA dogma:
An even higher value of R for the correlation of primordial helium (He) with excess Xe-136 in the Allende meteorite was ignored in 1975 to falsely claim superheavy element fission made excess Xe-136, rather than local element synthesis as we reported in 1972.
The same correlation correctly predicted excess Xe-136 in Jupiter’s He-rich atmosphere.
When the Galileo probe found excess Xe-136 in Jupiter in 1995, NASA hid the data until forced to release it while being filmed by CSPAN News in 1998.
This CSPAN news report shows NASA releasing 1995 data in 1998 that revealed excess Xe-136 in the He-rich atmosphere of Jupiter:
http://m.youtube.com/watch?v=m3VIFmZpFco
Since atmospheric CO2 levels have been monotonically increasing over the last 80 to 100 years (which I think is approximately the time period you used), they must be positively correlated with everything that has been monotonically increasing over that same time period. The NCDC has been “cooling” the warm 1930s, and “warming” the more recent history, with the effect of increasing the apparent warming in the surface temperature record, so of course you see a positive correlation with CO2. However, CO2 is also positively correlated with many other things that may or may not have anything to do with it, like population (partially causal relationship, with population as the cause and CO2 as the effect), crop yields (partially causal relationship, with CO2 as the cause and crop yields as the effect), and rates of illegitimate birth (incidental correlation).
So it is your position that the “adjusted” temperatures during that time period form a linear or virtually linear series?
Is it also your position that the correlation of the government’s “adjustments” with CO2 will be the same correlation value regardless of the slope of that “linear” equation of temperature “adjustments”?
And is it also your position that any random set of “adjustments” with the same overall trend will correlate just as well with CO2?
RTF
If the correlation was R =0.5 to 0.7 you would have a point. However the correlation is R=0.99
AND we know:
“From 1981 to 2013, he [Jim Hansen] was the head of the NASA Goddard Institute for Space Studies in New York City, a part of the Goddard Space Flight Center in Greenbelt, Maryland.” (WIKI) Therefore James Hansen was in a perfect position to manipulate the data.
We also know that James Hansen colluded with Senator Tim Wirth to pull dirty tricks to sway Congress into believing CAGW and later ratifying the UN Fame Work on Climate Change. Thes indicates Hansen is not above manipulate the data for political purposes.
We also know that Senator Tim Wirth was rewarded with position of head of Ted Turner’s UN Foundation and that Ted Turner said:
“A total population of 250-300 million people, a 95% decline from present levels, would be ideal.”
While Tim Wirth said “We’ve got to ride this global warming issue. Even if the theory of global warming is wrong, we will be doing the right thing in terms of economic and environmental policy.” from his Dossier
In this case I would say the evidence certainly points heavily towards the R=0.99 being the result of politics not science.
Thanks, Gail, for speaking the truth.
Steven, can you post links to the data you’ve used for these graphs? Love these, thanks for putting them together. Would like to use them and be able to point to the original data when challenged.
It seems very bleak now, . . .
but the Creator, Destroyer and Sustainer of every atom, life and world in the solar system will – in its own time – sweap away the force of darkness that engulfed the globe in 1945:
http://omanuel.wordpress.com/about/#comment-8355
Glad to see this finally being put out by a more well known source, after being asked about two years ago on this site, at https://stevengoddard.wordpress.com/2012/10/04/ushcn-resolves-their-temperature-problem/#comment-140724 . Hopefully this being here will open more minds to understanding the fraud.