
Alarmists are in huge trouble in the Arctic.
Cold water in the North Atlantic is causing a large increase in ice in the Barents and Greenland Seas, and cold water in the Bering Sea will later cause a large increase in the other direction too.
I suspect that even the “breathtakingly ignorant” Mark Serreze knows where this is headed.

Will a return to normal/above normal Arctic ice area finally collapse the fraud? I think it’s possible.
Of course not, it would merely produce even greater fraud.
Yep, they will come out and say “see, we told you that global WARMING will lead to more ice and snow” .. “now give us your money so we can stop it”
goal posts can be moved.
So can the shape of the ball, the dimensions of the playing field and the rules of the game.
I have racked my brain endlessly trying to think of what excuse they will come up with IF Arctic sea ice extent starts trending up?
This is why I want them to spell out in no uncertain terms what we could expect if we were to go into a cooling period.
I fully expect the scam to take at least another 20 years to die, regardless of far above “normal” the Arctic reaches. It’ll take about that long for the public at large to finally be over alarmists proclaiming every “extreme”* weather event (aka “events that have been happening for eons”) being linked to “climate change”. Alarmists are bound to do the same for Arctic sea-ice (they’ve already done it for Antarctica); mark my words.
Apart from the fact that the MSM (e.g. BBC) refuse to talk about it in any way other than a sarcastic manner.
http://www.bbc.co.uk/iplayer/episode/b04n6s63/newsnight-28102014
About 33m in.
Dave – although I wouldn’t like the AGW “theory” to take that long to die, I must say that I agree. It is so deep within many people’s psyche now, like you said it’s going to take at least 20 years. I think what it comes down to is certain people have to get out of power who are pushing it, and that’ll take about a generation. The only thing that could quickly change it (in a year) is if suddenly truthful and honest people got into power (in U.S and UN politics & science) and told the truth to the world.
The President of the United States is tweeting forest fires are running out of control, The lie just gets bigger.
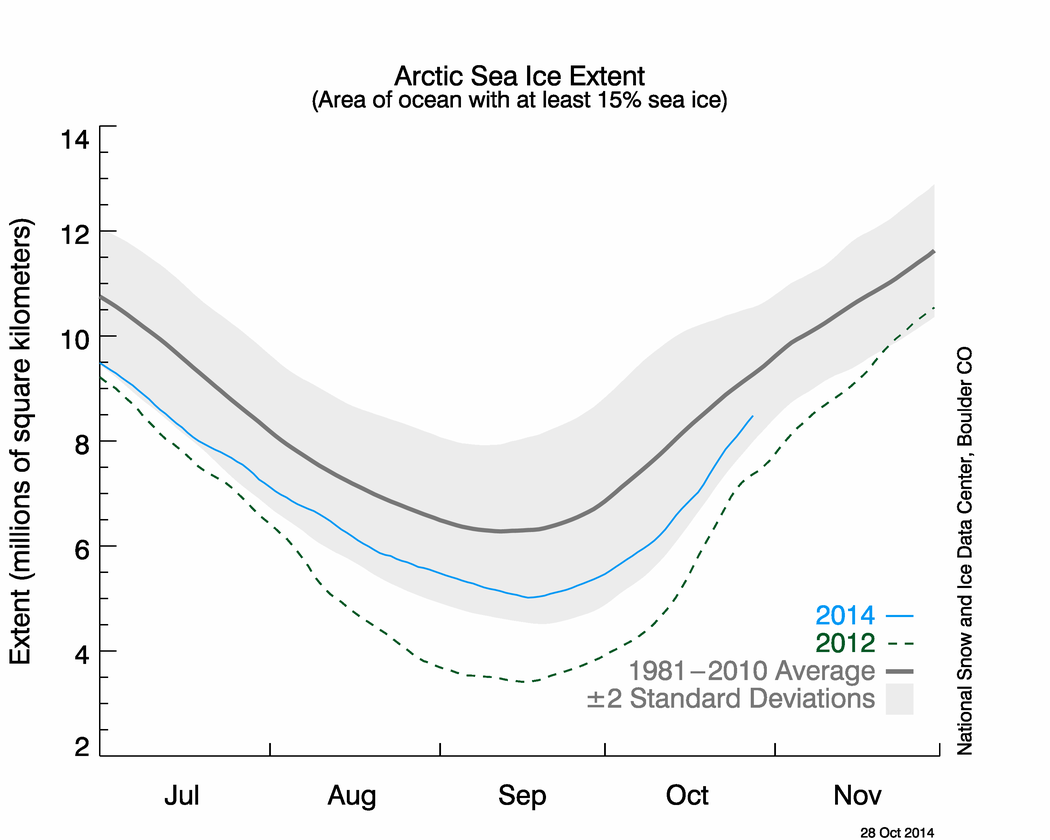
That blue line could shoot of the page and it won’t change a thing. They will just publish some nonsense about how some years will see a large extent of sea ice but global warming is still continuing.
No, they will claim, as they are already doing, that HOT causes more ice and snow! … but at the same time, it is also going to melt it all and we will all drown.
All they have to do is point to that red area in southeastern Australia and say, “See, the Missing Heat has been found!” Don’t laugh. You think they can’t fool about 2 billion people with that one?
I suppose even the relatively weak Atlantic hurricane activity this year corroborates the Unisys data.
SG have you checked that the Unisys map is correct? I think they posted somewhere maybe WUWT that there was a problem with the color representations. I’m a bit skeptical that the whole NH sea could change (cool) so fast, although I certainly wish it would LOL (live in South America so no problems LOL)
There is nothing wrong with the Unisys map. Urban legend.
I do consider that , yet other SST charts do not reflect the degree of cooling. http://www.climate4you.com/images/NCDC%20SST%20GlobalMonthlyTempSince1979%20With37monthRunningAverage.gif HAD does show a recent drop, but not so much..http://www.climate4you.com/images/HadSST3%20GlobalMonthlyTempSince1979%20With37monthRunningAverage.gif. The NOAA chart shows a relatively much warmer NH, and a relatively cooler or more neutral SH. http://www.climate4you.com/images/HadSST3%20GlobalMonthlyTempSince1979%20With37monthRunningAverage.gif
Such a change in SST as UNISYS shows should be reflected in the next RSS and UAH charts, one would think, so I guess we will see.
Sorry link to anomaly map updated to current…http://www.ospo.noaa.gov/data/sst/anomaly/2014/anomnight.10.30.2014.gif
Similar “phenomenon” happened with the UNISYS map during the Polar vortex of last December, with NH sst’s dropping very fast and “pushing” the warmer temps southward.
In a matter of few days, the temperatures of the SH increased and kind of “reversed” with the anomalies of the NH few weeks earlier.
The difference of what happened then and now is that the colder anomalies of N. Atlantic are now much more pronounced, but the amplitude and speed of decrease of the anomalies of the N. Pacific were similar.
This is what Ryan Maue has for the North Pacific :
https://pbs.twimg.com/media/B1LGIOPCEAIo32a.png
https://pbs.twimg.com/media/B1LGIONCQAE_CvR.png
Top map is for the 15th October, bottom is for the 28th.
BTW I actually would not be surprised that it is true because the SH sea around Antarctica has shown this pattern for some time as Antarctica increases the sea is COOLING not warming.
Day 301: After being offline for awhile, and missing two days, MASIE now shows the last week’s daily reports. In those 7 days, MASIE extent grew by 800,000 Km2 ito 9.00 M Km2 or 58% of last March max.
All regions with ice remaining are recovering strongly, especially Canadian Archipelago, Beaufort, Kara and Laptev Seas
Regions exceeding the NH ice extent average:
Central Arctic has grown back to 100% of the max last March
Canadian Archipelago is now at 95%
Laptev has grown to 97%
Beaufort Sea is up to 89%,
Kara has grown to 85%,
East Siberian Sea is at 74%
Chukchi has grown to 53%,
Greenland Sea is at to 52%
Just noticed under the title of the graph “(Area of ocean with at least 15% sea ice)”.
The 1990 IPCC FAR Fig.7-20 graph that you often cite says this in the text: “Sea-ice is defined to be present when its concentration exceeds 10% (Ropelewski, 1983).”
So the levels shown in the present graphs, beginning in 1979 are using a different metric, one that will show a lower ice area, because the threshold is at a higher value. I wonder how long it will be before the threshold becomes 20% … then 25% … Gotta keep the scam going ya know.
Wall Street Journal Article up today should be challanged….
The goal posts are on wheels for expediency.
That one made me laugh out loud! I need a cartoon of this!
Could this be the beginning of a Bond event. The last one was 1478 years ago and it is a 1470 year cycle plus or minus 500 years.
What always confuses me is how the sea surface temperature of an area covered by ice can be above normal.
It’s the anomaly, mate. That’s the bit that is +/- ‘normal’. If the graph simply showed outright temps it wouldn’t mean much in its own right. By showing temps as an anomaly against ‘normal’ (established over a given period of time) it allows context. In this case the North Atlantic is showing as approx’ 2C below ‘normal’. Brrrr.
The melting or freezing of ice is an isothermal process, mate. Where ice covers the surface there can be no difference from “normal”. Ice freezes at the same temperature today as it did 10, 20, 30 or 100 years ago; therefore, if it’s covered with ice, and it’s normally covered with ice, the sea surface temperature is normal. The concentration of salt in the surface water will only vary the freezing temp by fractions of a degree. A 1 degree anomaly in an ice covered area is a clear signal that the plot has significant errors..
Because the ‘normal’ was defined with a temperature that ignored the fact that sea water freezes at a temperature that depends on salinity, and the RTG recognizes the connection between salinity and freezing point. http://polar.ncep.noaa.gov/sst/rtg_high_res/description.shtml
There it is, thanks.
It’s a non-salinity adjusted value (apple) compared to a salinity adjusted value (orange). Now that’s ClimateScience!.
If you plug in the salinity psu range from the hycom map, 26 to 36 psu, into the equation referenced, the temperature range is -1.405 to -1.962, respectively. That’s a maximum range of ~0.56. So a temperature anomaly for a typical ice covered surface is within +/- 0.3 of the average psu level. A map anomaly for any ice covered surface that is greater than 0.6 is therefore clearly erroneous and anything more than 0.25 is very suspicious.
Too bad you don’t read what your sources have to say about their data — http://weather.unisys.com/news/?p=391
They’re working from data at http://polar.ncep.noaa.gov/sst/rtg_high_res/ and this shows no such drastic cold state for the northern hemisphere.
http://polar.ncep.noaa.gov/sst/rtg_high_res/color_newdisp_anomaly_global_lat_lon_ophi0.png for the current day’s SST anomalies.
I suspect that even the “breathtakingly ignorant” would realize what sources have to say about their data has been read.
Don’t judge people by your own very low standards.
Sure it’s been read, by me. Not, apparently, by you or ‘goddard’, since ‘goddard’ is claiming that Unisys is showing a massive cooling (posted another article today) while Unisys says that they don’t. Instead it’s a color bar problem. Correct figures are at the site they, and I, pointed you both to.
Yes, my standards are low. You slither under them nonetheless.
Maybe you should ask Unisys if there is a problem with this particular graphic.
I had already checked at Unisys, and you are spouting carp (anagram), but then I expected nothing more from an idiot.
arctic ice growth over the last 8 days.
https://www.youtube.com/watch?v=HiQ2sff-N0k
I’m purchasing contracts in heating oil. That’s just incredible.
This is pretty much normal. As the sun gets lower the ice grows quickly.
How many years until a frozen New York Harbor. I believe that last time that happened was during the Revolution. You could walk from Staten Island to Manhattan.
The Climate Change group has flipped like the PDO, they now say the heat causes the cold. Therefore, the more ice that builds up the more correct their claims. Their change theories are immune to death and are similar to the theories of identifying a witch during the Salem Witch trials. If you toss them in the ocean, they will not drown, because they are witches. If they drown, they drowned, because they are witches. Therefore, if it’s warmer it’s due to the heat, if it’s colder, it’s due to the heat-how convenient!
And if you don’t drown them they will turn you into a newt!!
Agreed. Even if/when they can walk across the Potomac in winter they’ll still be at it, one way or another. If cold becomes undeniable then perhaps a theory that rapid CO2 increase triggers ice ages will be made popular. As long as those who want this can pay the agitators, media, politicos, and foundations we’ll have our political “science” to justify their further control.
From the Canadian Ice Service, they have their charts updated.
Western zone running below normal but ahead of last year. Ice is forming quickly, though.
http://ice-glaces.ec.gc.ca/prods/CVCSWCTWA/20141027180000_CVCSWCTWA_0007940435.gif
Eastern zone is running normal. Ice formed quickly in the last week.
http://ice-glaces.ec.gc.ca/prods/CVCSWCTEA/20141027180000_CVCSWCTEA_0007940436.gif
Hudson zone is running normal, too.
http://ice-glaces.ec.gc.ca/prods/CVCSWCTHB/20141027180000_CVCSWCTHB_0007940329.gif
Brian, that 10/29 bar is a one week jump….I don’t think I’ve ever seen that big of jump in just one week
I wonder how this guy is feeling,
http://www.sierraclub.ca/en/AdultDiscussionPlease
“By Paul Beckwith
On March 23, 2013, I made the following prediction:
“For the record—I do not think that any sea ice will survive this summer. An event unprecedented in human history is today, this very moment, transpiring in the Arctic Ocean”
We haven’t heard from him for some time.
I wonder if he got his Ph.D. based on that research?
The Icelandic volcanic eruption in 2010 caused an extremely cold winter in the UK, this latest volcanic eruption is much larger and could go on indefinitely, it could be a Mount Pinatubo. Expect massive cooling of the Northern Hemisphere.
The next “climate” measurement will be next year’s minimum… everything else will be ignored so don’t bother.
Comical nonsense. The Arctic is warming 3 times faster than the global mean –
http://www.columbia.edu/~mhs119/Temperature/T_moreFigs/global+Arctic.pdf
Warming of the planet as a whole is accelerating –
http://images.sodahead.com/profiles/0/0/2/0/7/6/2/8/5/GEA-141361307138.png
Arctic sea ice is declining at the rate of -3000 cubic kilometres per decade –
http://a.disquscdn.com/uploads/mediaembed/images/1411/795/original.jpg
None of this is going to stop any time soon.
You have no idea what you are talking about
“Arctic sea ice is declining at the rate of -3000 cubic kilometres per decade …”
That’s why it’s about to go back to average levels– after reaching its lowest in 2012– as it was 10 years ago, and that’s also why it’ll probably have even more positive anomalies in 2015.
I believe what you’re saying is called reverse logic, or doublespeak, “declining ice” in reality means “more ice extent”, “more warming at the poles” in fact means “cooler anomalies in both polar basins and increased icecaps”, “more El Ninos” in fact means “less and weaker El Ninos”, “more storms” … etc.
If you want to talk about reality why don’t you say it directly?
That is pretty remarkable ice extents, especially when you factor in the mean or average it is compared to, starts in a period of time when their was an above average ice extent. It will be interesting to see the Nimbus Rescue Project data for a comparison of Arctic sea ice extent.