
Climate experts say that Hudson Bay Polar Bears are doomed by global warming, as ice levels are the 4th highest on record and highest since 1992.
Meanwhile, the Arctic Basin has been covered with clouds and cold air for weeks, and melting has essentially stopped there.
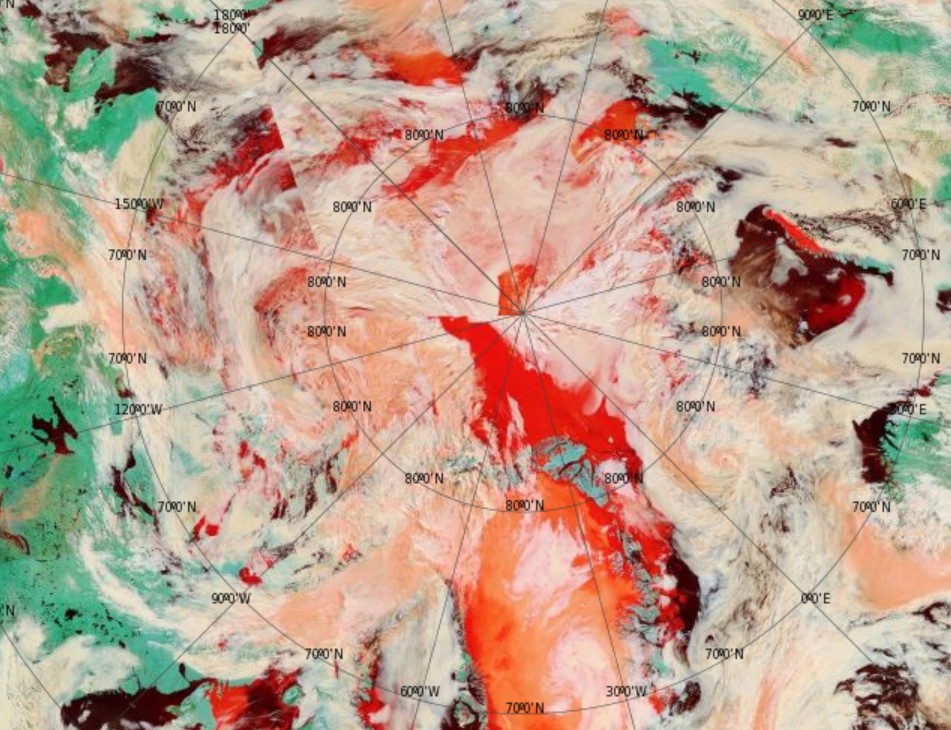
During some years, ice loss accelerates during the second week in August due to warm water melting ice in the Beaufort Sea from the bottom up . This year it is likely to slow down because the water in the region has not been getting warmed by the sun
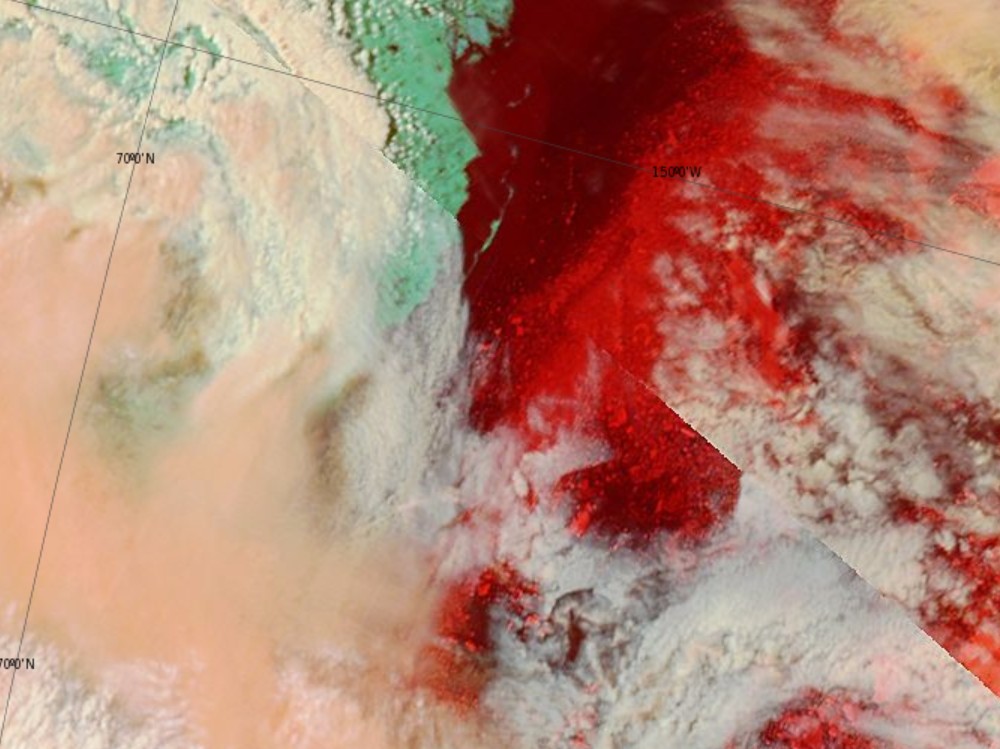
Last year, climate criminals tried to blame Walruses on Alaskan beaches on global warming. This year ice (red below) persists right up to the Alaskan coast
Meanwhile, climate criminals in academia continue to lie about the Arctic, in order to keep their grant money coming in.
But the big news is that there will be a huge increase in the amount of four year old ice in the Arctic in a few weeks.

I am most interested to see how this multi year Ice, proportionally increases the coming Winter maximum…
It has no effect on the winter maximum, which is determined by first year ice
Agree, also the Arctic is geographically limited by land in some regions. Summer minima is therefore more interesting than winter max.
Andy
We all know the Summer Ice cover is more interesting than the Winter max. The premise made relates to multi year Ice having “no effect” on Winter maximum?
First year Ice is the governing factor but I believe multi year shouldn’t be ignored.
Thank you for exposing the governmemt’s climate change lies.
They are the latest version of GOVERNMENT FALSEHOODS TO HIDE TRUTHS REVEALED SEVENTY YEARS AGO IN HIROSHIMA
As reported yesterday in comments on the end of WWII in Japan Times,
http://www.japantimes.co.jp/news/2015/08/05/national/history/japan-times-reported-atomic-bombings-hiroshima-nagasaki/#.VcJm8Nm9Kc3
In 1945, while standing in the ruins of Hiroshima, Kuroda correctly realized “the birth of the world may have been just like this.”
In 1956, Kuroda predicted the natural nuclear reactor that was discovered in the Oklo uranium mine at Oklo in 1972.
In 1960, Kuroda reported decay products from extinct Plutonium-244 in Earth’s atmosphere.
In 1964, Marvin Rowe and Kuroda discovered decay products from extinct Plutonium-244 in the Pasamonte meteorite.
In the 1990s, Kuroda and Myers showed that
_ a.) Physical properties and levels of extinct radioactivity in refractory silicon carbide (SiC) grains of meteorites are like those of refractory fallout grains after a nuclear explosion, and
_ b.) Decay products from Uranium-238 and Plutonium-244 in the Earth, Moon and meteorites indicate our chemical elements were made in a super-nova explosion five billion years (5 Ga) ago, at the birth of the solar system.
For seventy years (1945-2015) these truths about Earth’s heat source and the Creator, Destroyer and Sustainer of atoms in the solar system have been hidden from the public.
https://dl.dropboxusercontent.com/u/10640850/Solar_Energy.pdf
To hide truths revealed by Hiroshima’s destruction, the integrity of sovereign governments and government science were destroyed by uniting nations after WWII, especially astronomy, astrophysics, climatology, cosmology, geology, nuclear, particle, planetary, solar and theoretical physics.
The divine simplicity of our beautiful, bountiful and benevolent universe is now obscured by “97% Consensus Science (UN)Truths“ purchased with public research funds for greedy propaganda artists.
BBC News reported that my research mentor, the late Professor P. K Kuroda, secretly retained a copy of Japan’s successful atomic bomb design from 1945 until 2002:
BBC News, “Atomic plans returned to Japan,” News Front Page, World Edition (3 Aug 2002) http://news.bbc.co.uk/2/hi/asia-pacific/2170881.stm
The cold on Beaufort Sea continues to impress me, particularly because I can’t see exactly where the cold is coming from. We are seeing expanding areas of sub-freezing temperatures over the sea-ice at the very time the Pole theoretically receives more heat from the sun than it loses. It makes me sit back and wonder.
I think one sad thing about some Alarmists is that they miss the wonder. Because they feel they must be know-it-alls, they deprive themselves all the marvel of simply admitting the Creator has more tricks up His sleeve than our small minds can grasp.
Every summer has something fresh and new to teach, if your mind is open, but you can’t learn anything new if you think you have it all figured out.
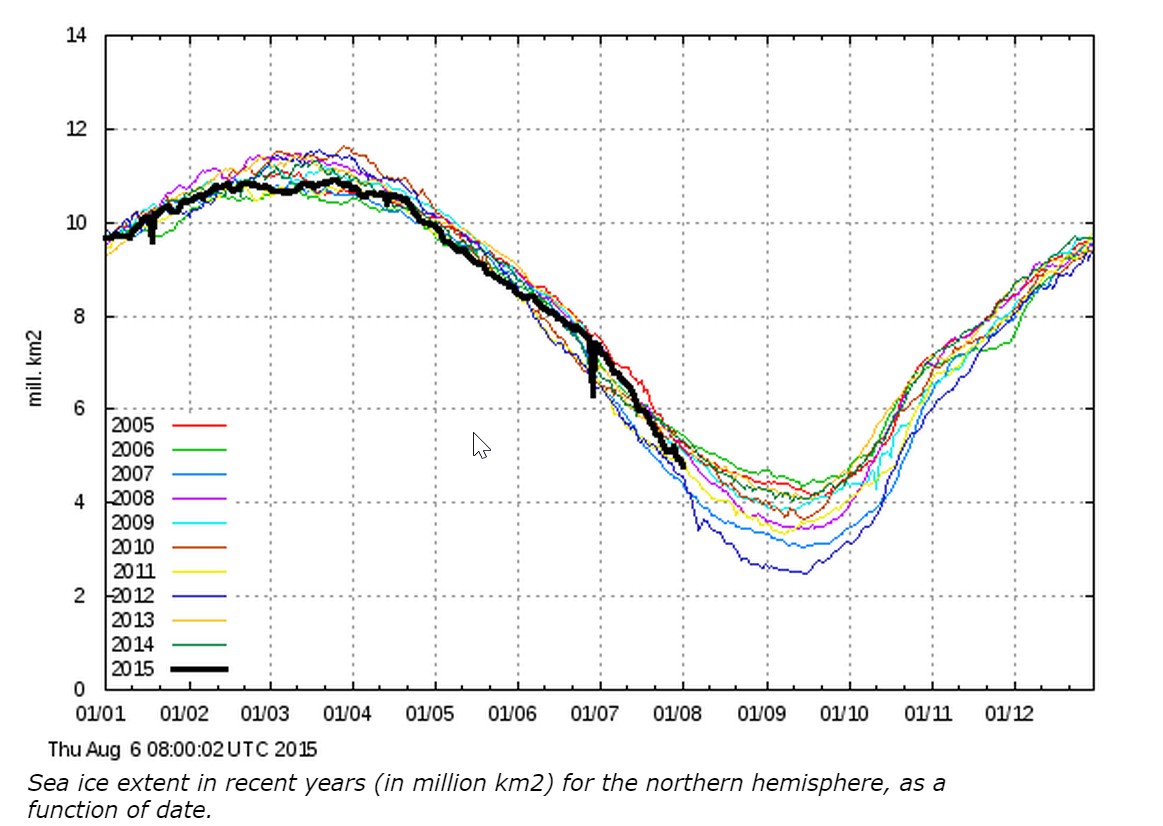
In my imagination there must be great confusion in Alarmist camps, any time the ice-extent has an uptick like this morning’s. I imagine wailing and gnashing of teeth and rending of garments: “How can this be happening?”
https://sunriseswansong.files.wordpress.com/2015/08/dmi2-0806-icecover_current_new.png
Of course, some never take the time to looks at such graphs, or pictures from the cameras floating up on the sea-ice that show the ice hasn’t been melting, and snow has been falling.
https://sunriseswansong.wordpress.com/2015/08/03/arctic-sea-ice-not-all-its-cracked-up-to-be/
The melt will continue in the Beaufort sea as temps are above zero, no need for warm sea temps. The disrupted nature of the ice there will lead to more melting though as the sunlight that is warms the water, quoting NSIDC
http://nsidc.org/arcticseaicenews/
” Ice age data from the beginning of July show a tongue of old multiyear ice extending from the southern Beaufort Sea towards Alaska into the Chukchi Sea. However, passive microwave imagery from AMSR-2 reveals that the ice pack has become very diffuse within the Beaufort Sea, with ice concentrations dropping below 50%. Corresponding visible-band imagery from MODIS shows a mélange of very large and smaller multiyear ice floes surrounded by open water. The presence of open water surrounding the floes allows for enhanced lateral and basal ice melt, raising the possibility that much of the multiyear ice in this region will melt out during the remainder of the summer.”
Time will tell. This is the opposite to what is being said here, we will know by end Sept.
NSDIC also comment on the polar bears , seem they are enjoying the extra ice.
This summer, the ice has been slow to retreat in the Baffin and Hudson bays, as highlighted by the Multisensor Analyzed Sea Ice (MASIE) product. Throughout July, ice in the bays remained more extensive than in recent summers, adding an extra 500,000 square kilometers (193,000 square miles) of ice to the Arctic total. These areas, normally navigable at this time of year, are reported to be clogged with ice. The heavy ice conditions made fuel resupply difficult for some coastal communities in Nanavut and Nunavik. A supply ship was delayed three weeks attempting to reach Nunavik, and Arctic research projects have been delayed as well. More extensive ice than usual in the eastern part of Hudson Bay also resulted in delays of resupply for communities in Northern Quebec. Polar bears, which are usually farther out on the ice edge at this time of year, were observed in Iqaluit.
“The presence of open water surrounding the floes allows for enhanced lateral and basal ice melt…”
That is usually the case and what I was expecting, however it requires sunshine and temperatures above the freezing point of salt water. We have seen a lot of gloomy conditions, and what has really surprised me the past week has been temperatures as low as -5°C in the Beaufort Sea.
For example, O-buoy 12 is floating on a berg midst broken-up floes at the boundary of the Chukchi and Beaufort Seas, and today it finally got some sunshine, but the temperatures dropped down to around -3°C. It just isn’t the best conditions for “enhanced lateral and basal ice melt.”
http://obuoy.datatransport.org/data/obuoy/var/plots/buoy12/campbell/temperature-1week.png?timestamp=1438871838658
http://obuoy.datatransport.org/data/obuoy/var/plots/buoy12/camera/webcam.jpg?timestamp=1438871950090
Sunny skies, i thought it was cloudy up there? Let’s see come Sept what the final extent value is. Guess before hand are reknowned for being wrong. Mine was in 2014 and I notice Steve/Tony has dropped 2006 as a guide receently.
Andy
Yes, we shall see what we shall see. But it is fun to watch it happen, and see how it plays out.
I prefer the sunny views, but this may not last long. Another tight, little low is on its way from East Siberia.
if anyone had told me beforehand i would find a film of ice melting and refreezing interesting i would not have believed them 🙂 another example of your innate ability to provoke interest in something relatively mundane that actually has great significance in the understanding of the arctic sea ice.
the film also highlights the sheer amount of melt ponding in some areas , no wonder the nsidc has problems registering true extent.
i had heard of the term basal melt, but never enhanced lateral, so that makes two of us learning something new. i think it is time for me to buy a thermometer and make some sea ice cubes and sit them them in a basin of varying temperatures in my new chest freezer (it is for keeping fishing bait ) so i can see how small cubes grow and melt. i will place basins of sea water at varying temperatures to get some rough ideas on the speed of the process.
it will only tell me how sea water ice forms and melts in a chest freezer in my house,but should be interesting nonetheless .
https://sunriseswansong.files.wordpress.com/2015/08/obuoy-12-0806b-temperature-1week.png
https://sunriseswansong.files.wordpress.com/2015/08/obuoy-12-0806b-webcam.jpg
By the way, the ice is nice and white due to fresh snowfall.
Nice site Caleb. I take it those buoys are just free-floating and not anchored. Is there a link to find those?
The “North Pole Camera” Pictures are available at: http://psc.apl.washington.edu/northpole/NPEO2015/NPEO2015_webcams.html
However the really dangerous site, if you want to avoid spending hours on line, is the O-buoy cameras site. I’m warning you, once you start watching the time-lapse movies of camera’s pictures, (and discover you can watch cameras that existed in the past,) you will be late for appointments and hours behind schedule. However if you insist upon ruining your plans, the site can be found here: http://obuoy.datatransport.org/monitor#overview/gpstracks
The picture that blew me away today was from O-buoy 11. Remember, the PDO is spiking warm, and a fairly strong El Nino is occurring. The Beaufort Sea should be warming, but instead, what do we see? Salt water freezing, during the height of the melt season? Yikes. Time for me to go home and do a bit of rethinking.
https://sunriseswansong.files.wordpress.com/2015/08/obuoy-11-0806c-webcam.jpg
the presence of open water around the floes would seem to have opposing effects to me depending upon time of the year caleb. once the surface water temps drop below the freezing point , a large floe which has broken into smaller pieces has a lot more surface area exposed to accumulate ice.
with ice forming on all sides of these smaller flows, it is easy to see how large areas could see increased thickness over the arctic purely from an extra few centimetres of ice growth on each floe . it might not be multi year ice, but if the floe is 3 or 4 metres thick, that is additional ice being added at 3 to 4 metres top to bottom around the sides of the floe.(i may not have explained that properly,and it may well be wrong even if i have 🙂 )
the open water between floes early in freeze up season also allows more energy to escape,cooling the surface waters further,which should enhance ice formation.
I think in the current situation you can have a thin layer of ice forming around the edge of a berg even as the berg is melting further down under the water. (Yesterday I learned the correct jargon is apparently “lateral” and “basal” icemelt, and growth.)
If you have the time to watch the movie attached to O-buoy 7 you get a very good view of a sort of battle that goes on between freezing at the top (lateral) and melting from beneath (basal), especially as the camera tilts and looks right down at the crack that becomes an edge of ice. The refreeze is already starting when the ice cracks up on September 3, and the camera falls into the water Sept 22, and then is recaptured by the expanding refreeze on Sept 26.
http://obuoy.datatransport.org/monitor#buoy7/movie
I never thought about it before, but I bet you are right: Many small bergs would grow more ice than one big berg, (sort of like the coastline of Maine being longer than the coastline of California.)
Thanks for sharing your ideas.
Yep, Ice ages, glacier advances, and I guess about everything having to do with multi year ice on earth anywhere are best manifested by lack of melt during the summer and not expansion during the winter. In short, when it doesn’t melt like is used to is what gets my attention and I believe is the best indicator of the way things are headed.
Fact is that it wasn’t Lake Superior being virtually 100% ice covered winter before last that impressed me the most. It was the fact that last July there were still bergs of ice on the water and significant masses on the shore in a couple spots.
that is how i like to view things rah. it is not cold winters that are that impressive.i live in scotland, we have a huge variety of winter weather, from very mild , to 20 below, (i love fishing on calm winter nights with temps around 10 below) , it is cool shorter summers where we see just how fickle the climate really can be,and perhaps a glimpse of a place we really, really do not want to go climate wise.
Meanwhile the alarmist are fudging data in the Hudson Bay to show the Hudson Bay’s temperatures this July and August are above average. You can fool people but eventually the truth will get out.
Re: Hudson Bay ice extent 4th highest…
This is what I don’t understand. At this website, http://nsidc.org/arcticseaicenews/, they show the Hudson Bay almost totally devoid of ice (on this day 8/6/15
lucky for you i just received a reply from environment canada on this very issue. it appears nsidc use a lower resolution satellite that cannot detect sea ice in many different conditions, partly to do with the resolution only being 25km, whereas the resolution from radarsat 2 which the canadian sea ice service use has a resolution of 100 metres.
it should not make much ,if any difference, provided nsidc continue to use the same methods. i think it was crashx on another thread that said the nsidc product has been tweaked throughout its lifespan ,if so ,it will be hard to take anything meaningful from nsidc long term trends. better sticking to dmi extent.
dmi have started modeling thickness/volume, but going on all the other ice models, it will not be worth diddly squat.
Thanks for doing the work the mainstream media didn’t do, “bit chilly.”
no problem caleb, i do not know a fraction of what many people, including your good self do about the arctic climate, but blogs such as tonys and yours are fantastic places that highlight inconsistencies in the mainstream information outlets that prompt questioning from time to time.
By far the most ice for any year since 1992. Does not exactly sound like catastrophic warming, requiring huge taxes and regulation. Not to mention the burder on the consumer’s pocketbook and the economy in general that higher energy costs would bring.
Those that back the radical enviromentalist agenda, namely the Democrats, must be defeated. Not in love with Republicans either, but by far the better alternative.
Never fear, they now have an el Nino to get hysterical about…so they are ignoring the fact that an el Nino event is running alongside serious Arctic cooling centered around Hudson Bay. All Ice Ages manifest themselves first at Hudson Bay, not Alaska or Siberia.
It is very cool here in upstate NY. All week long, it will be colder than normal. We are getting some of this Arctic air right now.
If it goes like the last one then by next summer there is going to be band of warmer than normal water across the tropics in the Atlantic and we have a very good chance of actually having an active Atlantic Hurricane season.
You think their crowing about the El Nino, just watch what happens when Atlantic Hurricane incidence increases to an average or above average level.
i would say there must be a good chance of this, as noaa have just forecast a quiet hurricane season 🙂 usually whatever alarmist prediction is made,the exact opposite happens.
maybe they are employing a new tactic to encourage the climate to behave as they forecast !
perhaps we could get a few more boatloads of morons and moronettes to go take pictures and show us all the open water now that the ice has all melted, ha ha ha