
There has been no net change in Arctic sea ice area for 10 years.
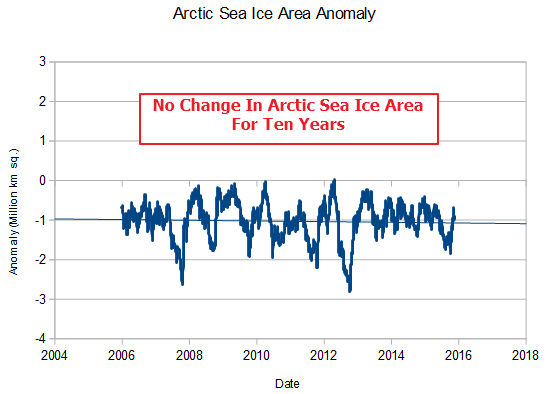
This represents one of the largest and most visible failures of the key members of climate mafia.
The Argus-Press – Jun 24, 2008
The Argus-Press – Google News Archive Search
Gore: Polar ice cap may disappear by summer 2014
BBC NEWS | Science/Nature | Arctic summers ice-free ‘by 2013’


I think NOAA may be crackling Joke LOL
I think at this point NOAA maybe sweating blood.
Hmmm. This may get interesting.
Whistleblowers Claim NOAA Rushed Contentious ‘Pause’ Buster Study Despite Reservations
http://www.climatedepot.com/2015/11/19/whistleblowers-claim-noaa-rushed-contentious-pause-buster-study-despite-reservations/
Your top graph shows Arctic Sea Ice declining since late 2012.
Steven, your first graph still contains the yearly cycle, so you can’t see the decline. This graph shows the Arctic sea ice area minimum, which is declining: https://d3800158-a-62cb3a1a-s-sites.googlegroups.com/site/arcticseaicegraphs/longterm/2015_sea_ice_CT_min.png?attachauth=ANoY7co10SSTmpgbtXbn9c7FdrGejqpAEtjifZbz4vZmqY8XMRtg4mANpu-k_mD2eYIOaGhqYll1G-t9qzzcfv-E8DztgWy1hWT0Dcy_91ShVPHL2NGogo2vDA8PoVVkpKIumcASVv10NDvBoWjPNkoyaMvFVTBsKnQNdp-mM4QII_p62zYg569AUlIGXEYH7KUx3gDnbgUBeLiS7IORkuRY9vth4acDgSPMMddts7pcVXuCmUn-aM0G_RYBY7lpKiI0tVAWFRlD&attredirects=0
This one shows the Arctic sea ice minimum volume,which is also declining: https://d3800158-a-62cb3a1a-s-sites.googlegroups.com/site/arcticseaicegraphs/longterm/2015_sea_ice_PIOMAS_min.png?attachauth=ANoY7crg73PsXJrZiOPHNKYBCFww-Fvw_Rv_YKcVRKysVsiOO15Ao13Cdh2j5B8AFua7l3chPYtq0ko4rRZi5jW74-bRHQsZEO8mOP4fYfPyMl-Osz2HEVDCb0CwuJVvO6MgnCRaCDPhr1_pfOpmyH-Q6-jpZxoFONXA2-qRfi0OKKdz8qbhkdTH8Y9sCgTW9DrJR_kRM1vHJysLyx0n2njfjSv-MiH3Ttkzqkxvz0ObAg41_3Vo0MKTJygwPkKQ8-oan2Q9sh-5&attredirects=0
learn to post graphs. you stupid moron.
Piomas shows that the Arctic sea ice as started to climb .. Exactly as anyone would accept with the AMO switch.
http://psc.apl.uw.edu/wordpress/wp-content/uploads/schweiger/ice_volume/BPIOMASIceVolumeAnomalyCurrentV2.1.png
Like most idiot trolls you have not even tried to learn anything about how these things work….
There are no “long term” sea ice graphs , they all start just at the very base of the AMO cycle. A long term sea ice graph would show mainly zero summer Arctic sea ice through the first 3/4 of the Holocene. The current level would be way above that, only just below the peak levels of the LIA, which was the coldest period in the last 10,000 years.
But you will ignore these facts, because you are destined to remain in your cesspool of ignorance (SkS) for the rest of your meaningless, putrid existence.
No, Andy, your graph does not show that the trend has reversed. You can’t detect a trend reversal in such a short time. See your same graph from 1982 to 1988, for example. Did you really not see that your claim is disproved already by your own graph?
Your ignorance of the processes that drive Arctic sea ice levels astounds even me.
The AMO has reversed, and Arctic sea ice levels have started to recover as part of the absolutely natural cycle… End of story.
FFS go and LEARN something !!!
Do something with your meaningless life…. get a basic education.
The linear trend is funny when only 7 years ago Hansen told all ice will be gone in 2018. Oh yes, they moved back to linear because it looks better now, but that does not mean the sea ice would reduce linearly in near future.
The best part of predictions like standards is that there are so many to choose from, and, if none tempts, you van make your own. We call it goal post moving. You can also retrospectively change old measurements to get better graphs.
And if all fails, you can start speculating. The number of polar bears could increase more or the amount of Antarctic ice would be growing faster without global warming.
Yea, your mommy.
More accurately, you cannot reliably detect any trend at all when you are looking at a linear trend in 35 years of data from a cyclic system with a known periodicity of 60 or 70 years.
This is not complicated. Consider this; I get a paycheck direct deposited to my checking account every two weeks. Follow my account balance starting the day after I get paid and draw a linear trend for the next ten days balance. “YIKES! I am going to be overdrawn in another couple weeks!” Someone please explain how my analogy is different from using linear trends and short data sets on Arctic ice.
Martin is STILL sooooo ignorant that he refuses to even try to understand that the 1979-2005 period was the upward leg of the AMO, and that the AMO is one of the main drivers of Arctic sea ice levels.
He is basing his linear trend on that short leg of the cycle, and is soooo dumb he can’t recognise that the AMO has switched and is now heading down.
His base level ignorance is again there for ALL to see.
This is Martin
http://mandelman.ml-implode.com/wp-content/uploads/2010/12/images-21.jpeg
Martin is trying to prove the corollary of the Turing test:
The corollary of the Turing test is a test of a human’s ability to exhibit unintelligent behavior equivalent to, or indistinguishable from, that of a machine.
MS probably doesn’t know what AMO means, let alone the obvious correlation with the PIOMAS graph you showed.
The obvious stable condition in the 1980’s followed by steady decline in the 1990’s, exactly when the AMO started to shift positive.
He’s probably just looking at the ice extent and volume numbers as if they were generated by some sort of random generator with no connection with Nature (reality) whatsoever.
What else should we expect from someone that believes in AGW models, except absolute lack of perception of reality?
I expect absolute ignorance from Martin.. and he keeps delivering.
As I said elsewhere, SkS and ThinkProgress are “negative knowledge” sites.
He has a lot to unlearn before he gets back to zero.
I always smile when I see the bold statement written in the linear trend. Yeah, as if it really is linear.
And then there is always this:
http://www.marketwatch.com/story/hottest-october-on-record-is-bad-news-for-polar-bears-2015-11-19?link=MW_home_latest_news
ESPECIALLY when an EXPERT in polar bears says:
August 13, 2015: 2nd highest ice coverage for Hudson Bay since 1971 at mid-August – only 1992 higher
2015 may be the earliest in many years that W. Hudson Bay polar bears head for the sea ice
November 5 ice in Hudson Bay:
https://polarbearscience.files.wordpress.com/2015/11/canadian-arctic-nov-5-2015_cis.gif
So it was a LATE ice out and an EARLY ice-up for Hudson Bay in 2015. Why is Hudson Bay important?
…………………
Back to the Polar Bears
Summer refuge for polar bears in Arctic Basin only 0.3 mkm2 below its possible maximum
MUST READ ON THE PROPAGANDA AND SCIENTISTS REFUTING IT
Barents Sea polar bears in excellent condition say Norwegian biologists