
This webcam image of a dining couple, confirms that the Maldives are now underwater.
Maldives Resort Videos | Live Videos of Anantara Kihavah Villas
This is exactly what experts predicted 30 years ago.
Ahead of the Paris Conference, China plans to finance the world’s first underwater airport there.

You should feel guilty about this, because your SUV also caused the Maldives to drown in 1837. You were warned!
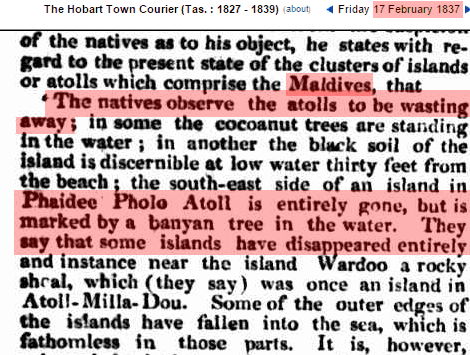
17 Feb 1837 – ACCOUNT OF THE MALDIVES.


Hi, long time reader, first comment, I love this site and all the information on here. I’m 31 years old, I really don’t understand much about math or science but I worry about all the climate change theories a lot, coming here helps, I have to ask, what about the claims that it’s only the sea ice that’s increasing but the land ice is decreasing which causes a bigger problem for sea level rise? Is it true that land ice is decreasing or can someone debunk this?
Hi, long time reader, first time commentor, I love this site and all the information on here. I’ll be honest, I’m 31 years old, I’m not very smart, don’t really know much about math or science. Everything that gets put out about global warming or climate change, call it what you will, really freaks me out, but coming here helps a lot. I want to believe 100% that it is all a big scare mongering scam and there’s nothing to worry about. One thing that worries me is the claims that it’s only sea ice that’s increasing and land ice is still decreasing that could cause big problems for sea level rise. Is this true? Is land ice still decreasing or can this be debunked?
Hi bobby, you ask “Is land ice still decreasing” ?
yes & no – some places are, some aren’t !! & it depends on a lot of variables.
Antarctica had a huge amount last year,
We know that Greenland accumulates ice at ~ 5ft/yr, ( the P38 aircraft ‘Glacier Girl’ was recovered in 1992 from 50 yrs of ice…all 268ft of it !! ) – http://tinyurl.com/o9cfzjo
When it comes to Greenland, we should say, –
“Grow some barley in open fields on Greenland & feed people with it…
just like the Vikings did.
Then we can accept that is as warm as during the Medieval Warm Period.”
Greenland has been gaining about 3 billion tons of ice per day since 1st September 2015.
You can follow the daily surface mass balance on the Greenland Ice Sheet here –
http://beta.dmi.dk/en/groenland/maalinger/greenland-ice-sheet-surface-mass-budget/
Snow & ice cover in northern hemisphere. Twenty Years of ‘Unprecedented Melting’ Has Left Arctic Sea Ice almost Unchanged
In 2015 – The amount of sea ice in the Arctic is essentially identical to 20 years ago.
Comparison of same June day, 20 years apart & look at the snow cover !!
see – http://tinyurl.com/o8cb3c3
Hope that helps.
The thing that really freaks me out, is the amount of money being made from the scam.
The ClimAstrologist do not look at the long term. They pick a short period of time (weather) and use it to make headlines about climate (long period of time)
In John Kehr’s book The I n c o n v e n i e n t Skeptic he points out many examples of glaciers that have reformed in the last 400 to 600 years. John is a Chemical Engineer who was uninterested in CAGW. His wife was a Greenie who wanted him to watch Al Gore’s film.
This decision from a disinterested engineer ultimately lead to a book presenting his independent research and his working with The Right Climate Stuff – NASA scientists review of climate change data. I would link to John’s website but unfortunately WordPress has censored it for the last year.
This is one of the more recent studies that John found on the Neoglacial interval. The time during the holocene when glaciers started reforming in the last four thousand years. Since 11,000 solar insolation at 60°/65° N latitude has been falling off during the northern hemisphere summer so snow is not melting at high altitudes/latitudes. I wish I could post this graph found in John’s article NH Summer Energy: The Leading Indicator, but my comment would get booted. Luckily E.M. Smith has a copy up of the graph and a discussion. Annoying Lead Time Graph (Also links to John’s site and yet WordPress will not me to allow link to John’s site at E.M.’s or Jo Nova’s for that matter. John must have some really good stuff!)
A new approach for reconstructing glacier variability based on lake sediments recording input from more than one glacier January 2012
John’s comment in his article Norway Experiencing Greatest Glacial Activity in the past 1,000 year
I think its instructive to look at a study done on Mt Baker using measurements from the US Geological Survey.
You can see that the movement of glaciers in this study are actually cyclical, for eg
https://wattsupwiththat.files.wordpress.com/2015/09/clip_image004.png
These movements also correlated very well to one of the main drivers of northern hemisphere sea and land ice, the AMO.
Here is another graph showing clearly the retreat and advance of Swiss glaciers with the AMO.
http://oi51.tinypic.com/24yptu0.jpg
What you also need to realise is that the AMO has peaked and is heading back down….
That means that northern sea ice and glaciers will go through an increasing phase for the next 20 or so years.
Very inconvenient for the alarmists, and they also know that this is what will occur.. that is why there is such a manic push for Paris to come up with signed treaties of socialist totalitarian global governance…. the next few years will totally destroy the AGW hoax. !!
meant to put a chart with that..
http://climate.mr-int.ch/images/graphs/amo.png
The latest studies show that the Antarctic are also gaining ice mass.
I haven’t got the link handy, but I’m sure one of the other guys will have. 🙂
I’ve just canceled plans for Maldives in Manhattan back in 1985.
Fort Dennison, in Sydney Harbour, Australia, has an active tidal monitor for 150 years. Contrary to IPCC reports, which the NSW Govt. has abandoned, the Fort Dennison station shows an increase of 45mm with no increase for the last 40 years. Water, being a liquid, would level itself out fairly quickly, I have yet to see a body of water with a lump in it, so would it not be safe to assume then that sea levels worldwide would have risen by a similar amount?
0.65mm/year actually for Fort Denison..
http://s19.postimg.org/o9k545yr7/image.jpg
Gravitational issues as well as subsidence or other land movements can cause local sea level changes. (because local sea level is relative to the land)
You can have a look at trends around the world at this link
http://tidesandcurrents.noaa.gov/sltrends/sltrends_global_country.htm?gid=1275
The average tide gauge trend is 1 – 1.5mm/year or there-abouts.
Fort Dennison, in Sydney Harbour, Australia, has had an active tidal monitor for the last 150 years. Contrary to IPCC reports, which the NSW Govt. has abandoned, the Fort Dennison station has shown a sea level rise of 45mm with no increase for the last 40 years. One would think that water, being a liquid, would rise in a fairly even distribution worldwide. Many of these sea level rise reports from the IPCC, NOAA and other alarmist bodies tend to be somewhat over exagerated.