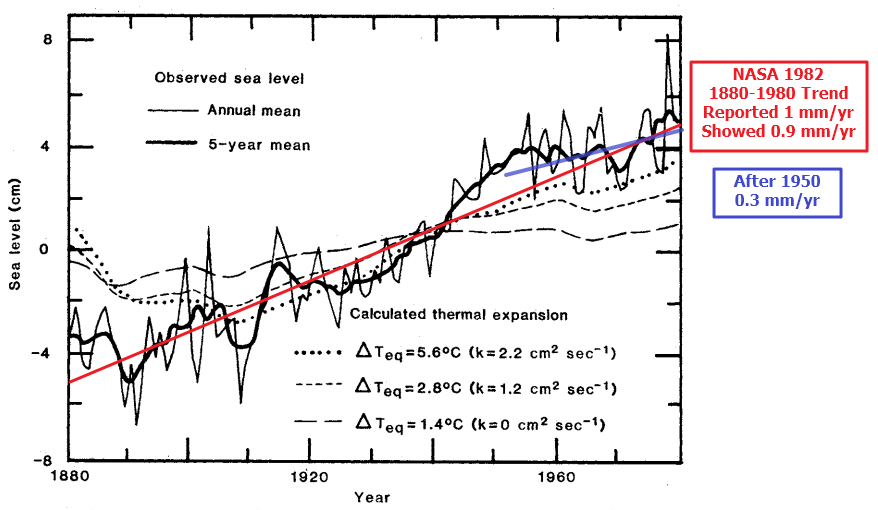
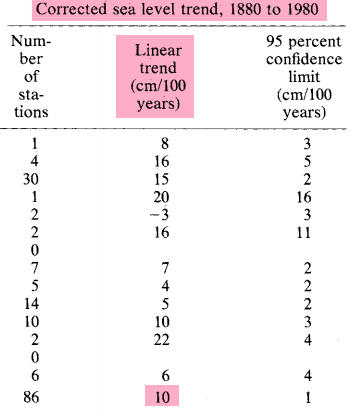
In 1982, NASA reported sea level rising 1.0 mm/year (less than 4 inches per century) from 1880 to 1980, and nearly flat after 1950. Their published graph showed less than 0.9 mm/year.
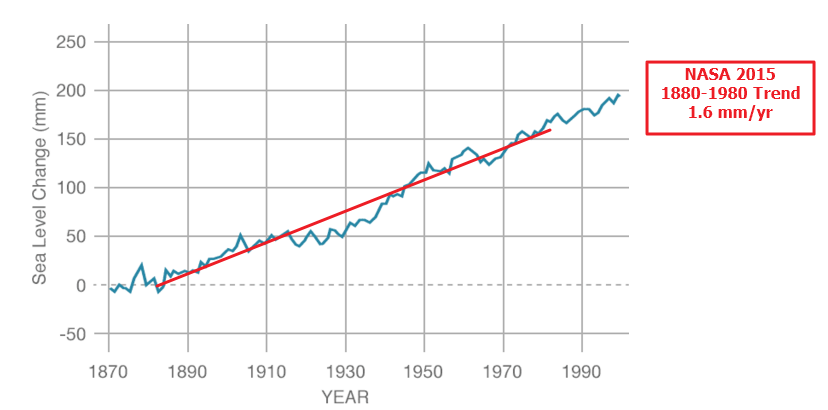
NASA has since increased 1880-1980 sea level rise rates by 60% to six inches per century.
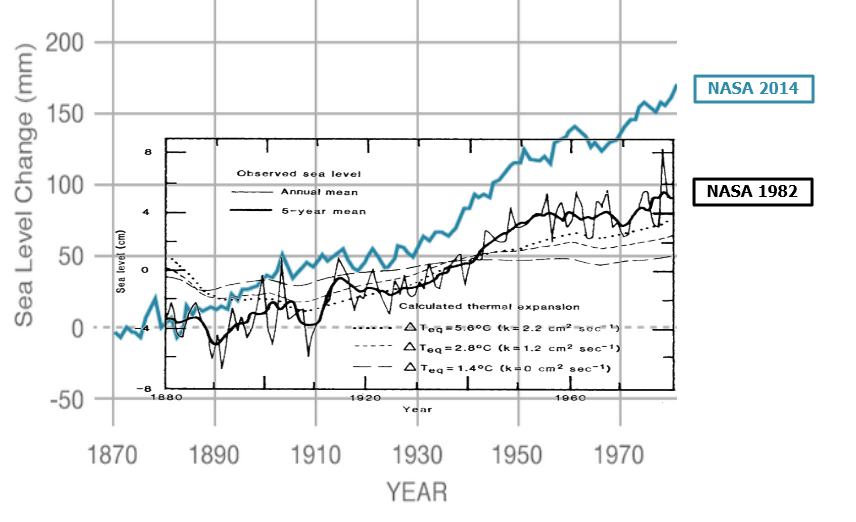
The overlay below shows how NASA has altered their 1880-1980 tide gauge data over the past 30 years, and wiped out the post-1950 hiatus
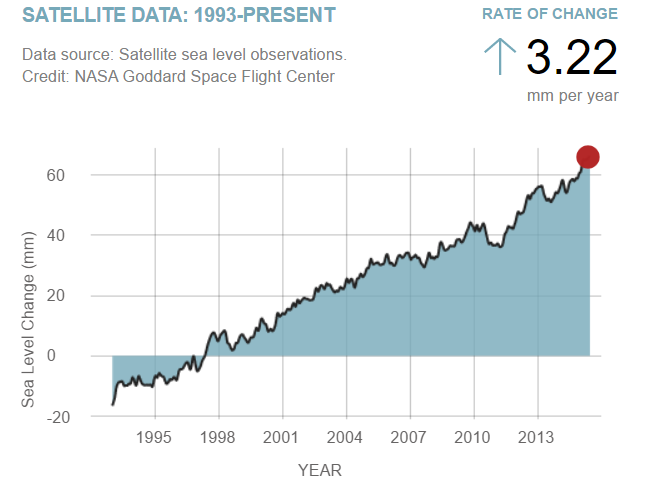
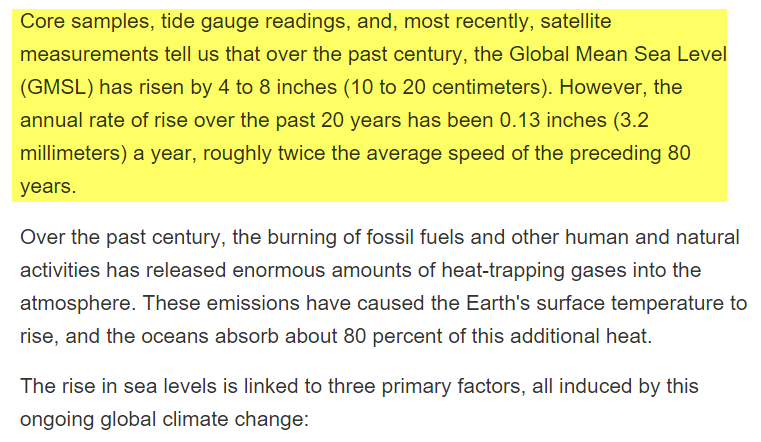
But six inches per century isn’t very scary either, so they switched measurement systems and added on 0.3 mm/year for a completely fraudulent tampering, called the Global Isostatic Adjustment (GIA) – which has absolutely nothing to do with the measurement of sea surface height.
These are incredibly cynical fraudsters, who expect you to believe that sea level rise doubled coincident with them changing measurement systems. And to hide their malfeasance, they simply stopped showing tide gauge data after 1994 – which would wreck their claim.
Then they send this fully fraudulent data out to their useful idiot friends in the press, who are happy to parrot it.
Make no mistake about it, government climate change science is the biggest fraud in history.




Could it be they believe what they do? Telling it is a fraud kinda misses the central theorem of bad science: never attribute to malice what can be attributed to incompetence.
I believe they are expecting to find large growing sea level rise because they expect accelerating OHC growth and glacier melt. You can easily measure it from a satellite provided you calibrate it to match your expectations. This is what they did. It’s just the expectations were wrong.
So you think their hiding the tide gauge data after 1994 was accidental?
Thanks for the laugh.
They just used “Mike’s Nature trick.”
Tide gauges stopped working because of high CO2 levels.
Hell Steve they can’t even leave a tree alone if someone uses it to gauge sea level. I’m pretty sure you know what I’m referring to.
RAH, link to your referring to – http://www.mitosyfraudes.org/Calen7/MornerEng.html
Another way of looking at what is going on is the tide gauge. Tide gauging is very complicated, because it gives different answers for wherever you are in the world. But we have to rely on geology when we interpret it. So, for example, those people in the IPCC [Intergovernmental Panel on Climate Change], choose Hong Kong, which has six tide gauges, and they choose the record of one, which gives 2.3 mm per year rise of sea level. Every geologist knows that that is a subsiding area. It’s the compaction of sediment; it is the only record which you shouldn’t use. And if that figure is correct, then Holland would not be subsiding, it would be uplifting.
And that is just ridiculous. Not even ignorance could be responsible for a thing like that. So tide gauges, you have to treat very, very carefully. Now, back to satellite altimetry, which shows the water, not just the coasts, but in the whole of the ocean. And you measure it by satellite. From 1992 to 2002, [the graph of the sea level] was a straight line, variability along a straight line, but absolutely no trend whatsoever. We could see those spikes: a very rapid rise, but then in half a year, they fall back again. But absolutely no trend, and to have a sea-level rise, you need a trend.
Then, in 2003, the same data set, which in their [IPCC’s] publications, in their website, was a straight line—suddenly it changed, and showed a very strong line of uplift, 2.3 mm per year, the same as from the tide gauge. And that didn’t look so nice. It looked as though they had recorded something; but they hadn’t recorded anything. It was the original one which they had suddenly twisted up, because they entered a “correction factor,” which they took from the tide gauge. So it was not a measured thing, but a figure introduced from outside. I accused them of this at the Academy of Sciences in Moscow —I said you have introduced factors from outside; it’s not a measurement. It looks like it is measured from the satellite, but you don’t say what really happened. And they answered, that we had to do it, because otherwise we would not have gotten any trend!
That is terrible! As a matter of fact, it is a falsification of the data set. Why? Because they know the answer. And there you come to the point: They “know” the answer; the rest of us, we are searching for the answer. Because we are field geologists; they are computer scientists. So all this talk that sea level is rising, this stems from the computer modeling, not from observations. The observations don’t find it!
Thanks DD Moore.
I was too tired to look for it. Shortly after that post ComCast decided I needed to be knocked off line and I just went to bed. So this morning my first task was to kickoff the power supply and then power back up so my cable modem reset.
I only use ComCast for internet. We’re at the end of their line so whenever they start working on something along my road I have to go through that routine.
DD More,
Just to go with that: TEN STUDIES PROVING SEA LEVEL HAS NOT RISEN AFTER HOLOCENE OPTIMUM
STUDY #1
Mid to late Holocene sea-level reconstruction of Southeast Vietnam using beachrock and beach-ridge deposits
The sea level was up to 1.5 meters higher than today in a tectonically stable area ~5000 years ago to 2000 years ago.
STUDY #2
Sea-level highstand recorded in Holocene shoreline deposits on Oahu, Hawaii
This study shows a sea level highstand ~1.6 meter above the present level from ~5500 years ago to 2000 years ago.
STUDY #3
Late Quaternary highstand deposits of the southern Arabian Gulf: a record of sea-level and climate change
This study shows a sea level highstand ~1 to 2 meters above the present level about ~5500 years ago.
STUDY #4
The Quaternary Geological History of the Santa Catarina Southeastern Region (Brazil)
This study shows a sea level highstand ~ 4 meters above the present level about ~5000 years ago. With sea level oscillating since then. Not only has the sea levels have dropped since the Holocene Optimum the evidence shows that “warmer paleotemperatures were favourable for great proliferation of mollusks in the area”
**************************************************************************
This last study is quite interesting because it is the key study that hauls the entire graph shown by WIKI from a descending sea level to an increasing sea level and yet other papers show that area of Brazil is tectonically stable.
**************************************************************************
https://upload.wikimedia.org/wikipedia/commons/1/1e/Holocene_Sea_Level.png
Santa Catarina is the dark red cross above the pack on the right. Remove it and sea level is actually falling for the last 2,000 years.
So what about that “…subsequent vertical geologic motions, primarily those associated with post-glacial continental and hydroisostatic rebound? “
https://i0.wp.com/basementgeographer.com/wp-content/uploads/2013/05/PGR_Paulson07_big.jpg
A NASA model of current surface elevation change due to post-glacial rebound and the reloading of sea basins with water. Canada, Northern Europe, and Antarctica are all currently rebounding at a rate of a few millimetres per year. More water in the oceans as a result of ice sheet melting is slowly depressing sea basins. Satellites are used to observe differences over time.
Notice the pivot point in the UK is ~ 55° N and the great lakes ~ 45° N which is one of the reasons why Southeast Vietnam ~10°N, the southern Arabian Gulf, ~ 23°N, and Santa Catarina, Brazil, 27° S are tectonically stable areas.
All four studies from around the globe (near the equator) show FALLING sea levels! WHERE does that ‘adjusted’ graph show that fall of 1 to 2 meters? Instead if you look closely the graph shows a ~1.5 meter RISE instead of a fall since 5000 years ago! That is an ‘Adjustment’ of 3 or more meters to data from tectonically stable areas. Lysenkoism at it’s finest.!
This is what they probably are using for their ‘adjustments’
https://web.archive.org/web/20060505184553/http://www.homepage.montana.edu/~geol445/hyperglac/isostasy1/uplift.gif
DD More and RAH,
Just to go with that: TEN STUDIES PROVING SEA LEVEL HAS NOT RISEN AFTER HOLOCENE OPTIMUM
STUDY #1
Mid to late Holocene sea-level reconstruction of Southeast Vietnam using beachrock and beach-ridge deposits
The sea level was up to 1.5 meters higher than today in a tectonically stable area ~5000 years ago to 2000 years ago.
STUDY #2
Sea-level highstand recorded in Holocene shoreline deposits on Oahu, Hawaii
This study shows a sea level highstand ~1.6 meter above the present level from ~5500 years ago to 2000 years ago.
STUDY #3
Late Quaternary highstand deposits of the southern Arabian Gulf: a record of sea-level and climate change
This study shows a sea level highstand ~1 to 2 meters above the present level about ~5500 years ago.
STUDY #4
The Quaternary Geological History of the Santa Catarina Southeastern Region (Brazil)
This study shows a sea level highstand ~ 4 meters above the present level about ~5000 years ago. With sea level oscillating since then. Not only has the sea levels have dropped since the Holocene Optimum the evidence shows that “warmer paleotemperatures were favourable for great proliferation of mollusks in the area”
**************************************************************************
This last study is quite interesting because it is the key study that hauls the entire graph shown by WIKI from a descending sea level to an increasing sea level and yet other papers show that area of Brazil is tectonically stable.
**************************************************************************
CONTINUED (WordPress is booting the full comment into the ether)
https://upload.wikimedia.org/wikipedia/commons/1/1e/Holocene_Sea_Level.png
Santa Catarina is the dark red cross above the pack on the right. Remove it and sea level is actually falling for the last 2,000 years.
So what about that “…subsequent vertical geologic motions, primarily those associated with post-glacial continental and hydroisostatic rebound? “
https://i0.wp.com/basementgeographer.com/wp-content/uploads/2013/05/PGR_Paulson07_big.jpg
A NASA model of current surface elevation change due to post-glacial rebound and the reloading of sea basins with water. Canada, Northern Europe, and Antarctica are all currently rebounding at a rate of a few millimetres per year. More water in the oceans as a result of ice sheet melting is slowly depressing sea basins. Satellites are used to observe differences over time.
Notice the pivot point in the UK is ~ 55° N and the great lakes ~ 45° N which is one of the reasons why Southeast Vietnam ~10°N, the southern Arabian Gulf, ~ 23°N, and Santa Catarina, Brazil, 27° S are tectonically stable areas.
All four studies from around the globe (near the equator) show FALLING sea levels! WHERE does that ‘adjusted’ graph show that fall of 1 to 2 meters? Instead if you look closely the graph shows a ~1.5 meter RISE instead of a fall since 5000 years ago! That is an ‘Adjustment’ of 3 or more meters to data from tectonically stable areas. Lysenkoism at it’s finest.!
This is what they probably are using for their ‘adjustments’
https://web.archive.org/web/20060505184553/http://www.homepage.montana.edu/~geol445/hyperglac/isostasy1/uplift.gif
Not accidental, but they thought the satellite data is better.
Think how complicated a satellite measurement is. Think how much sea level rise is expected. It is no wonder you see what you expect to see. You wouldn’t, because you expect the contrary.
Oh yes, of course some invididuals have been fraudulent, because of the good cause. Give them way to back, and they might back. If you don’t, they’ll fight.
Hey wert! I think that most of the people who have been watching this subject of CAGW have in the past considered it to be simple error but not fraud. Still, if you watch long enough, you see enough repeated obviously wrong actions that you finally have no other reasonable explanation but fraud. It is the prolonged (decades long!) pattern which shows intent to deceive.
I don’t believe in big conspiracy, sorry. Bad science, tendential writing, tenure fights, biased editorial boards, pal review and expectation bias I believe.
wert, that is because you have not been paying attention to the politics as well as the science.
The latest with NOAA/NASA resistance to disclosing the e-mails is because the e-mails contain evidence of wrong doing. We Americans learned just how crucial this type of correspondence is in the Watergate mess, the IRS mess, and the Hitlery as Sec of Sate mess. If a US president was forced to hand over private recording that implicated him then these GOVERNMENT EMPLOYEES don’t have a leg to stand on. But they will stall and whinge until after December when Obama will sign away US sovereignty and make the USA a vassal state of the United Nations government paying ONE TRILLION A YEAR in tribute and the e-mails showing fraud no longer matters.
***********
The Climategate e-mails show corruption to the point even Monbiot apologized and called for Phil Jones resignation. The Climategate e-mails also made it very clear that this was an international political issue and the corrupt scientists would be protected by the politicians and the MSM across the world. That point is the most scary in MHO because it means our politicians not only answer to someone else and not the voters, they answer to interests outside their own country!!!
Bishop Hill’s compendium of CRU email issues
The above two are darn clear these are NOT honest scientists!
Further explanations and a link to all the e-mails HERE.
***********
Also at this point NOAA/NASA do not have a leg to stand on after the attacks on Willie Soon and other scientists. Tell me how in heck they can refuse to disclose GOVERNMENT EMPLOYEES activities in the ‘Most Transparent Government EVAH!’ while demanding private citizens like Willie Soon disclose all?
The Nuts and Bolts:
Democrats call for information from seven climate testifiers’ universities Yes you read that correctly, Universities are getting called on by elected officials to disclose private info about University employees.
From the Senator Ed Markey website:
The actual truth of the matter:
CONTINUED:
Al Gore while Vice President point blank told Dr Happer he would either have to go along with the politics or be FIRED. “I was told that science was not going to intrude on policy,” Can it be made any clear than that?
Dr Jaworowski who testified before Congress was treated the same.
More persecution of scientists at the hands of politicians and universities include Dr Ball, Dr Gray, Dr Salby, and the latest, people who are not even ‘Climate Deniers’, Bjorn Lomborg and Phillippe Verdier, who was sacked for writing a book!
Belief is not required…
“We need to get some broad based support,
to capture the public’s imagination…
So we have to offer up scary scenarios,
make simplified, dramatic statements
and make little mention of any doubts…
Each of us has to decide what the right balance
is between being effective and being honest.”
– Prof. Stephen Schneider,
Stanford Professor of Climatology, lead author of many IPCC reports
~~~~~~~~~~~~~~~~~~~~~~~~~~~~~~~~~~~~~~~~~~~~~~~
“We’ve got to ride this global warming issue.
Even if the theory of global warming is wrong,
we will be doing the right thing in terms of
economic and environmental policy.”
– Timothy Wirth, President of the UN Foundation
~~~~~~~~~~~~~~~~~~~~~~~~~~~~~~~~~~~~~~~~~~~~~~~
“No matter if the science of global warming is all phony…
climate change provides the greatest opportunity to
bring about justice and equality in the world.”
– Christine Stewart, former Canadian Minister of the Environment
~~~~~~~~~~~~~~~~~~~~~~~~~~~~~~~~~~~~~~~~~~~~~~~
“The data doesn’t matter. We’re not basing our recommendations
on the data. We’re basing them on the climate models</b?.”
– Prof. Chris Folland, Hadley Centre for Climate Prediction and Research
~~~~~~~~~~~~~~~~~~~~~~~~~~~~~~~~~~~~~~~~~~~~~~~
“The models are convenient fictions
that provide something very useful.”
– Dr David Frame, climate modeler, Oxford University
~~~~~~~~~~~~~~~~~~~~~~~~~~~~~~~~~~~~~~~~~~~~~~~
“I believe it is appropriate to have an ‘over-representation’ of the facts
on how dangerous it is, as a predicate for opening up the audience.”
– Al Gore,
Climate Change activist
~~~~~~~~~~~~~~~~~~~~~~~~~~~~~~~~~~~~~~~~~~~~~~~
“It doesn’t matter what is true,
it only matters what people believe is true.”
– Paul Watson, co-founder of Greenpeace
~~~~~~~~~~~~~~~~~~~~~~~~~~~~~~~~~~~~~~~~~~~~~~~
<i."The only way to get our society to truly change is to
frighten people with the possibility of a catastrophe.”
– emeritus professor Daniel Botkin
~~~~~~~~~~~~~~~~~~~~~~~~~~~~~~~~~~~~~~~~~~~~~~~
“Effective execution of Agenda 21 will require a profound
reorientation of all human society, unlike anything the world
has ever experienced a major shift in the priorities of both
governments and individuals and an unprecedented
redeployment of human and financial resources. This shift
will demand that a concern for the environmental consequences
of every human action be integrated into individual and
collective decision-making at every level.”
– UN Agenda 21
wert says: “I don’t believe in big conspiracy, sorry. …”
>>>>>>>>>>>>>>>
It is not a big conspiracy it is POLITICS as usual pure and simple.
“The whole aim of practical politics is to keep the populace alarmed (and hence clamorous to be led to safety) by menacing it with an endless series of hobgoblins, all of them imaginary.” — H.L. Mencken, 1918
In one hundred years nothing has changed just the hobgoblin du jour. I am sure that when CAGW collapses under the weight of evidence a new hobgoblin will pop up and we will again have to play Wack-a-Mole. Personally I am getting darn sick and tired of the endless series of imaginary hobgoblins.
That is why it is the young and dumb but ardent ‘Activists’ that are captured and funneled in to the tightly controlled NGOs. It controls the dangerous lose cannons and harnesses their energy for the propaganda purposes of their puppet masters.
Maurice Strong’s early work with YMCA international “…may have been the genesis of Strong’s realization that NGOs (non-government organizations) provide an excellent way to use NGOs to couple the money from philanthropists and business with the objectives of government.”
“Very few of even the larger international NGOs are operationally democratic, in the sense that members elect officers or direct policy on particular issues,…. Arguably it is more often money than membership that determines influence, and money more often represents the support of centralized elites, such as major foundations, than of the grass roots.” ~ Hofstra University law professor Peter Spiro
wert, it helps to pay attention to the politics of climate change. You may not enjoy it but you can’t escape it. We don’t need to discuss the definition of “conspiracy”. Listen to what they say about it themselves. It has little to do with academic misbehavior like tenure fights, editorial bias or pal review.
Here is one of the scientists defining the purpose and the ends:
The original interview in German can be found here:
http://www.nzz.ch/klimapolitik-verteilt-das-weltvermoegen-neu-1.8373227
Herr Doktor Edenhofer is not just another economist. He is the co-chair of the IPCC Working Group III “Mitigation of Climate Change“ and the WGIII Technical Support Unit (TSU). He was part of the core writing team of the IPCC Synthesis Report of the Fifth Assessment Report in 2014.
The science journal Nature calls Edenhofer The Climate Chairman.
Do you think this is about academia and little nasty things these guys do to each other in the faculty lounges? You may ponder this remark by Professor Glenn Reynolds:
”
While I have my own ideas of what is going on, labeling it fraud is certainly a valid opinion. But in many cases in the past, this sort of thing was due to groupthink, scientific blindness, and bias.
Government run science is subject to all that and more.
I don’t think NGO science is any better, but mostly I agree.
The Gornitz et. al. 1982 study is too underpowered, demonstrably of poor design, and statistically flawed to make any conclusion. Having read that study, I concluded it is total statistical nonsense. It’s in as big of a mess as the NASA 2014 dataset. The PSMSL 2010 dataset is in complete disagreement with the NASA 2014 claims. It shows 1.39 mm/y SLR trend from 1980 to 2010 when using proper statistical methods.
You would think climatologists would spend some of their grant money and hire a mathematician to do the math.
Mathematicians are bad news.
The battle against global warming: an absurd, costly and pointless crusade
Société de Calcul Mathématique SA, September 2015
http://www.scmsa.eu/archives/SCM_Global_Warming_Summary_2015_09.pdf
Yep, that’s what they tell me. We’re nothing but trouble makers for stating the obvious (to us anyway). I read the Société de Calcul Mathématique SA, September 2015 statement and am in full agreement with it… Most climatologist can’t do math. The ones that can are usually attacked for daring to run outside the pack.
Hank they certainly don’t seem to have the best math skills.
CRU’s Dr. Phil Jones, world renowned climatologist, can’t even plot a trend in Excel
There is Dr Evans: Error 1: Partial Derivatives.
Doug Keenan on BEST and Krigging
William Briggs
Merck is even more scathing about Krigging:
https://web.archive.org/web/20141111203721/http://geostatscam.com/sampling_paradox.htm
Me? I have just enough math to say HMMMmmm that smells funny. Especially when a data point hundreds of miles away are used for an estimate and then an error of 0.1C or an increase in temperature of 0.026C is declared.
I do not find krigging ‘scientifically plausible’ for two reasons.
#1. The jets have switch from zonal to meridional meaning two temperatures at the same latitude could be very very different even though spatially close together. Both would be accurate but one would be used to either estimate or adjust the other with no valid reason.
#2. Frank Lansner’s analysis uses coastal stations plus non-coastal stations divided further into Ocean Air Affected stations and Ocean Air Shelter stations. That gives you at least three statistically different types of data —-OOPS. There went your ‘statistically valid’ out the window.
Frank tears apart BEST based on this and the fact they cherry pick: The Original Temperatures Project
Gornitz 1982 was almost identical to Hansen 1983.
I curious as to whether Hansen used the same selection criteria and assumptions as Gornitz? You wouldn’t happen to have a link to Hansen 1983 handy would you?
I found a link and am reading the study.
You’re right. Hansen 1983 gets a nearly identical result to Gornitz. Hansen uses a different selection criteria but makes the same correction to remove the long term (6,000 year) coastal change from the trend (seems a precursor to GIA).
Aside from your analysis of the difference between NASA 1982 and 2014/2015, there’s some other tomfoolery going on with NASA’s presentation. Not showing a longer historical perspective hides something we’re not supposed to notice – cycles of increases and decreases of trend. NASA narrows the scope to ~20 years in their interactive graph as that’s when the next positive phase of the cycle begins. Truncation of the tide gauge graph after 1994 hides the very low trend of the mid 1990s – an inconvenient thing to have to explain.
https://dl.dropboxusercontent.com/u/2113630/Screen%20Shot%202013-10-20%20at%2011.56.52%20PM.png
Total crap… 97% adjustments n bullshit… 3% actuals..
Why oh WHY would they stop using Tide Gage data.. records going back 100+ years… Satellites cannot measure the constantly changing and shifting Ocean to Land height accurately at this point in time…
Most Climate Change Believers have no idea the level at which models, estimates, and predictions are used over actuals…
It took me so long to read the comments, my feet started to get wet!
Really – if the sea level had been rising at the new rate since way back, we would have noticed. Same as the warming crap – nobody has noticed anything! If it wasn’t being pumped out the tv 24/7, general public would not be interested in the climate.
Yes, we are witnessing the first time in which a global disaster has been so horrific that no one can even observe its effects! 🙂
You just don’t understand. It takes a very very careful measurement to prove NY is under water.
Climate Marxists are playing pool with a broken cue stick.
This stuff from NASA is not science; they are just making it up as they go along to secure future funding.
NASA’s Kennedy Space Centre under threat from sea level rise
http://www.abc.net.au/news/2015-11-04/kennedy-space-centre-sea-level/6842304
“NASA predicts that if the Antarctic and Greenland ice sheets continue melting at their current rate, sea levels off the coast of the Kennedy Space Centre will rise up to 60 centimetres by the 2050s and 124 centimetres by the 2080s.”
And 60 cm by 2050 comes to 17 mm/yr and 124 cm by 2080 comes to 21 mm/yr The current rate according to satellites is 3.3 mm/yr and is slowing down rather than speeding up. The the people at NASA ever run the numbers?
I updated my chart for anyone who cares:
http://oi67.tinypic.com/ojdn6h.jpg
Given the downward tail at 2002 to 2004 in the blue line, you can see why they felt they had to ‘adjust’ the data to make sure it supported the theory.