
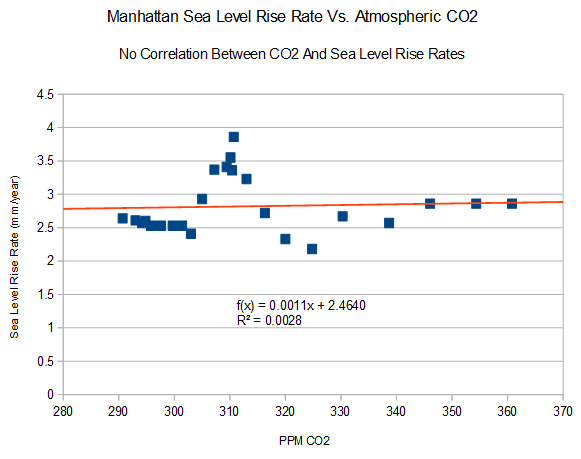
Manhattan sea level rise rates peaked at 310 PPM, and show no correlation with increasing atmospheric CO2.
Sea Level Trends – Variation of 50-year Mean Sea Level Trends
An entire field of science based on worthless and easily disprovable assumptions.

From what I have read, the entire Atlantic seaboard appears to be sinking. There are many places (land) in the world that are both rising and falling all the time, because of such thinks as continental drift causing one shelf to go under or over another. With all the historical ruins found at the bottoms of our oceans, how would we know if the world is in fact trending one way or the other as far as sea levels? Here in Florida there is irrefutable evidence that Orlando was once the southern coast of Florida. Steven, which way do you think its going and is there really a way to measure the entire worlds mean see level?
Here’s an interesting presentation by Dr. R. Steve Nerem who runs Colorado University’s Sea Level Research Group:
“Why has an acceleration of sea level rise not been observed during the altimeter era?”
Here’s the link:
http://www.aviso.altimetry.fr/fileadmin/documents/OSTST/2011/oral/02_Thursday/Splinter%203%20SCI/04%20Nerem%20ostst_2011_nerem.pdf
That pdf presentation is a few years old now, but the negative acceleration of sea level rise remains. One has to wonder what all the excitement is about if for the last twenty-two years there has been no acceleration of the rate. Couple that with the fact that it’s rather easy to determine that there’s been a good deal of inflating the rate of sea level rise by those same CU Sea Level Research Group scientists.
Simply put the URL of their home page (http://sealevel.colorado.edu/) into the Internet WayBack Machine (https://archive.org/) and see for yourself.
This archived time line:
https://web.archive.org/web/20040719102733/http://sealevel.colorado.edu/2004_rel1.2/sl_ib_ns_cu2004_rel1.2_global.txt
differs from the current one:
http://sealevel.colorado.edu/files/2015_rel4/sl_ns_global.txt
in a rather interesting fashion. Changes have been made to the data resulting in an increase in the rate of reported sea level rise by nearly a millimeter per year.
Here’s what that looks like:
http://sealevel.colorado.edu/files/2015_rel4/sl_ns_global.txt
Uhm, Here’s what that looks like:
http://oi67.tinypic.com/ojdn6h.jpg
Steve, wasn’t that about the time they said the ocean floor was rebounding, or sinking, or something like that….and they made “adjustments” for it
The GIA correction of an additional 0.3 mm/yr was added in 2011 to make their Sea Level graphic be representative of ocean volume.
The 0.9 mm/yr extra that I point out at the 2004 mark includes the 0.3 mm/yr GIA correction.
If you want to know why CU didn’t make a separate Ocean Volume chart, you will have to ask them that.
Thanks for the reply.
Steven, you can’t claim there is no correlation between CO2 rise and sea level rise by examining one location. You have to compare global mean sea level with CO2 ppm for the period, say, from 1880 to the present. Compute a trend for each and show them on the same graph.
No, he doesn’t have to do that. If sea levels were accelerating, they would be accelerating everywhere. Even Denmark. And stop calling him Steven,
That’s false, Morgan.
Not false, son.
There is absolutely no acceleration in the sea level trend in ANY of the stable tide gauges around the world.
That means that there is absolutely NO CO2 signature in the tide gauge data.
NONE WHATSOEVER.
You are avoiding REAL DATA again, slimy little Gore bot.
And making a fool of all Gore bots with your continued monumental ignorance.
You are an IGNORANT BASE-LEVEL LIAR, and a WASTE OF TIME AND SPACE
HEY MARTIN the sea level DROPPED FIVE FEET!!!! or about 0.3 millimeters a year.
Translation the sea level was up to 1.5 meters higher than today in a tectonically stable area ~5000 years ago to 2000 years ago.
There is absolutely no acceleration in the sea level trend in ANY of the stable tide gauges around the world.
That means that there is absolutely NO CO2 signature in the tide gauge data.
NONE WHATSOEVER.
You are avoiding REAL DATA again, slimy little Gore bot.
And making a fool of all Gore bots with your continued monumental ignorance.
You are an IGNORANT BASE-LEVEL LIAR, and a WASTE OF TIME AND SPACE
You mean like this?
https://stevengoddard.files.wordpress.com/2013/12/screenhunter_847-dec-25-17-29.gif
Unfortunately, I can’t send you to the original, since NOAA no longer shows that data in the same location:
http://tidesandcurrents.noaa.gov/sltrends/MSL_global_trendtable.html
If anyone knows of a working link to the latest chart, please post it.
Thanks.
Here’s the closest I can come up with:
http://tidesandcurrents.noaa.gov/sltrends/sltrends.html
By eye, I don’t see anywhere near enough red to cancel out all the blues, purples, black, and brown. I zoomed in, and couldn’t find ANY dark green or gray. The average looks pretty obviously to be in the 0-3mm/year range, with considerably more readings below that level than above.
When I click on “Global Trend Table” in the “Data Table” dropdown menu, I get a blank page. Maybe it’s just my weak internet connection, and a big file.
Ted, this paper from Israel shows that sea level rise is local, not global…and that 65% of tide gauges show no sea level rise at all
http://pluto.mscc.huji.ac.il/~msdfels/wpapers/Tide%20gauge%20location.pdf
http://tidesandcurrents.noaa.gov/sltrends/mslGlobalTrendsTable.htm
Thank you.
For whatever reason, that one still comes up blank for me. The page is there, but there’s no data. Hopefully Martian can see it, not that I expect it to change his mind. That chart shows up here regularly, so I’m not worried about seeing it myself today.
Martin believes that water mounds at one end of his bathtub.
Probably because of the bubbles when he talks.
I think it was the 2000 Olympics. Bob Costas was announcing the triathlon. After one turn, I distinctly remember him saying that it’s down hill for the rest of the swim. It was in the Sydney harbor, not a river. It became a running joke among some of my friends, for several years.
When I was a kid we had to walk two miles to school, and it was uphill both ways (-:
Sea level rise is two Lincoln Head Cent pennies pancaked per year.
The sky is falling.
Thanks Disillusioned, for keeping the perspective. Sea level rise, and all the other shibboleths of man-made global warming are allegedly measured over the entire planet and are tiny. Practically impossible to measure kind of tiny. Were it not for a continuous stream of propaganda and promotion; no one would even notice.
It seems everybody chooses the info which suits them best.
First regarding Satellite altimetry.
1) It does not measure sea level along coastal lines, which really is what is important.
2) Tide gauges are far more reliable
3) Altimetry has only been in use for a short duration, so it is much more difficult to determine trends.
Dave Burton who presents a total picture of happening at Sea Level Info
states that tide gauges indicate a range of sea level rise of 9.39 mm/year at Kuchiro, Japan
to a negative 17.5 mm/yr at Skagway Alaska.
The average of 225 stations is 0.90 mm/yr and the median (middle) value is1.41 mm/yr
NASA reports 1.7 to 1.8 mm/year but that is after several model derived adjustments.
Repeating something I stated earlier, calculations for glacial melt, and oceanic thermal expansion predict the oceans should be rising at about 1.1 mm / yr. The BAD part of ocean rise, has been the 42% from Sub surface water run off. In other words, the worlds water supply, in reality may be getting short.
Also, all indications are that there has been no increase in sea level rise since the heart of the Little Ice Age. and good Lord, have there been Collegiate warnings to the contrary, all based on cherry picked extrapolations. BS
Long term, if you consider these two studies among others, the amount of land ice was less during the earlier parts of the Holocene and has only returned thanks to the Little Ice Age. This means any ‘sea level rise’ is ‘short term’ due to a return to slightly warmer temperatures as the earth climbed out of the Little Ice Age or as you say due to the extraction of ground water.
I say short term because the Freemont Glacier show it went from Little Ice Age cold to Modern Warming warm in the ten years around 1850 link
Temperature and precipitation history of the Arctic
PLUS
A new approach for reconstructing glacier variability based on lake sediments recording input from more than one glacier January 2012
The highest glacier growth started 600 years ago prior to that most glaciers had melted away.
The “no acceleration signal” statements are absolutely correct. CO2, linear for thousands of years at 280ppm, rises 38% in 135 years and sea-level stays LINEAR!!! Here’s a 4 pager on topic:
http://www.colderside.com/Colderside/Sea_Level_%26_CO2.html
Are you sure about the CO2?
Info from Prof Z Jaworowski, Prof T V Segalstad and N Ono as well as Ernest Beck
http://www.greenworldtrust.org.uk/Science/Scientific/CO2-ice-HS.htm
Dr Jeff Glassman:
http://www.rocketscientistsjournal.com/2006/10/co2_acquittal.html
http://www.rocketscientistsjournal.com/2006/11/gavin_schmidt_on_the_acquittal.html
http://www.rocketscientistsjournal.com/2007/06/on_why_co2_is_known_not_to_hav.html#more
CO2: Ice Cores vs. Plant Stomata
https://debunkhouse.wordpress.com/2010/03/28/co2-ice-cores-vs-plant-stomata/
I do not think there is ANY data related to Global Warming that has not been ‘Adjusted’ to fit the political purpose.
So far tide gauges seem to be untouched.