
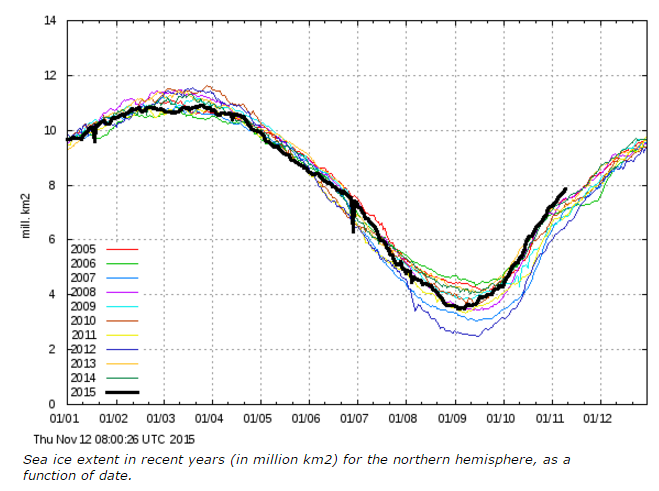
Arctic sea ice continues to grow at record rates, with extent the highest for the date since at least 2004.
Government funded climate experts like NASA will continue to lie about the imaginary meltdown for as long as they can get away with it. There has been no net change in Arctic sea ice extent since George Bush’s first term in office.

It’s like it took off!
(Does this mean a really cold winter? Brrrrrrr!)
That’s a good question, Scott. What do you think it means? Is the ocean up there colder now? Well, yes, part of it is: http://www.accuweather.com/en/weather-news/north-atlantic-cold-blob-could-affect-gulf-stream-weather-europe-eastern-us/52869594
What else? Could melting of the Greenland ice sheet be lowering the salinity of the Arctic Ocean? Well, yes, that’s happening too: http://www.gfdl.noaa.gov/flash-video?vid=cm26_sss_v6_noland&w=940
When you consider these two factors in addition to the fact that it’s almost winter now, so it’s getting really really really cold up there, the rapid increase in sea ice doesn’t mean much. It’s mostly seasonal, and it is affected by these known changes. However, keep in mind that this year’s Arctic sea ice minimum was the 4th lowest on record, and the current Arctic sea ice extent remains nearly two standard deviations below the mean. See the graph here: http://nsidc.org/arcticseaicenews/charctic-interactive-sea-ice-graph/
Martin says…What else? Could melting of the Greenland ice sheet be lowering the salinity of the Arctic Ocean? Well, yes, that’s happening too:
============================
Gee Martin, you linked to a “simulation” tat shows the seasonal cycle. This had nothing, nada, zero and zip to do with any change from any imagined increased melting of Greenland. In fact the mass balance charts show record increases in Greenland snow and ice.
No it isn’t, David: http://nsidc.org/greenland-today/files/2015/11/GrnToday_PoinarFig_Fig6.png
ROTFL Martin links to a Greenland chart that stops at 2012! And he uses it to argue about 2015.
How easy to predict that was.
Looks like Martin the Gore bot has used the wrong graph !
In Martians bizarro world of GLO-BULL warming Greenland is melting at -25 to -40 … too funny. And then he poo – poos the increased ice as not meaning much but obsessive-compulsive alarmists like Martian would be screaming if the ice was at low extent that it is proof that we are all going to die as the seas boil.
Martian should also keep in mind that his sea ice minimum was fudged with the Canadian ice services showing record ice in Hudson Bay while his sites showed no ice and polar bears with tracking colors where seen to be hunting on the ice where the alarmists sites had no ice existing. The sea ice increase seems to be inconvenient for poor Martian.
Increasing ice is just “seasonal”, while melting ice is not, it’s man’s fault. Got ti!
Oh! That remindss me you must have found that singular peer reviewed paper that refutes natural variability as the cause of recent, or any, global climate changes.
Care to share?
Even NSIDC doesn’t believe that mindless bullshit
Then what is your explanation? Forget that you are still using the wrong graph. Let’s just assume that the graph you are using is meaningful. What do you claim it means about the long term trend in Arctic sea ice extent? Why do you think this event is important in understanding Arctic sea ice?
All Steve is pointing out is that what is happening and has been happening in the Arctic for several years now is the OPPOSITE what was claimed would occure by the Alarmists from the IPCC and about everywhere else. The Arctic is gaining ice this winter at an unprecedented rate according to the DMi plot above which has been kept up for years and quite simply that is not what was claimed would happen by this point in time. Those that make long term predictions of what Sea Ice will do need to be ignored because NOBODY has the ability to make such a prediction knowledgeably because of the dynamic nature of that system.
Wrong Graph….. Martin the Gore bot. roflmao.
What a child’s mind you really do have.
Ok Marty I’m going pile on here. The graph Tony is using is the longterm data. The one you like to reference is a newly instituted metric and is only few years old. So (I’ll go slow)
to get a long term trend the graphic Tony uses is more indicative of what is happening in the Arctic that is why DMI uses BOTH data sets.
Ooooh you are really fibbing on that 2 standard deviations comment.
2015 sea ice level is just bordering on 1sd below the so-called mean in NSIDC
Trouble for Martin the Gore bot is that that mean is based on the 1981-2000 period which was still very much in the low part of the AMO cycle.
The mean is meaningless, just like saying it the 4th lowest is meaningless because the data period is so short.
Martin KNOWS this, yet still uses it, because is a Gore bot aimed purely at LIES and PROPGANDA MISDIRECTION..
http://climate.mr-int.ch/images/graphs/amo.png
It just so happens that the whole of the satellite era sea ice just happens to coincide with the upward leg, starting at the very trough of the AMO.
The Gore bot, of course will totally ignore the fact that for the first 3/4 of the Holocene zero summer sea ice was the norm, and that the current level is anomalously high in the long term , because we are only just a small bump out of the coldest period of the last 10,000 years.
ps . if you look at the chart, you can see that the so-called “mean” should be based on the period about 1978 – 2012, so as to take in the full upward leg of the AMO.
The current value would be well within 1sd.. ie insignificantly different from “average”
Bingo! Leaving 2012 out of the average is nothing short of dishonest. It is the most rotten form of cherry picking, like starting a climate graph in 1979. Nowhere else is this sort of fraud tolerated.
In fact, I would suggest that the current level of Arctic sea ice is pretty much exactly the level it should be for the current part of the AMO cycle.
It will now continue to climb over the next couple of decades, which will really upset the Arctic sea ice scarers. 🙂
“… the so-called “mean” should be based on the period about 1978 – 2012 …”
I have said this before, they conveniently use 1978 – 2000, which is more fraud on their part. If they use 1978 – 2012 they’re dead; they are dead anyway it would appear.
‘Sunshinehours’ uses 1981 – 2010, drops off the very peaks at each en.. I can be ok with that.
But the graph Martin the Gore bot wants to use, uses 1979-2000, and then he has the mathematical ILLITERACY to compare measurements to that short term mean.
He certain does seem to have a B***S*** in maths… Pathetic !
Is his ignorance just ignorance, or is it wilful? that is the main question.
typo.. again
at each enD…..
Andy – Your high ice at the 1979-1981 era and start of satellite data was confirmed in a Chicago Tribune story posted https://stevengoddard.wordpress.com/2015/11/05/after-predicting-a-new-ice-age-chicago-tribune-predicted-florida-would-drown/
March 2, 1975 & the Trib is confirming that:
In the last decade, the Arctic ice and snow cap has expanded 12 per cent,
The current start of Arctic Sea ice record is a high point.
The thing is that Martin lacks ANY understanding of any of this, and has made it quite clear he has no intention of trying to understand.
He is locked a world of his own ignorance, poor little Gore bot.
AndyG55 says:
November 12, 2015 at 6:06 pm
Wrong Graph….. Martin the Gore bot. roflmao.
But even the DMI recommends the other graph … “Please notice, that the sea ice extent in this plot is calculated with the coastal zones masked out. To see the absolute extent, go to this page. ”
When you go to that page it says
“The plot above replaces an earlier sea ice extent plot, that was based on data with the coastal zones masked out. This coastal mask implied that the previous sea ice extent estimates were underestimated”
Note the last sentence 😉
Andy
I see NOWHERE where they say ‘ this graph is incorrect’ nor do they say the recommend the other graph. NOWHERE.
Yes its a different methodology, but its the one SG has been using all along.
It is also the much longer running graph
So sorry you don’t like what it is telling you.
That’s your problem, not anyone else’s.
Oh sorry.. you want to see MORE sea ice.. okay then.. use the second graph 😉
Hey Martin, you say “What else? Could melting of the Greenland ice sheet be lowering the salinity of the Arctic Ocean? Well, yes, that’s happening too: ”
Rather obviously (as David points out) a computer model is not evidence of what is happening in the real world. A computer model is evidence of what is happening inside a programmers brain. See mario Brothers as an example.
More to the point, even IF (big if) the model is correct, pay attention to the Practical Salinity Units, the color scale which the animation uses. You will see that Greenland melt is NOT causing a lower salinity. The low salinity is a result of river flow into the Arctic Ocean combined with low evaporation rates (it’s COLD there!). As the water flows out of the Arctic basin it travels along the Greenland coasts, becoming more saline as it becomes mixed with saltier water which has intruded northward from the Atlantic.
Watch the water flow from the low salinity Arctic basin to the saline Atlantic. See the directions of flow. Watch how it becomes more saline as it moves south. Watch how you do NOT see a drop in salinity from Greenland melt water.
It is a beautify animation. Really pretty! Look at it. The water which has flowed past Greenland is more salty than it was when it approached Greenland. Look at it.
In addition the current is primarily wind driven and the salinity has natural seasonal flux. When SL was several meters higher, the ocean current continued unabated.
Now the AMO is simply changing, and Martin cries wolf.
Still making stuff up and insulting people, little Marty?
That’s naughty, your mummy will be cross.
“the rapid increase in sea ice ”
thank you..
Poor Martin the Gore bot makes his first admission to reality.
Now admit that for the first 3/4 or so of the Holocene there was mostly ZERO summer Arctic sea ice.
Admit that the current level is ANOMOLOUSLY HIGH because we are only just above the COLDEST period in the last 10,000 years.
Admit that the AMO has just passed it peak, and Arctic sea ice is naturally starting to increase.
Admit that the so-called mean is based on a period at the very bottom of the AMO and that the whole loss trend you want to try to push coincides with the upward cycle of the AMO, which is now starting to head downwards.
Or are these FACTS too much for the little Gore bot.
I hope you have a big rock to crawl under over the next few years as the Arctic sea ice levels continue to climb. You will need one.
“Looks like Martin the Gore bot has used the wrong graph !”
I don’t think he either knows nor cares one way or the other.
Trolls are like that.
Mike,
I beseech you: Heed MacMartin the Seer’s prophecies for the season. Sleet will set on Culloden Moor and horrid black rains will cause havoc in the Highlands. A two-headed calf will be born and a magpie will make a nest in a church roof for three years running …
https://coloradowellington.files.wordpress.com/2015/11/troll-seer.jpg
Given the switch in the weather pattern from zonal jets to meridional it will depend on where you live. If you live where the Wisconsin Ice Age sheets built up there is a good chance you will get lots of snow again this year. Where the polar deserts were (like Alaska and Siberia) not so much. IceAgeNow is already reporting major cold/snow events.
FROM THE LAST WEEK
November 10, 2015
Blizzard warning for parts of Rockies/Plains
Major snowfall in Reno, Nevada
November 9, 2015
Heavy snow blankets NW China
November 8, 2015
Kazakhstan – Snow, blowing snow, blizzards expected in most parts
China – Unexpectedly early snow – Prompts authorities to start providing heating eight days ahead of schedule to make sure that every household in the capital has access to heat.
November 7, 2015
Record snowfall in Siberia could bode ill for Northeast
Record-setting snow in Flagstaff, Arizona
November 6, 2015
Winter storm warnings for NW British Columbia and SW Yukon
A fresh blanket of snow on Cotopaxi — Cotopaxi is an active stratovolcano near the equator at lat. 0.68° S, height of 5,897 m (19,347 ft) It has one of the few equatorial glaciers.
November 5, 2015
Unusual spring snow in Argentina — This is the second time in 48 hours that snow covers the city of Ushuaia. ““The very unusual snow for November was accompanied by low temperatures down to zero Celsius and strong wind gusts varying in intensity. “
Christchurch – Coldest November temp on record
November 4, 2015
Record snowfall in Elko, Nevada — Breaks old record set in 1957.
>>>>>>>>>>>>>
Sep 10, 2015 WeatherBELL (Old forecast second hand)
WeatherBell = Joe Bastardi and Joseph D’ Aleo among others.
http://www.skisoutheast.com/wp-content/uploads/2015/09/2015-09-10-WEATHER-TEMPS.jpg
http://www.skisoutheast.com/wp-content/uploads/2015/09/2015-09-10-WEATHER-POD.jpg
Piers Corbyn over in Europe deserves a separate comment.
Last a guy I just stumbled on KasimsWeatherWatcher’s Latest UK Winter 2015-16 Weather Forecast. El Nino will be “Super” this year, meaning that the United States are likely to see some very severe Winter conditions with lots of heavy snow. Closer to home, it looks like Eastern Europe is also set for a strong Winter, this means it does look like Northern Blocking will be a keen feature of the Winter 2015/2016 forecast this year.
Somehow I do not think we will be mowing the lawn in a T-shirt this December as we have done in the past….
Well all I can say is that one should be able to sail right on around just staying on the coastal areas if the DMi plot that Martin claims is the right one is correct:
http://ocean.dmi.dk/arctic/plots/icecover/icecover_current_new.png
Tried something different that time and it posted an even older plot! Try again with the link to the current one:
http://ocean.dmi.dk/arctic/icecover.uk.php
http://Ocean.Dmi.dk/arctic/plots/icecover/icecover_current_new.png
Tried with Ocean.Dmi …
Martin appears to be a perfect candidate for an Arctic mission ; involving the “Ship Of Fools”.
More on winter forecast:
October 22, 2015 — Piers Corbyn
I got a real belly laugh out of this header:
https://weatheraction.files.wordpress.com/2015/10/wpid-cpkw1krxaaa5etv1.png
Martin says:
**However, keep in mind that this year’s Arctic sea ice minimum was the 4th lowest on record**
So that means that there were 3 lower ones.
So, Martin, how do you get decreasing or rapidly decreasing Arctic Ocean ice when it is not lower than before?
He is using the NEW IMPROVED COMMON CORE MATH!
It is illustrated here:
https://www.youtube.com/watch?time_continue=3&v=iKcWu0tsiZM
Not forgetting that the data is like only 37 years long (assuming you start in 1979 )
What Martin the Gore bot will totally REFUSE to recognise is that Arctic sea area is actually anomalously HIGH compared to the rest of the current interglacial.
You will NEVER get an admission that for a large part of the first 3/4 of the Holocene, there was ZERO summer Arctic sea ice.
You will NEVER get an admission that we are , in reality, only just above the coldest period in the last 10,000
FACTS that Martin the Gore bot cannot allow himself to admit to. because they TOTALLY DESTROY this anthropogenic warming FARCE.
It seems that basically EVERYTHING the climate scientists have been telling us, is A LIE
https://www.newscientist.com/article/dn28468-growing-corals-bathe-themselves-in-acid-without-suffering-damage/
So far Andy I have not found ONE THING connected to Alarmism that was not a lie. And I for one am sick to death of the MSM and the US government and the UN consistently LYING.
I am also sick of the lying, deliberate fraud, etc. etc. which surrounds us these days.
I do appreciate many of you who post here finding and linking to sources that I am not knowledgeable enough to find.
This year, the north polar vortex is strong. The temperature in the stratosphere quickly drops. This is good news for the US and bad for Europe.
http://www.cpc.ncep.noaa.gov/products/stratosphere/temperature/10mb9065.png
http://earth.nullschool.net/#current/wind/isobaric/10hPa/orthographic=-333.21,98.95,300
Thanks Ireneusz,
Maybe a blizzard for Paris from November 30 to December 11. This would be good news for us and bad for the IPCC and UN.
“a blizzard for Paris from November 30 to December 11”
I’ve often wished for that. Would be funny to watch the commentary. 🙂
http://www.weathertab.com/en/c/2015/12/republic-of-france/ile-de-france/paris/
November 21, 2013: Heavy snow hits eastern France — Three people died on Thursday after the season’s first heavy snowfall caused traffic and transport chaos in France.
November 24, 2013: Heavy snowfall in France – 40,000 homes lose power
February 7, 2015: France – More than two meters of snow in two days
February 22, 2015: France – Snow strands thousands of vacationers on the roads; France – Passenger train blocked by snow for more than six hours
March 5, 2015: France – 55 people trapped by snow — Visibility less than three meters (10 ft) and snow drifts 4 meters deep (13 ft) in places.
>>>>>>>>>>>>>>>>>>>>>>>>>>>
This is mainly the French Pyrenees. Paris usually just gets a dusting of snow unfortunately, That is why the Warmists picked it.
>>>>>>>>>>>>>>>>>>>>>>>>>>>
The Paris “blizzard” of 2013 (photos)
Accuweather forecast:
Europe Winter Forecast: Harsh Cold to Bypass London and Paris; Storms to Frequent Southern France to Italy and Alps
http://vortex.accuweather.com/adc2004/pub/includes/columns/newsstory/2015/650x366_10091538_2015-europe-winter-highlights(1).jpg
>>>>>>>>>>>>>>>>>>>>>>>>>>>
Jo Bastardi in September at No Tricks Zone.
http://notrickszone.com/wp-content/uploads/2015/09/2015-Atlantic.png
So I guess we watch the cold blob in the Atlantic and hope it moves into just the right place.
I’m surprised nobody is commentating that the graph seems to be a lot higher than other peoples graphs of ice extent. It looks like a problem rather than an actual extent. It doesn’t even look realistic on the value it is showing.
If you look at JAXA
https://ads.nipr.ac.jp/vishop/vishop-extent.html?N
That looks far more realistic and ties in with other sites such as Cryosphere and Bremen.
I don’t think it’s being questioned much here as it is a result that provides bias confirmation.
Andy
Here’s another graph. different methodology again. measuring a different thing (NCISC data iirc)
https://sunshinehours.wordpress.com/2015/11/12/sea-ice-extent-global-antarctic-and-arctic-day-315/arctic_sea_ice_extent_zoomed_2015_day_315_1981-2010/
As you see, there are several years, even in the very short term record, that are below the current.
You do understand that being this close to only 1sd below the 1981-2000 mean, so soon after the peak in the AMO is actually pretty much exactly where it would be in the normal NATURAL CYCLE, don’t you. ?
Now sit back and watch it climb back up to that mean over the next few years. 🙂
“the graph seems to be a lot higher than other peoples graphs of ice extent.”
Umm…… really ??????? the one you point to says around 9.3M km^2
The SG graph at the top says around 8M km^2
Do learn to read a graph, old chum.!