
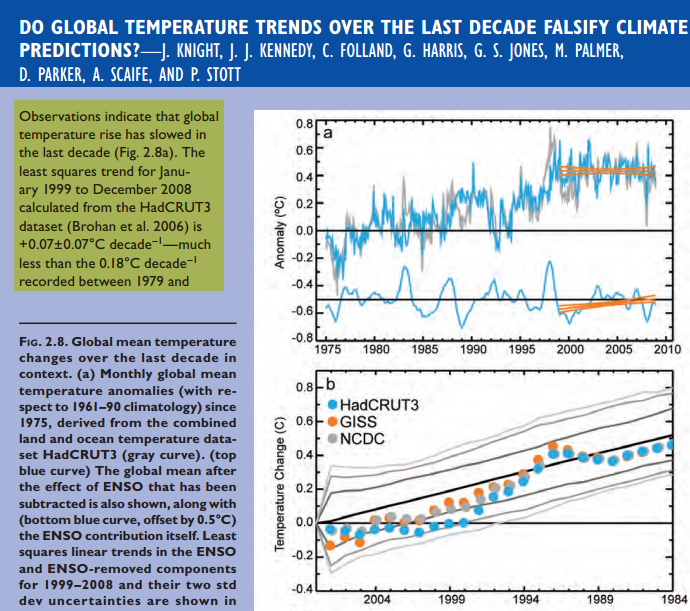
In 2008, NOAA correctly showed the hiatus in temperatures over the previous decade.
www1.ncdc.noaa.gov/pub/data/cmb/bams-sotc/climate-assessment-2008-lo-rez.pdf
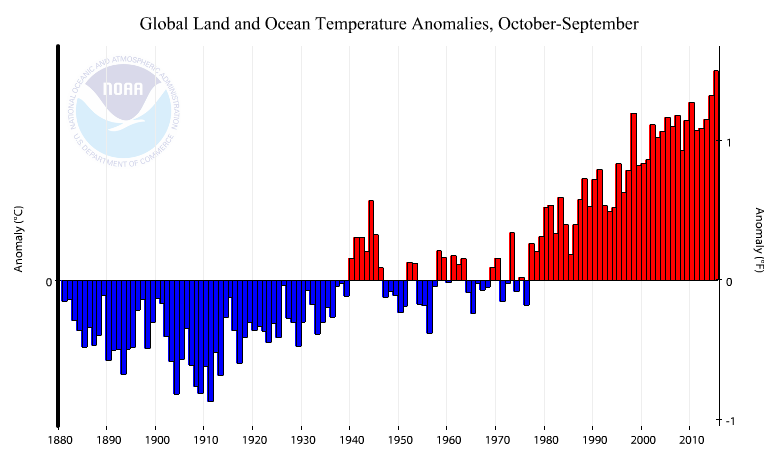
But this summer ahead of Paris, they made the hiatus disappear. NOAA currently reports directly to the Obama White House, so this sort of Grubering of the climate is to be expected.
A smoking gun of fraud is that the new tampered NOAA temperature data diverges from satellite temperatures at a remarkable rate. Satellites show cooling this century, while NOAA now shows a strong warming trend.
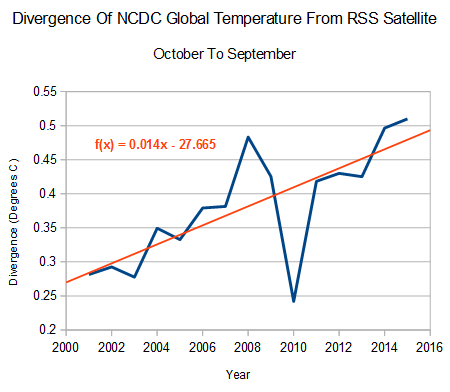
The new NOAA temperatures are diverging linearly from reality at a rate of 1.4C per century.
NOAA doesn’t actually have any temperature records from most of the land surface, so they simply make them up. Gray below is missing data.
If Tom Karl was an actual scientist, he would be not only mention these fatal issues prominently in the NOAA reports, but he would be so concerned about them that he would never actually release this meaningless and corrupt data. But the agenda is to create propaganda for the White House ahead of Paris, not do science.

At best, they were incompetent in their data handling, misguided in their tampering, and absolute fools to make any claims of warmest anything.
And this is the gold standard, according to a guy with a BA in English Literature and Philosophy.
But they are getting away with it.
Leftists always “get away with it”, at least for a while. And that is because they control the media, academia, and pop culture. This is how prohibition came to be. The indoctrination starts in our public schools, and surrounds its victims from cradle to grave.
For Pete’s sake, just look who is the leading in the democrat primary right now. Without the massive infrastructure of the left, that woman would be behind bars.
For this discussion, I will assume your graphs are correct. In that case, how does divergence prove fraud? You really have to explain that. If your explanation makes sense, then consider that you have recently hyped a study published by NASA that claims to show that the Antarctic ice sheet has been gaining more mass in the east than it is losing in the west. This study diverges from all the other measurements, including satellite measurements, which all show the Antarctic ice sheet losing mass. You claim that divergence from satellite data proves fraud in one case, but you claim that divergence from satellite data proves the satellite data is fraudulent in the other case. How can you think you are making any sense when you so obviously are being illogical?
Go ahead, call me names again.
https://coloradowellington.files.wordpress.com/2015/11/troll-logic.jpg
Apparently you can’t explain the contradiction in Steven’s logic, nor can you explain how divergence proves fraud.
Making stuff up to fill in the massive areas for which they have no thermometer data and then presenting the end results of such massive extrapolations as if they’re actual measurements which can determine if it is the hottest year on record to within less than 1/2 of a degree C as Gavin did in 2014 DESPITE THE FACT NO SATELLITE DATA AGREED WITH THAT CLAIM is not only illogical to begin with it’s a flat out dishonest. NOT using satellite data as the “gold standard” when it provides full coverage compared to any other system available is also illogical. Now go away troll. Nobody is buying the scam your selling.
When you call infilling “Making stuff up,” you only show you have no idea what you are talking about. The don’t make stuff up.
Yes it is Marty. They do not know what the actual temperature is, so they make one up. The fact that you do not understand this shows just how ignorant of facts and logic you really are.
Actually Gator they DO know what the actual temperature is but they do not LIKE that temperature. Therefore they remove that station as a reporting station and used others they like better (read warming) to ‘infill’ for that station.
E. M. Smith specifically talks of this in the The Bolivia Effect
https://chiefio.files.wordpress.com/2010/01/ghcn_giss_250km_anom11_2009_2009_1981_1990.gif
https://i2.wp.com/upload.wikimedia.org/wikipedia/commons/thumb/2/2d/Andes_70.30345W_42.99203S.jpg/800px-Andes_70.30345W_42.99203S.jpg
So yes they are fully aware of what the ACTUAL temperature is in Bolivia but they IGNORE IT so they can use made-up data to put a nice red spot on the map.
They do the same everywhere else. After all that was the entire point of the “The Great Dying of Thermometers” Those stations didn’t quit reporting, there data was just tossed out and made-up data substituted based on the stations THEY CHOSE.
https://i2.wp.com/jonova.s3.amazonaws.com/graphs/stations/great-dying-of-thermometers.gif
Technically I am correct. By ignoring the available data, they are being willfully ignorant of the actual temperatures. So in other words, they do not know the observed readings, and are simply making them up.
AHHhh but Gator, what they do know is the actual temperature is colder than the calculated one they use for infilling because that is the reason they removed that station in the first place!
Location Location Location: Well now we know….
So once again FRAUD!
Obviously even things most people understand are not apparent to you, kiddo. You want to be taken seriously. Some of us tried when you made your first appearances here. You didn’t behave like a serious person so we did the rational thing: We stopped taking you seriously. You are mainly operating in one of these modes:
1. You make bold a statement; when challenged you ignore what is said and repeat the same thing, ad nauseam
2. You make bold a statement; when challenged you ignore what is said and “move on” to something else
3. You make ad hominem attacks; when counter-attacked, you complain about ad hominems
You are a boring, run-of-the-mill troll and the only slightly entertaining thing is that you are so easy to ridicule. Enjoy the attention while it lasts.
errata: “You make a bold statement …”
If you can show any case where NOAA/NASA cold biased previous data to cool the present and warm the past, I will be all ears. But, of course, they always do just the opposite so the charts will fit their past forecasts and current agenda. Isn’t that fairly obvious?
Marty, it is a combination of inherent, constructive and extrinsic fraud and by showing a breach of legal duty, direct proof is not required.
fraud
n. the intentional use of deceit, a trick or some dishonest means to deprive another of his/her/its money, property or a legal right. A party who has lost something due to fraud is entitled to file a lawsuit for damages against the party acting fraudulently, and the damages may include punitive damages as a punishment or public example due to the malicious nature of the fraud. Quite often there are several persons involved in a scheme to commit fraud and each and all may be liable for the total damages.
Inherent in fraud is an unjust advantage over another which injures that person or entity. It includes failing to point out a known mistake in a contract or other writing (such as a deed), or not revealing a fact which he/she has a duty to communicate, such as a survey which shows there are only 10 acres of land being purchased and not 20 as originally understood.
Constructive fraud can be proved by a showing of breach of legal duty (like using the trust funds held for another in an investment in one’s own business) without direct proof of fraud or fraudulent intent.
Extrinsic fraud occurs when deceit is employed to keep someone from exercising a right, such as a fair trial, by hiding evidence or misleading the opposing party in a lawsuit. Since fraud is intended to employ dishonesty to deprive another of money, property or a right, it can also be a crime for which the fraudulent person(s) can be charged, tried and convicted.
Borderline overreaching or taking advantage of another’s naiveté involving smaller amounts is often overlooked by law enforcement, which suggests the victim seek a “civil remedy” (i.e., sue). However, increasingly fraud, which has victimized a large segment of the public (even in individually small amounts), has become the target of consumer fraud divisions in the offices of district attorneys and attorneys general.
Read more: http://dictionary.law.com/default.aspx?selected=785#ixzz3rJUZGhqZ
Most here think your case would be for naught, due to “taking advantage of another’s naiveté”.
AndyG no need to reply to Mindless Martin. He is a mind washed, kool-aid drinking (the purple kind), bot and cannot change.
His only hope is to be able to show his work to the “global overpopulation elite” with the hope that they will believe he was a follower and not be culled. Others have identified his type as “Useful Idiots”.
Here are the people he is defending.
http://thetruthwins.com/archives/30-population-control-quotes-that-show-that-the-elite-truly-believe-that-humans-are-a-plague-upon-the-earth
Althought I do think AndyG should be awarded the ” Biggest Billy Goat Gruff” trophy as the Regular Poster who best said,
Well come along! I’ve got two spears,
And I’ll poke your eyeballs out at your ears;
I’ve got besides two curling-stones,
And I’ll crush you to bits, body and bones.
That was what the big billy goat said. And then he flew at the troll, and poked his eyes out with his horns, and crushed him to bits, body and bones, and tossed him out into the cascade, and after that he went up to the hillside. There the billy goats got so fat they were scarcely able to walk home again. And if the fat hasn’t fallen off them why, they’re still fat;
http://www.pitt.edu/~dash/type0122e.html
<i,"Go ahead, call me names again."
That would be entirely pointless, like beating up a masochist.
As for “This study diverges from all the other measurements, including satellite measurements”, you really haven’t a clue what you’re wittering about, have you?
Perhaps you should have read Zwally et al before making a total fool of yourself.
It is fraud because the divergence is only due to adjustments, not measurements.
And it is fraud because when ever you actually look at the ‘reason’ for the adjustment you find it has as much credibility as Michael J. Ahern testifying for Al Capone.
LOL Gail, that is a blast from the past! Next you’ll be bringing up the stirling political record of Russ Hinze…..LOL
Well he ( Russ Hinze) certainly fits right in. Just like the infamous Mayor Richard J. Daly from Chicago. (Note that Obummer had another Chicago Mayor Daley (his son) in his Cabinet) The elder has recently had his reputation ‘rehabilitated’ and Progressive historians and political scientists now rank Daley as the #6 best mayor in American history. An excellent example of the Winners rewriting history.
Many members of Mayor Daley’s administration were charged with corruption and convicted but not he.
So Gail, where does Boss Tweed rate?
Don’t forget, Obammy’s original goal was to become mayor of Chicago. I have to admit, I never finished either of his books. But I don’t remember him talking about how much he wanted to clean up the office, when he got there.
inMAGICn says: “So Gail, where does Boss Tweed rate?”
…..
Mayor(s) Daley and Obummer’s role model.
You asked for it.
Are you really so naïve that you can’t believe that a satellite measuring temperature is radically different from a satellite measuring the altitude of the (ever varying on very short timescales) sea surface or a pair of satellites used as a gravimeter which cannot distinguish between the sources of changes in local gravity?
At least the temperature measurements are validated against contemporaneous balloon measurements. The sea level altimetric folks have chosen to ignore tide gauges and as for GRACE, sure, it can measure changes in gravity but the earths gravitational field is complex and continually changing. Which layer is most likely to affect gravimetric measurements – ice ( ? = 917 kg/m³), water (? = 1,000 kg/m³), lithosphere (? = 2,500 kg/m³), mantle (? = 3,900 kg/m³)? How can you tell which layer is changing?
Above comment re:
Martin Smith says:
November 12, 2015 at 1:40 pm
Steven, suppose I have 4 measured temperatures, each measurement being made at one of the corners of a square that is, say, 500 km on a side. suppose the temperature at each of these 4 corners is measured to be 0C. What would be your guess for the most likely temperature at the center of the square?
Key word is “guess”
Well, I am asking Steven Goddard, of course, but you are welcome to answer the question too. But please, answer truthfully. You only have to guess. You can use any other knowledge that you have as well, but just your best guess will be good enough.
Homogenization should give you a picture that has a bit more resolution, sort of like the sharpen command on your average photo software. It shouldn’t give you a different picture, but that’s what’s happened.
Try this: measure the corners of a square around the Black Hills of SD, all at 0C. What then would you expect the temperature at the summit in the center be? The earth does have topography, after all.
Or: more to the point, the temperatures at the corners are 0C, 10C, 15C and 7.5C. What do you expect the center to be, of course, again including topography, urbanization, water bodies, agriculture, etc.?
Go to Weather Underground for, oh, Merced, California, and look at all the various temperatures. Please tell us the exact average temperature for Merced to 1/100th of a degree.
Steve – please don’t encourage this person. They are having an inane one-way conversation with themselves. I, for one, will not participate.
To Steve (Tony). I’m not going to comment here again until Martin Smith goes away.
I will say it again: The level of immaturity of commenters here is astonishing.
WEE BIT of Projecting there Martin.
Frank, just ignore [unnamed].
He’ll get tired soon, zip up his pants, start typing with two hands again and go away forever. That’s the way those guys always do. I usually give them a few days to see if they have anything (some actually do, [unnamed] doesn’t) and then start ignoring them.
Just don’t respond to any of his taunts and comment as you usually would.
Actually the key word is ASSumptions or better yet BILLARD-BALL!
The earth ain’t no billard ball!
http://everestbasecamptrekguide.com/wp-content/uploads/2010/11/Makalu-from-Everest.jpg.pagespeed.ce.vWR7twP3Y8.jpg
Would those be measured temperatures, or ‘estimated’? I could ‘guess’ that the center of the square is 0C, but what if the center of the square is an urban area? Your guess of 0C would probably be way off the mark. Which is to say, most of us here would prefer actual unadjusted readings as opposed to estimates/guesses, ‘homogenized’ numbers or ‘reanalyzed’ data (side note: have you ever noticed that when the data doesn’t conform to the message, a ‘reanalysis’ of the data always brings it back into line with the message?).
A more realistic scenario is that the center is rural, and the “measured” edges are urban. The alarmists eliminated stations in rural, higher elevation, and higher latitudes, leaving a warm bias in the surface measurements.
https://www.youtube.com/watch?v=58mDaK9bH5o&feature=player_embedded&lang=en
This is what free thinkers call “fraud”.
No, gator, that is not more likely.
Yes Marty it is, watch the video and learn something, if you can.
The center of the square isn’t an urban area, pinroot. That’s why infilling is used. So the most likely guess would be 0C. When you consider that it has been proved that the statistical method used is much more skilful than guessing, and even guessing arrives at a probably near correct guess, you can see that infilling is valid.
But all of you are still not understanding why infilling is used in the first place. If you know, what is your counterargument? Inane responses in 3… 2… 1…
Yes, because the rural area between the 4 urban areas is the same temperature.
If the 4 corners were 0 degrees, NOAA would record 1 or 2 degrees for the corners and 4 for middle.
Morgan, I asked for YOUR guess, not NOAA’s. NOAA doesn’t guess. They use statistical methods that have been proved to be skilful. But your refusal to answer is noted.
After reading multiple Skeptical Science cartoons, Martin lectures on global temperature infilling: https://www.youtube.com/watch?v=3SnQFznDmq0
We call that a “Shart”.
Here is a real life example for Martin. I just picked the temps off Wunderground and the distances are the flight distances. 600 kilometers = 310.7 miles
‘THE BOX’
A = 59.2 °F
193 MI
B = 75.2 °F
156 MI
C = 71.6 °F
179 MI
D = 75.4 °F
90 MI
A =59.2 °F
So what is the temperature in the ‘middle’?
76.0 °F or 72.9 °F ???
Guess what martin THEY ARE ALWAYS HIGH! the state of the art station is within walking distance and the highs and lows are ‘adjusted the next day. In February the adjustments showed above freezing with RAIN for 48 hours while the town had SNOW and my water tanks got 2 inches of ice over night!
THAT is how ‘Skillful’ NOAA is. They can’t even tell the difference between snow and rain! AND Karl lives within easy driving distance!
Motor Mouth Smith…you remind me of an acquaintance in High School. Same attitude, same argument style, no facts, no logic, just words and he thought he was very intelligent…only thing is, everyone laughed behind his back and some even to his face but nothing could stop his motor mouth. Is there a sciency descriptor for your handicap? Or did you indulge in too much good shit and some of neutrons are now fried. Just wondering.
I can’t believe this schmuck is rationalizing data tampering. He’s actually arguing that it’s ok to make data up. What a fing douche bag.
Again, your response proves you don’t know what you are talking about. Nobody makes up data.
For example, do you understand that satellites don’t measure temperature? Temperature is inferred from the data recorded by satellites. Why don’t you call that making up data?
Is the infilling a known quantity, or a guess? Do you even know?
Satellites provide REAL DATA from which the temperature can be developed and which has a good track record of being accurate from MORE THAN ONE SOURCE. Even the Met Office has agreed they are the way to go!
“Temperature is inferred from the data recorded by satellites. Why don’t you call that making up data?”
Because there is a documented chain of reasoning, a chain which is based on clear principles of physics, which correlates satellite microwave radiometry with temperature. Infilling does not have that chain.
With missing ground based data, you can either leave the empty spots empty (and increase your overall error bars) or you can use some clearly documented algorithm (AND EXPLAIN HOW IT WORKS AND WHY IT IS USED) and still increase your error bars. Without reproducible methods and clear justification it is not science, it is guessing. NOAA guesses.
Satellites do measure direct temperatures. They use microwaves for cloudy area but they also measure IR in cloud-free areas. They also compare the former measurements with weather balloons for calibration. One thing they don’t do is make up data. That’s what you do.
“Nobody makes up data.”
Semantics. OK, in order to pander to your pedantry, the numbers are “calculated”. Either way, they’re not REAL (i.e. not measured), geddit?
“Do you even know?”
He’s certainly having difficulty understanding why using estimated* values is a bad idea. Perhaps he should try it on with the tax department.
*Martin, if you’re having a problem with naming, here’s a hint: the values are marked with an “E” in the record. Guess what “E” stands for?
UAH and RSS over the USA have trends that match very closely to USCRN (and ClimDiv).
This match to the most pristine, evenly spaced. surface station data validates the UAH and RSS temperature extraction routines. RSS and UAH are essentially CORRECT, and have a far smaller built in error than the massive fabrications from NOAA/GISS.
But you wouldn’t know anything about “validation” , because you “believe” in the farce that Gavin et al produce, also you believe in the climate models that have been shown to be massively warming biased.
E = ESTIMATED = GUESS.
Actually, NOAA does something worse than just guessing. They infill without a clear explanation of how one can reproduce their numbers, and then claim it is science. This is bad science as well as being functionally indistinguishable from guessing.
The question is actually not what the temperature estimate would be at the center of that square, but what would be the appropriate margin of error for the estimate that is chosen.
Excellent point!
On Thermometer resolution, and ERROR
http://pugshoes.blogspot.se/2010/10/metrology.html
http://strata-sphere.com/blog/index.php/archives/11420
One point that many over look is the fact that the instrument may have decent repeatability, resolution, and error but the atmosphere does not. The temperature both vertically, horizontally and over a short time is going to have a range especially outside. So even if the instrument is good to say 0.0001C the reading is still going to have an error of ~0.5C (SWAG) because the atmosphere is not uniform and never will be.
This is a problem that anyone in manufacturing QC, especially when dealing with batch chemistry, is all too aware of. It is the reason the US military issued Mil Std 105D in 1963. And it is the reason international corporations are trying to weasel out of it with the ISO crap.
Unfortunately accountants and corporate execs LOVE ISO…. until it costs them a couple million.
That’s not the issue is it Martin and illustrates your continued ignorance of reality.
Suppose one of those corners was a small urban area measured at 4C and the other corners were rural measured at 0C..
An unknowing person might say the whole square averages to 1C, where as actually most of that square was 0C
NASA/Gavin would use homogenisation to another 4C urban centre 1500 miles away to show that each corner was really 4C, then infill everything to 4C.
If you extrapolate 500 km, you are about +/- 5C error. Then declare a record by 0.01C. Tom Karl science.
http://images.remss.com/data/msu/graphics/tlt/medium/global/ch_tlt_2015_10_anom_v03_3.png
Is the center of the square the same height above sea level, the same type of vegetation, the same population density, the same industry or type of farming, is there a major highway anywhere on the square, is there a large body of water anywhere near?
Jeb Bush is at the center of the hypothetical square getting ready to toss baby Hitler into a lava lake atop a snow capped volcano. Sheesh. For the four corners, and the center, we would typically know the elevations, this will be a factor in the guess. Yet it’s only a guess, not a measurement.
Well I hope you were trying to agree with my because you just made my point. There are few places on land where 250 km would not have an impact of a few degrees up or down from a base point.
Guessing does not cut it.
Yes wizzum, and the baby Hitler meme is just adding to the already ridiculous nature of the 500KmSq hypo. snow capped erupting volcano Widens the error bars. 😉
Martin Smith says:
**Steven, suppose I have 4 measured temperatures, each measurement being made at one of the corners of a square that is, say, 500 km on a side. suppose the temperature at each of these 4 corners is measured to be 0C. What would be your guess for the most likely temperature at the center of the square?**
In the real world, they do not use squares. They also do not disclose their methods.
In the Arctic, only one station, Eureka, is used for a large area. So that results in infilling, generation, made up observations or whatever term you want to use. they would be much better of using only Eureka and leaving the rest as unknown instead of coming up with potentially false tendencies. We hear the Arctic is “warming rapidly” – based on what? – generated temperatures?
Eureka is known as the “Garden Sopt of the Arctic”, because it runs slightly warmer than the rest of the Canadian Arctic, and thus has abundant flora and fauna not found anywhere else in the region.
https://en.wikipedia.org/wiki/Eureka,_Nunavut
I wonder why they chose Eureka?
Martin Smith says: “…When you call infilling “Making stuff up,” you only show you have no idea what you are talking about. The don’t make stuff up….”
>>>>>>>>>>>>>>>>>>>
Good grief I already went over Krigging and “The Great Dying of Thermometers” and had a long argument over it with you just a few days ago. You should really get to a doctor fast because such memory lapses are a sign of heart disease.
http://jonova.s3.amazonaws.com/graphs/stations/great-dying-of-thermometers.gif
The “DEATH” was accompanied by a major increase in ‘warming’
http://jonova.s3.amazonaws.com/graphs/temperature/number-%20temperature-stations-ghcn-1701-2008.gif
Steven showed how the — krigged/infilled/made-up data — changes the trend from cooling to warming.
http://i1.wp.com/realclimatescience.com/wp-content/uploads/2015/07/ScreenHunter_10009-Jul.-27-12.16.gif
“The biggest component of this fraud is making up data. Almost half of all reported US temperature data is now fake. They fill in missing rural data with urban data to create the appearance of non-existent US warming.”
http://i0.wp.com/realclimatescience.com/wp-content/uploads/2015/07/ScreenHunter_10010-Jul.-27-12.20.gif
And that is just ONE of the frauds….
Hey Gail, if were a CAGW proponent this would be my answer to you:
“IS NOT!! IS NOT IS NOT IS NOT!!””
You forgot this:
https://lh5.googleusercontent.com/-BQbZR0xZNbg/TYlVe7ysiTI/AAAAAAAAAVE/OjcEJxmABrM/s320/Tantrum.jpg
Just remember Gail,
Martin the Gore bot is incapable of actually comprehending FACTS and DATA.
He is the equivalent of a parrot.. of the Norwegian Blue type.
All you will get from him is a “sqaurck” as he falls off his perch.
Just make sure you have the UK Groniad under him for a bird cage liner….
Those are the wrong graphs.
“Those graphs are wrong. These are not the droids you are looking for. Move along.”
Luckily more and more people have noticed that the official data does not match their reality.
http://www.nationmultimedia.com/opinion/Cold-sun-rising-30272650.html
WOW!
That is a great article. I think the writer actually hit all the high points.
From what I understand, it was the changes made to the ocean surface record (ERSSTv4) which were instrumental in eliminating the pause. What Tom Karl did was to adjust recent sea surface temps to match the earlier record consisting of ship intake and bucket readings (ICOADS). What Karl might have neglected to do however is to properly account for error estimates which in all likelihood are greater as a result and probably would exceed whatever continued warming was claimed.
GOOD GRIEF! It’s worse than we thought!
No wonder they are after all information including e-mails.
They claimed, correctly, that the old measurements were hopelessly tainted, do to innumerable errors. Based on that, they adjusted the new, accurate, thermometers, to match the old numbers.
……………………………Science……………………..
https://www.youtube.com/watch?v=G2y8Sx4B2Sk
Ha! Yes, they really did do that.
The only equally bad thing I can think of was the study that “found” the non-existent tropospheric warm spot by throwing out the actual measured thermometer data, and inferred temperatures based on a supposed correlation with wind sheer.
Reblogged this on Climatism.
Look, the Apocalypse is happening in China right now!
“Apocalyptic China scenes ahead of climate talks”
http://www.usatoday.com/story/news/world/2015/11/12/china-probably-doesnt-want-you-looking-these-photos-global-post/75636066/
“Apocalyptic scenes such as these are common in northern China during the winter, when the country cranks up its coal-fired public heating systems to keep people warm” with interlaced images of Chinese wearing surgical masks and fog they claim is smog.
Maybe a meteorologist can chime in, but according to Accuweather at this moment, Beijing has “Fog”, the dew point is 43 F and temp is 45 F with humidity at 93%. Meanwhile, traffic is flowing smoothly and it looks like a lively Times Square in NY in their video. You see people commonly wearing surgical masks over their face in China. Is this due to smog or other reasons, such as fear of spreading germs?
“In many Asian countries, even parts that aren’t heavily populated, it’s common for people to wear the masks if they think they’re getting sick, are sick, or even have a slight cold. They do this as a courtesy to prevent spreading their own infection to others.” (http://zidbits.com/2011/12/why-is-common-to-see-people-wearing-surgical-masks-in-asian-countries/).
China has the problem they use human manure on their fields to grow food. Unfortunately they now have a problem with resistant microbes… And the USA wants to import food from China???
‘Superbugs’ found breeding in sewage plants
The Curious Case of the Chinese Chicken Import-Export Business
GEE, THANKS WTO!
China has a lot of growing pains. I think they are doing pretty well for 1.3 billion people and getting their own people access to fossil fuels, which is powering their economy and their GDP is now $10 trillion. Meanwhile the US wants to move backwards?
If smog is mostly really fog, then very little harm is being done, but I’m sure some amount of air quality is an issue around the factories. The article I referenced is confusing fog with smog, it appears to me. CO2 doesn’t cause smog anyway (does it?).
I’m not an expert but this should be easy to understand. Chicken Little is everywhere these days pushing for the Paris summit. It would be funny to see a huge blizzard crash their party, where I”m sure they will dine on French cuisine, caviar, local cheeses, Bordeaux and other fine wines, and travel around in luxury limos and airplanes saving the planet. There won’t be any soy burgers I’m pretty sure. Hypocrites in Chief.
Like our own digestive systems, pro-biotics using lactobacillus and other friendly strains (like in yogurt, kefir, kombucha) I think could be used to help keep the dangerous strains at bay in sewage treatment plants. They would eat up the sugars and methane would be kept at a minimum while out-producing the dangerous bacteria. Sewage would actually smell fresh. I ferment my dog’s food this way with cheap ground burger, shredded sweet potato and carrot, some pork trimmings, gizzards, liver (whatever I can find 30% off at the grocery store), and maybe some prepared lentils/beans with yogurt and kombucha, small amount of olive oil, sea salt and keep it in a covered glass container in the fridge. It smells fresh until it gets used up usually within 4 or 5 days at a time. I’ve kept it even longer and it just continues fermenting or “pickling” similar to ceviche. Doggie eats it right up. For the dog, it is pro-biotic, full of enzymes, retains vitamins like B6 (destroyed by cooking). I’m not sure if this would work on large scales in a sewage treatment plant but I don’t see why it wouldn’t. The resulting fermented product could be dehydrated and used on fruit trees. I wouldn’t recommend human sewage on food gardens unless it’s been composted for several years, but in some parts of the world this is all they have.
When it comes to chickens, the Chinese love chicken feet! I just made some broth using chicken feet and it is a great way to use leftover parts from a chicken that usually gets discarded. Give feet to dog or nibble on them! I got past the yuck factor a long time ago. Guess what – tastes like chicken! 🙂
Speaking of French Cheeses, you will love this article too:
Then they came for the Roquefort: The FDA is coming after your French cheese (I love cheese. if I was not so lazy and such a rotten milker I would milk my goats and sheep and make my own cheese.)
This page shows the differences between GHCN anomaly snapshots released in recent years (thanks E.L.). The number of confidence interval violations is interesting, as is the ~4C/century of “adjustment” warming from the 2014 to 2015 snapshots.
Uh, here it is… http://www.elcore.net/GISTEMP_Overconfidence_Intervals.html
the MMTS sensors used have an accuracy of “generally” +/-0.5°F according to NOAA so like so many of these trends it’s still in the noise… especially if it is based on “average” temperatures.
MMTS Specs:
http://www.srh.noaa.gov/srh/dad/coop/specs-1.html
This paper estimate error bands:
http://www.eike-klima-energie.eu/uploads/media/E___E_algorithm_error_07-Limburg.pdf
Thanks Gail, understood. Claiming a 95% confidence interval of 0.05C doesn’t make sense if the instrument error could be 10 times greater. Of course, if the CI were “adjusted” to reflect reality, the alarm would vanish.
Where I choke is the idea that averaging large numbers increases confidence applied to temperatures. However with temperature the real sample size is one since the time, location and instrument are all unique.
If I do a chemical analysis 10X on the same batch, I can narrow the confidence. If I do one analysis on ten batches in ten plants in ten different labs over a month’s time, I can not.
Knowing this they fiddle with ‘Anomalies’ how ever it is still one thermometer per reading and even that may change over time as thermometers are replaced so it increases the confidence interval.
I can not see how they have an error of less than 0.5C given all the additive errors in the system.
The math is beyond what I want to do off the top of my head, but it actually is statistically appropriate to increase confidence in the average, as the number of data points increases. Those calculations are the basis of most quality control systems in manufacturing, which is my background. It’s basically the same reason we can predict the prevalence of “heads” in a million coin tosses with far greater accuracy than we can in a single toss. Of course, that entire calculation is based on the underlying assumption that errors will tend to cancel each other out. If measurement error were truly random, in a big enough sampling, confidence would approach 100%. In the case of temperature measurement errors, a clear pattern exists with regard to the claims of error. That pattern negates the underlying assumption. We can accept the claimed adjustments, or we can accept the claimed accuracy. While it’s certainly possible that neither is correct, it’s impossible for both to be. They each invalidate the other.
They for sure adjust the data without explanation. Why should we be surprised that they adjust the error bars the same way? 🙂
The NOAA NCEI global temperature anomaly estimates for this century also diverge from the NOAA NCEP GFS-based CFSR estimates.
https://oz4caster.files.wordpress.com/2015/11/figure-4-21st-century-temperature-trend-ncei.gif
https://oz4caster.files.wordpress.com/2015/11/figure-1-21st-century-temperature-trend-um.gif
Whereas the GFS-based CFSR estimates match fairly well with the UAH satellite estimates.
https://oz4caster.files.wordpress.com/2015/10/figure-5-global-temperature-anomaly-estimates-1979-2015-um-uah.gif