My Climate Forecast From Two Years Ago

I’ll bet the hottest dataset wins the biggest government grant.”

– Dr. Roy Spencer

During March of 2015, I predicted that RSS, under extreme pressure from the climate mafia,  would alter their data to match the fraudulent surface temperature data sets.

Look for the satellite data to be adjusted to bring it into compliance with the fully fraudulent surface temperatures. The Guardian is now working to discredit UAH, so it seems likely that RSS will soon be making big changes – to match the needs of the climate mafia. Bookmark this post.

RSSChanges

This has occurred, exactly as I predicted – and it was announced by surface temperature fraudster Zeke Hausfather, who has no expertise in satellite data.

Climate change sceptics suffer blow as satellite data correction shows 140% faster global warming | The Independent

The only two people who were qualified to review this data tampering by RSS, Dr. Roy Spencer and Dr. John Christy, were not consulted and the changes were not submitted for peer review to them.  This is very severe malfeasance, and standard practice for climate scientists. Their job is to push global warming, not do science.

Here are Dr. Spencer’s predictions from January, 2017.

“I expect there will soon be a revised TLT product from RSS which shows enhanced warming, too.

Here’s what I’m predicting:

1) neither John Christy nor I will be asked to review the paper

2) it will quickly sail through peer review (our UAH V6 paper is still not in print nearly 1 year after submission)

3) it will have many authors, including climate model people and the usual model pundits (e.g. Santer), which will supposedly lend legitimacy to the new data adjustments.

Let’s see how many of my 3 predictions come true.

-Roy”

Roy Spencer’s Prediction | The Deplorable Climate Science Blog

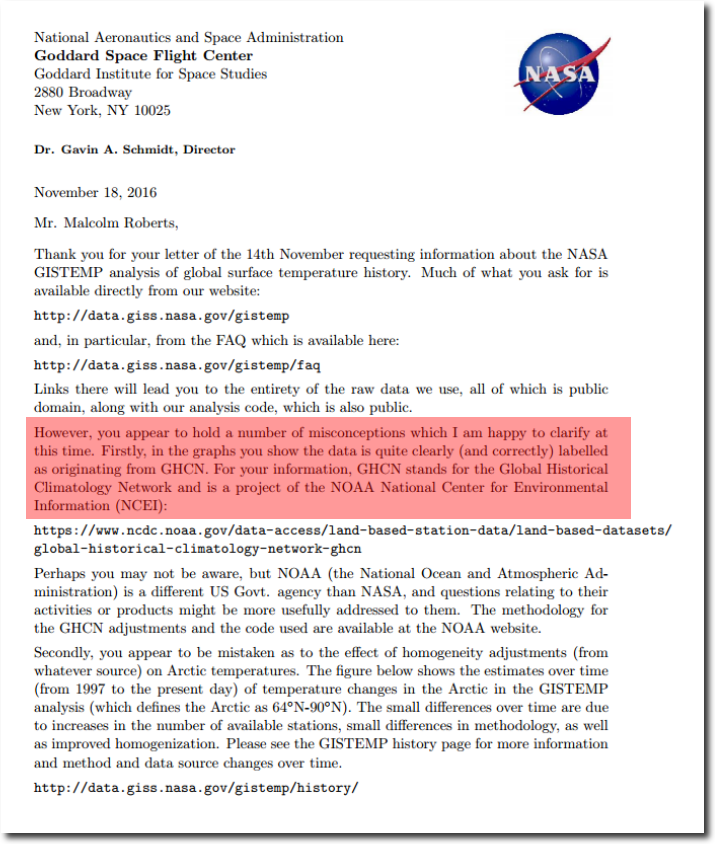
Zeke claimed the data sets are independent, but when called out for fraudulent adjustments by Senator Malcolm Roberts, Gavin Schmidt of NASA stated very clearly last year that the data is from NOAA, not NASA.

robertsnasags.pdf

Zeke is lying about data independence. All of the surface data sets use essentially the same base set of low quality and incomplete stations from NOAA. Berkeley Earth adds more even lower quality stations.

Furthermore, NASA data sets don’t even agree with NASA data sets from a few years ago. Via data tampering, NASA has doubled 1880-1999 warming since the year 2000.

Data.GISS: GISTEMP HISTORY

In 2009, Phil Jones from CRU admitted that much of his global temperature data is fake.

date: Wed Apr 15 14:29:03 2009
from: Phil Jones <p.jones@uea.ac.uk> subject: Re: Fwd: Re: contribution to RealClimate.org
to: Thomas Crowley <thomas.crowley@ed.ac.uk>

Tom,

The issue Ray alludes to is that in addition to the issue
of many more drifters providing measurements over the last
5-10 years, the measurements are coming in from places where
we didn’t have much ship data in the past. For much of the SH between 40 and 60S the normals are mostly made up as there is very little ship data there.

Cheers
Phil

di2.nu/foia/foia2011/mail/2729.txt

NOAA has very little temperature data for much of the Earth’s surface, so they simply make temperatures up. For example, in December they claimed record heat in Africa, based on zero thermometer readings.

NOAA Claimed . NOAA Measured

There were no thermometer readings in the region they claimed record heat. Difficult to imagine how scientific fraud could get any worse than that.

Satellites showed that temperatures in central Africa were close to average in December.

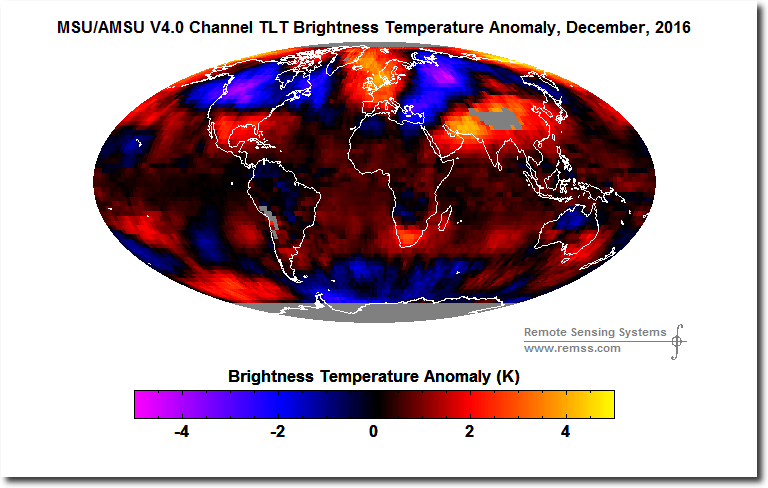
Climate scientists needed to get rid of the satellite data, because it wrecked their multi-billion dollar scam.

Wood for Trees: Interactive Graphs

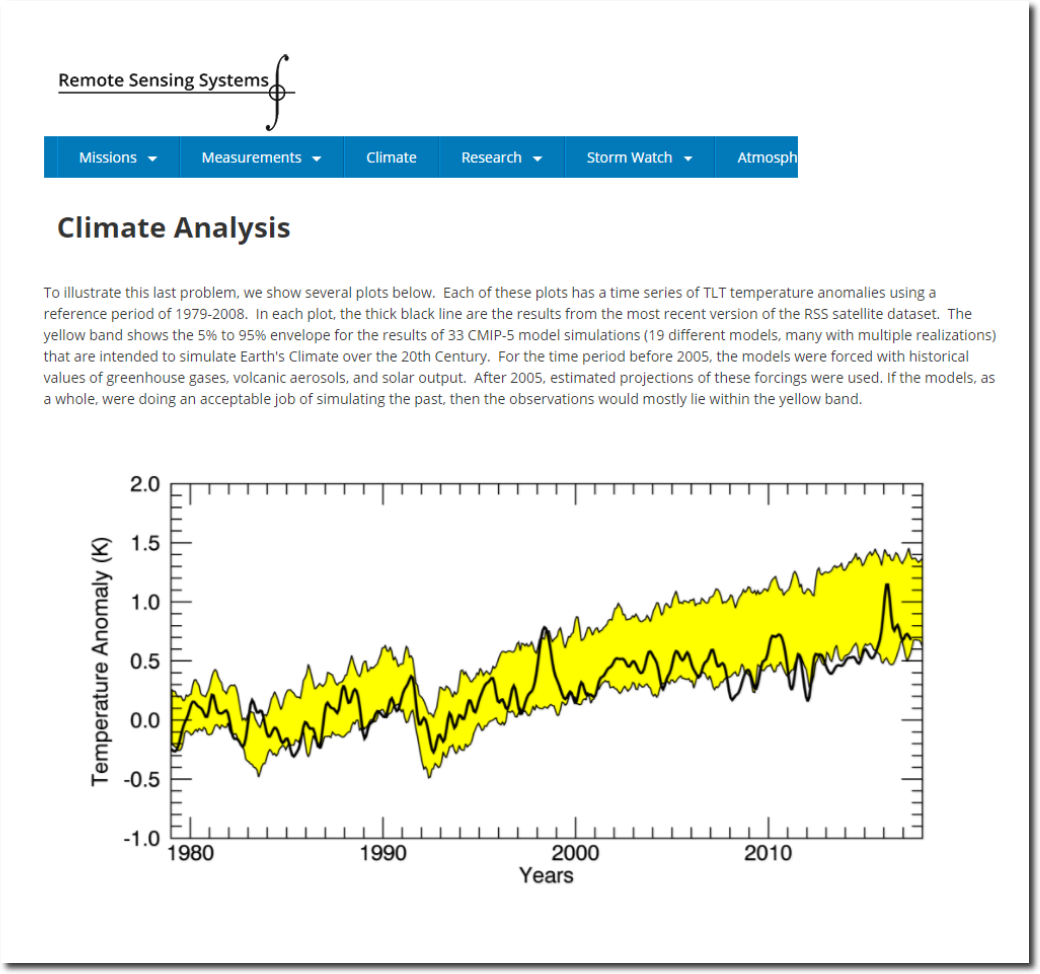
Until a few days ago, RSS stated very clearly that measured troposphere temperatures were outside the range of climate models.

Climate Analysis | Remote Sensing Systems

This was unacceptable to the climate mafia, so they convinced Carl Mears to come into compliance. His new data set is in compliance with the demands of the climate mafia, and protects him from further harassment.

Climate Analysis | Remote Sensing Systems

In December of 2015, Ted Cruz held a Senate hearing about data tampering with the surface temperature record. In this hearing, he pointed out that the surface temperature record did not match satellite temperatures.

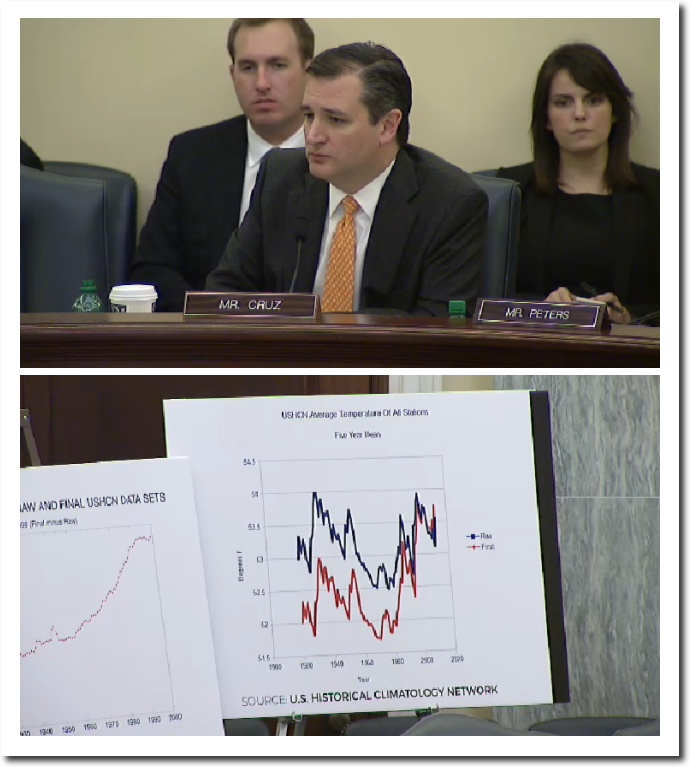
Ever since then, Carl Mears at RSS has been under extreme pressure to corrupt his data and bring it in line with the fraudulent surface temperature data sets. It was inevitable that he would buckle.

This entry was posted in Uncategorized. Bookmark the permalink.

24 Responses to My Climate Forecast From Two Years Ago

  1. arn says:

    People like Mears are the precursors of the Snowflakes that are right now ruining the western world.

    Full of good intentions,100% corrupt,0% integrity
    and no backbone at all- combined with the urge to grab as much money as possible.

    If temperatures would have increased just half as fast as experts lies and data tampering
    planet earth would already be a second sun.
    (we really need graphical statistics that shows how much lies and data manipulation has increased in science scince AGW became the only global truth-than we would see the real hockey stick)

    • AndyG55 says:

      Answering here so this graph is near the top of the thread.

      This shows the sheer audacity of these “adjustments™”

  2. CheshireRed says:

    That Independent headline reveals their real motivation. A normal headline would probably just state that data has been ‘revised’ but not go anywhere near such a dramatic conclusion, which would normally be discussed further into the body of an article. But they know most people don’t read down into copy, rather they just catch the headline instead, hence it is worded as it is. They wanted their anti-sceptic headline and they made sure they got their headline. It will now be rolled out for eons.

  3. CheshireRed says:

    PS. 140% warming? An incredible level of adjustment. It also blows out of the water their repeated claims of ‘settled’ science. Tony has covered many failed predictions but what of their equally poor on-going study conclusions? Time and again we hear that ‘the science is settled’ (but usually it’s used to just avoid debate) only to then be presented with another study claiming that actually ‘it’s worse than previously thought’ after all. Amazing! If the new ‘study’ is correct then all that really does is demonstrate how lousy their previously ‘settled’ science was, thus revealing that even by their own methods the science is never settled!

  4. It is high time that the United States congress men impose upon governmental bureaucracies and agencies the same standards that the government imposes on the industry. The same standards that the industry imposes on their suppliers for all measurements that are of crucial importance.

    ISO/IEC 17025 General requirements for the competence of testing and calibration laboratories is the main ISO standard used by testing and calibration laboratories. In most major countries, ISO/IEC 17025 is the standard for which most labs must hold accreditation in order to be deemed technically competent. In many cases, suppliers and regulatory authorities will not accept test or calibration results from a lab that is not accredited. Originally known as ISO/IEC Guide 25, ISO/IEC 17025 was initially issued by the International Organization for Standardization in 1999.”

    It would also have been interesting to know if the work by Mears et al is based on sound scientific principles or to which extent it is based on subjective judgments.

  5. What gets me is that none of the techniques has changed an iota since Dr Petr Beckmann started Access to Energy after successfully escaping first from National Socialist, then Soviet Socialist Czechoslovakia. The recent whining campaign to reverse the election results was copied from the Soviet propaganda movie “Dawn’s Early Light” wheedling bomber pilots into violating orders to retaliate against–let’s be fair–a nuclear love-pat from the poor, beleaguered Soviet government. Red theology had it that a shortage of initiation of coercive force would cause catastrophic weather even before The Jetsons were aired. It’s really too bad the GOP is so nearly indistinguishable from socialism on every issue except energy.

  6. Steven Fraser says:

    Looking at the graphs side-by-sIde, there is a bit of gaming going on.

    First thing to notice is that the baseline is changed, so that it ends in 2008, when previous was 1984.

    The second thing to notice is that the uncertainty of the RSS values is not represented, the black line is just called. ‘The results’. Based on the position of the plot, it appears to be the center of the uncertainty range, but that is not explicitly stated.

    The third thing to notice is the daterange of the plots. The earlier plot ends at jan1, 2016, and the 2nd one goes out into 2017. The effect of this is to include the bulk of the 2016 El Nino in te 2nd plot. Even with that, the RSS result line has returned to the bottom of the CMIP range.

    My conclusion from these, taken together, is that the impression of increased warming is an artifact of the change in baseline, and the omission of the confidence interval. Without additional information, for example, the absolute temperature of the baseline, the Independent article is just hype.

    • tonyheller says:

      Roy Spencer has confirmed that the claimed increase exists in the new RSS data set.

      • Steven Fraser says:

        Tony,

        Thanks for your reply. I’ve not seen the data, yet, but I have seen the diagrams. IMO, they do not support what RSS claims. Maybe just poor diagrams?

        With the graphing method used, the baseline temperatures of the CMIP5 model outputs have been artificially made colinear with the TSS result baseline. Using this approach, the temp difference between the two in each chart, and chart -to-chart has been obscured.

        I think I will try plotting the RSS results for both chars together, to visualize things better.

    • Steven Fraser says:

      Here is what I was describing in my earlier post, annotated for comparison.
      The earlier chart is on the left, and the new one, on the right. I scaled the charts so that the anomaly degrees match horizontally.

      I direct your attention to blue oval marked 1. It labels the horizontal line which touches the 2 lowest points in the CMIP5 simulations, on both charts, showing that they are at the same anomaly value.

      Next, look at line marked 1a, which labels the upper level of the CMIP sims, which occurred in 2015. Lines marked 2 and 2a (vertically) help to see the calendar crossing point for those 2 high values.

      Line 3 shows 2 values, a) the upper limit of the graph for the high values in 1990 and 1990 and ’91, and the _lower_ limit of the CMIP5 range diagrammed at the crossing lines marked 2 and 2a.

      I think this set of markings, at least on these two diagrams, supports the idea that the CMIP5 plots are equivalent in scope, for ‘area under the curve’ eyeballing.

      With this, though, I must correct my earlier assumption that the ‘Result’ diagrammed most recently (as a single black line) is in the middle of the uncertainty range. A point-by-point comparison of the black line with the error range of the prior chart shows that there is a divergence from the mean in the latter years, with the black line trending upward to what was the upper limit in the prior chart. Even with that, it is interesting to see that the last value on the right hand chart shows the lower end of the CMIP5 range and the RSS result at the same anomaly level.

      I will wait to see the data before making any other comments.

      • Advocatus Diaboli says:

        My non-statistician eyes suggest to me that the temperature “adjustments” mainly involve hiding the range (the blue area), and then giving the top end of the range as *the* temperature for that year.

        Actual statisticians will no doubt have a field day making mincemeat out of this new “method,” and I encourage them to do so. As to whether such critiques make it onto the MSM, that’s another question altogether, unfortunately.

  7. Anon says:

    Because I used to absorbed as truth, whatever the MSM produced, I used to think Ted Cruz was an idiot, neanderthal in the pocket of big oil. Well, it turns out that is completely false. His professor at Harvard Law School, Alan Dershowitz (a Democrat), calls him one of the brightest individuals to ever attend Harvard. Video below:

    https://www.youtube.com/watch?v=sc9rubga1lY

    If he has reason to suspect that the data has been corrupted, he needs to be taken seriously.

  8. Andy says:

    I like the satellite record graph.

    Seems to end on 2014 on a massive spike? Note Antarctic went screwy winter 2015 from large increases in the proceeding years, to lower maximum that year and has not yet recovered. Antarctica 2017 ice extent gain looks shaky still, why?

    Will take some time to work out. Wind was blamed for the rises previously, so will be interested to see if the fall is due to “lack of wind” or rather some huge temp increases.

    I’m guessing the latter from the media :) This is a non trivial problem and cannot be deduced easily.

    One thing you can say though is that the total albedo currently must be less than in previous years when increases in the south parried decreases in the north. Will that actually have a knock on effect?

    Interesting times !

    Andy

  9. GW says:

    Tony, do you have any idea what will be done now to challenge this. This really is a Waterloo moment in the proverbial climate wars, and if not exposed and overturned, sooner not later, the Orwellians will have won. And Trump and his people can only remain in place for so long………

    • rw says:

      But they can’t win. This is the beauty of the AGW hysteria/scam. They can’t go around saying it’s warmer than ever when people are bundling up because of the cold. They’ve trapped themselves into an unsustainable narrative. (But that doesn’t make sites like this any less valuable, putting roadblocks out for the juggernaut, slowing its momentum down a little before it eventually runs out of gas.)

      • GW says:

        I believe you are grossly underestimating the vast numbers of useful idiots perpetuating this garbage, including enough important people like some scientists and many politicians. If this juggernaut is not completely discredited, when democrats eventually regain power all of the worst aspects of control and taxation, Paris Accord or whatever it’s next iteration is, will be jammed down our throats just like Obamacare was, regardless of anything the climate has, is or will do.

  10. RickS says:

    “Temperature Data Tampering” ?

    NASA is a [ FEDERAL AGENCY ] supported by the US Tax payers !

    The last time I checked, the President of the United States is President Donald Trump !!

    Now if the Department of Justice doesn’t immediately “investigate” this lawlessness then I can only conclude that President Donald Trump and His Administration are just as involved in this [ CRAP ] as the previous Administration that lied out its teeth on anything and everything !!!

    Screw the Paris shit, get those here at home who break the Law (Our Laws !) at will, “knowing” that there are “no” repercussions for doing it/this !

    These screw-jobs should be imprisoned (This should have happened by now !) and it seems ever more likely that President Trump is just fine with this which currently makes the Trump Administration just as “lawless” as all of the others and again, what a “waist” of a Vote ??? !

    “Lying Donald”…

  11. As Tony Heller has been telling us for years most of “Climate Science” is fraudulent. The real problem is that the government made absurdly large sums of money available for “Climate Science”. The result was tens of thousands of peer reviewed papers that contain little science in the generally accepted meaning of the word.

    Something similar has happened in public education where no matter how many research studies are done nothing useful emerges. While there are many research topics relating to K-12 education here are some interesting statistics on one of them.

    K-12 READING INSTRUCTION IN THE USA
    The National Reading Panel (NRP) carried out a comprehensive review of reading research that amounted to 115,000 papers written between 1966 and 2000. A screening was carried out to select only studies that met criteria “….normally used in medical and behavioral research…” At the end of the screening, only 428 studies met the panel’s high standards, and in September 2000 the findings were presented to the US Congress.

    Thus the panel found that only 0.37% of the studies met generally accepted standards for scientific research.

    The 14-member reading panel was chaired by Donald N. Langenberg, chancellor of the University System of Maryland. Karin Chenoweth (Washington Post) asked him why he, an experimental physicist by training, was chosen. One of the reasons, he said, was, “I know what good research looks like.”

    That answer is the key to winnowing the chaff of “Climate Science” with the aim of extracting the few grains of real science buried within it. Thus I would contend that there is no need to spend another taxpayer dollar on new research studies until we have extracted the few grains of gold buried in the heap of excrement called “Climate Science”.

  12. Steven Fraser says:

    There was an illuminating interview with Mears over at Carbon Brief about this, with direct comparison chats, and descriptions of the things chosen to go into the adjustments. Two of them stuck out to me:

    1) to deal with Time of Observation differences, they interpolated values using General Circulation models, to estimate what the temps would have been if observed at the same time.

    2) According to them, Data from some of the satellites was at some point determined to be ‘outlier’, so was not included.

    More later.

  13. Bob Grise says:

    they can lie and cheat all they want but what they can’t do is change the temperature and temps have been cool where I live this May and June. My furnace runs almost every early morning in central Minnesota. Hard to win people over when Mother nature won’t cooperate. A rare (for this year) 90 degree day was forecast for this coming Saturday. New forecast says maybe 80.

  14. Kyle_Fouro says:

    Is it me or has the skeptic community been unacceptably silent about this?

  15. John Niclasen says:

    Notice they also changed the range in latitude.

    v3.3:
    “Global (80S to 80N) Mean TLT Anomaly plotted as a function of time.”

    v4.0:
    “Global (70S to 80N) Mean TLT Anomaly plotted as a function of time.”

    Yet the model output to compare with is exactly the same:
    “The yellow band is the 5% to 95% range of output from CMIP-5 climate simulations.”

  16. Great web site. Lots of useful info here. I am sending it to some friends ans also sharing in delicious. And certainly, thanks for your sweat!

Leave a Reply

Your email address will not be published. Required fields are marked *