
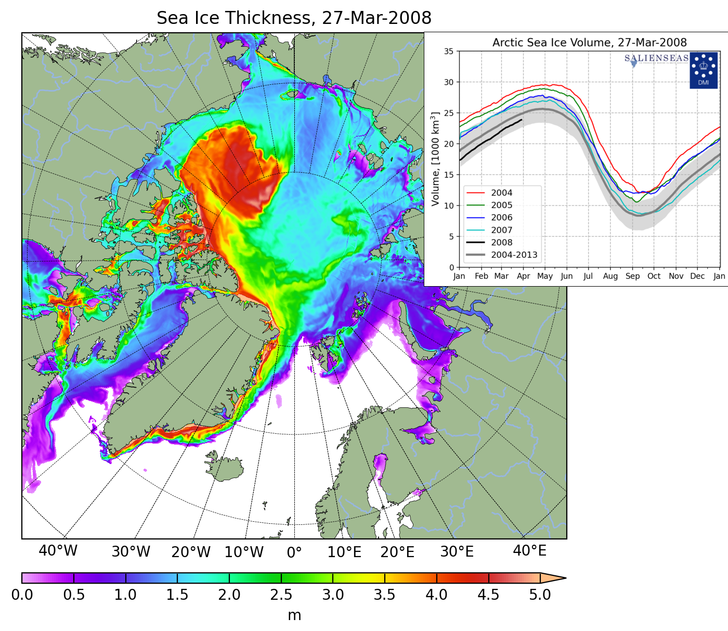
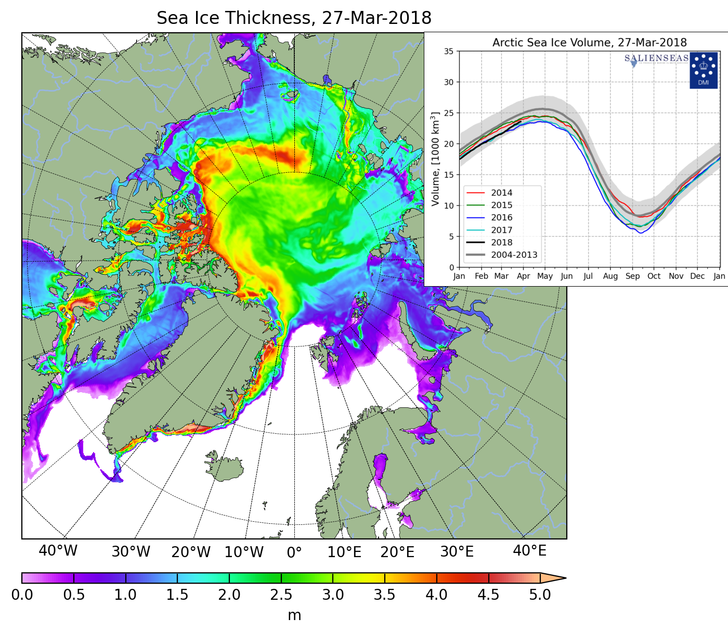
According to the Danish Meteorological Institute, Arctic sea ice volume is growing rapidly, normal and the highest in several years.
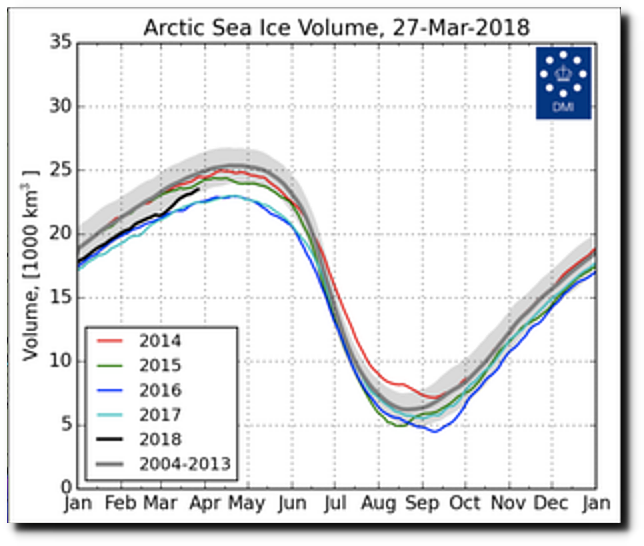
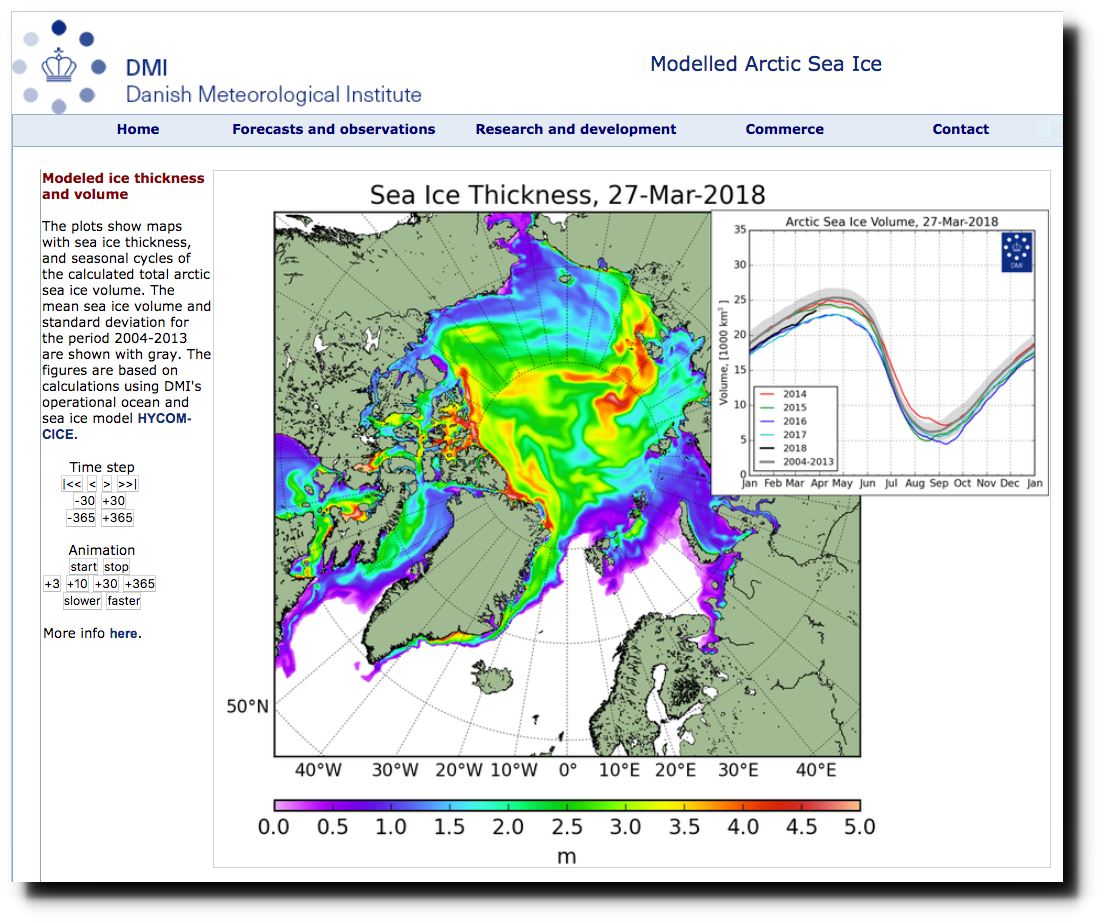
The extent of thick ice has doubled over the last ten years.
This is of course the exact opposite of what fraudsters at National Geographic and Newsweek are claiming.
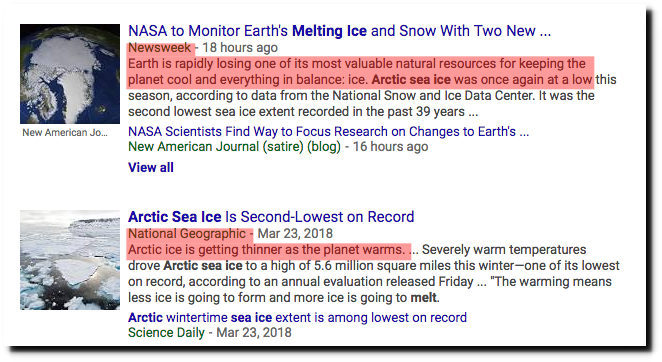
For people on the political left, facts, science and data are simply not important. Apparently it is OK for them to simply make things up.
