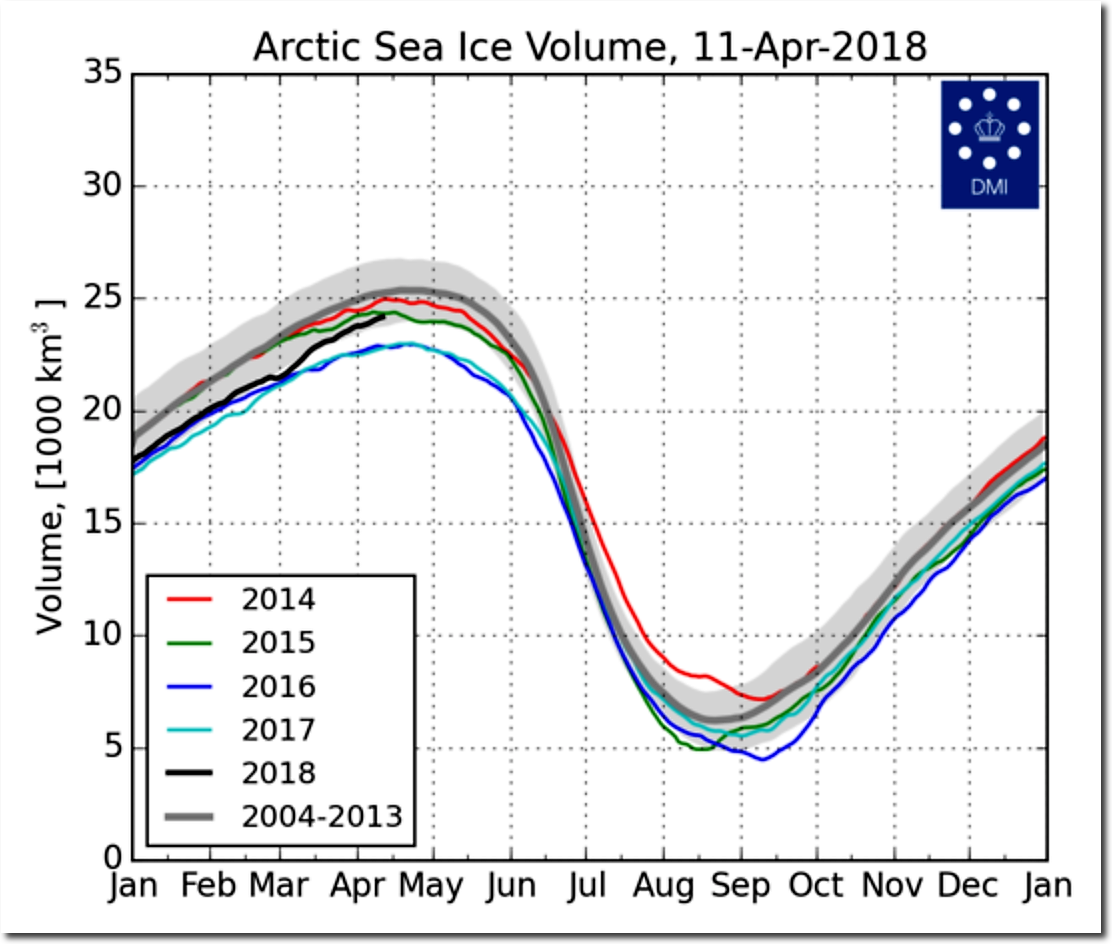
Experts say the Arctic is hot and melting. Actual data says they are lying.
Email Subscribe
Disrupting the Borg is expensive and time consuming!
-
Recent Posts
Recent Comments
- Jerry L Kreps on February Data Tampering So Far
- mddwave on Vaccine Effectiveness
- Gordon Vigurs on February Data Tampering So Far
- Vegieman on New Video : How The 2020 Election Was Hacked
- Vegieman on How The 2020 Election Was Hacked
Archives
- February 2021
- January 2021
- December 2020
- November 2020
- October 2020
- September 2020
- August 2020
- July 2020
- June 2020
- May 2020
- April 2020
- March 2020
- February 2020
- January 2020
- December 2019
- November 2019
- October 2019
- September 2019
- August 2019
- July 2019
- June 2019
- May 2019
- April 2019
- March 2019
- February 2019
- January 2019
- December 2018
- November 2018
- October 2018
- September 2018
- August 2018
- July 2018
- June 2018
- May 2018
- April 2018
- March 2018
- February 2018
- January 2018
- December 2017
- November 2017
- October 2017
- September 2017
- August 2017
- July 2017
- June 2017
- May 2017
- April 2017
- March 2017
- February 2017
- January 2017
- December 2016
- November 2016
- October 2016
- September 2016
- August 2016
- July 2016
- June 2016
- May 2016
- April 2016
- March 2016
- February 2016
- January 2016
- December 2015
- November 2015
- October 2015
- September 2015
- August 2015
- July 2015
- June 2015
- May 2015
- March 2015
- January 2015
The sea ice volume grows to reach a maximum every year at some point in april… so yes, at this point in the year it is ‘growing’.
but what it is not going to do is reach a maximum volume which is higher up the list of maximums than second lowest (third in DMI charts).
The volume is NOT growing year-on-year. It is declining… it is among the lowest volumes for this point in the year ever recorded.
So what? Who died?
And what kind of idiot ignore the rest of the 4,500,000,960 years of Arctic ice?
This is a nonissue, unlike the millions of innocent humans you alarmists snuff out annually.
Don’t be so rude to her.
This winter has been really hard and arctic ice is the last straw to grasp for zealott agw follower.
The good thing is:no matter what stupidity they claim
she will believe it.
This started with Michael Manns utter ridicoulous tree ring climate fortune telling and continues today with:
It’s superhot anywhere except the place our critics live
and the arctic ice that should have stopped existing years ago according to experts and will continue to do so for the next centuries((but it is superhot and melting right now because the supercold 1979(TM) anomaly was sold to us as new normal))
Correcting an evil, errant, and willfully ignorant child is not being rude.
And considering it was just back in the 1930’s, when by any common record available between then and now, it was much warmer then. Just a part of that normal 60 year cycle which is also apparent in the Central England Temperature record, which is the longest continuous record of weather in the world.
Pulling out a useless comparison to the coldest period of time in the past 120 years, which just happens to be about 30 to 40 years ago, is really only effective when talking to uniformed people who have been conditioned to salivate when ever someone yells “tax the rich!” or “save the amoeba” or “fossil fuels bad!” or whatever socialist / communist / SJW / Progressive / Greenie blah blah bumper sticker thought provoker is vomited forth.
So the volume is not growing year on year, but it is higher than 2016 and higher than 2017. It is inside one standard deviation from the mean (hand picked to be deceptively large), but it is among the lowest volumes ever recorded.
Got it.
The std d is not “hand picked”; the graph posted is what is published on the Danish Meteorological Institute’s website. Further, the arctic ice volume is no different than it was 60 years ago as Tony explained in an earlier post.
‘almost the lowest’ – nice weasel words for ‘entirely withing expectation and of no concern whatsoever to any sane logical scientific inquiring person who has no ideological agenda to foist on the rest of the world’.
It is declining…
Only if someone is stupid enough to only look at the unstable extremes…
July says there ain’t much going on.
Griff:
You wrote some things that are not consistent from the DMI reports:
1) Sea ice does not always peak in April. In 2007, it peaked on May 7. in 2008, it peaked on May 5. FYI, the earliest peak was April 7, 2015, and the latest peak was May 7, 2007. (pending the 2018 peak)
2) Using DMI numeric values (not the graph,) 2018 is currently 11th of 16 on the peak list, and still growing. There are 4 years whose peak sea ice was lower than 2018 already is. At the moment, 2018 is 203 cu km below the next higher year, 2008.
3) As to year-on-year, 2018 already has 24,169 cu km. 2017 had 22,997. 2016 had 22,966. So, over the 2 year span, max ice grew by 1,203 cu km, to be revised upward as 2018 ice continues to grow. Percentage-wise, 2018 is now at 96.7% of the average max value, with the max not necessarily yet reached.
What it is, is cyclical. Volume is the same as in 2008—ten years ago—despite ~20% of ALL CO2 emissions, ever, having been released during that time.
Ice goes up, ice goes down. Life goes on, as it always has on this planet since it first began.
DMI doesn’t agree with you, Griff.
Urbanite ice worshippers like Ms Griff love the idea of glaciated Earth. Given the cyclical nature of warming and cooling within the current ice age we are likely approaching the end of this interglacial but she thinks that expanding polar ice is an “improvement”.
Can someone suggest more polite terms for stupid and evil?
Ms Griff, or Genocide Jim.
Yep, little ms griff thinks the world should be a freezer.
I mean WTF do you think is going to happen after the COLDEST 500 or years in 10,000 years.
Either its going to warm up a bit, and become habitable again, with all the huge benefits that brings, or it going to stay cold with all the attendant misery..
Why do people like griff and jimbo HATE the world so much that they wish misery and hardship on everyone.
I think it mostly comes from HATING THEMSELVES, which they try to cover over with their baseless arrogant egotism.
Hey Andy, “I think it mostly comes from HATING THEMSELVES.”
I have some friends who are under the CAGW spell, and I have spent some time wondering about the “why do they believe this stuff?” Rather obviously, they were not convinced by looking at the actual data. What I have seen is this: most of the people I know who believe in the CAGW meme also have major problems in their personal life. Maybe it is being out of work, care taking ill parents, bad marriage, whatever. They feel bad, who wouldn’t? But rather than face their real life problems, they can ignore the actual source of their pain and blame it on CAGW. That relieves them from making hard choices and difficult efforts. They can tell themselves that they are not sad because of their marriage, no, they are sad because of CAGW!
Just call such people “atoms” — they make up everything.
Except for that tiny blip in early March, Arctic Sea Ice Volume has been “average” (and DMI uses 2SD for average) since mid-June.
I think some of you guys are pathetic. Its not because the arctic is stabelising we are going to a colder period. Here in belgium next week 25 degrees celcius (80 degrees fahrenheit.
Warm days are climate. Cold days are weather
I call either cold or hot days weather, i dont follow those climate scientist bullshit. The point is that we have to look beyond the cold anomaly’s. Next week we are gonna break all time warm records.
Who is “we”? Where I live “we” have been running about 25F below average, it has been the coldest Spring on record.
All of Europe is getting a good taste of spring next week with records being broken. Global tempature is still slightly positive.
Slightly positive as compared to what?
Gator, same here where I live. We are running 25+ degrees below average. The lakes in the northwoods have 2 feet of ice right now and opening weekend for fishing is 3 weeks away. The lakes were open last year at this time. This “weather” really sucks! I would do anything for the “climate” that Brad has.
https://www.wunderground.com/forecast/us/wi/mercer?cm_ven=localwx_10day
You are running dangerously close to hitting upon why the very concept of constructing a Global Average Temperature much less using it to establish a 1.5° rise in temperature has occurred over any time span is actually pretty stupid. Because the world is not a giant black frying pan sitting under a heat lamp. We have no freaking clue what the temperature is right now, right this very second, across every surface or through every volume. There isn’t a trend, there are many trends. And we don’t have handles on any of them, much less all of them. It is all foolishness.
I have downloaded a bunch of data from many different stations in Greenland going back over 100 years. I would defy anyone to come up with a trend line which would accurately define what has occurred in Greenland just between the different monitoring locations to within ±3°.
At best, all you could possibly define would be a probability zone. As in we are confident within 90% the average temperature in 1945 fell in this zone. The width of that zone is greater than the trend difference by at least a factor of 3.
And you would have to admit you can’t even accurately estimate what the magnitude of that variability would really be over the vast majority of the surface area of Greenland because your data points are limited in number, limited in area covered, and limited in the type of terrain. Plus, the variability between sites even within that very limited coverage of the entire area is very large.
And that is just land based temperatures in Greenland. Project those issues outward to cover the entire world.
And these idiots who foster this crap know this. They effing know it. How could they not?
Mark Fife, bravo! Absolutely the best rant on the true status of climate reporting! I salute your wisdom.
Jet stream related. There’s a giant loop from the south pushing warm air up from the same latitude as Morocco. Currently the loop is just east of Newfoundland. The jet stream is going all the way from North Carolina to the northern tip of Greenland.
You can see the jet stream maps here:
CRWS Jet Stream Map Menu
Such big loops in the jet stream are characteristic of low solar activity. The Sun is currently at solar minimum. Last time it was in this phase of the solar cycle, in 2009-10, there were similar alternations of hot and cold – such as the enormous Moscow heat wave of 2010.
My Paris forecast says the highest high next week in Paris will be 78F. That’s a warm record? I doubt it.
For us it will be between 77/86 fahrenheit what is never seen before from the measurements since 1901.
I imagine this may bring the travesty of people wearing shorts. In any case, the probability for a long term weather record for a date to be set anywhere is on the order of 1%, a small but significant chance.
the travesty of people wearing shorts
Yeah, but it could always get worse …
When exactly ? And where does the warm air come from ?
https://www.windy.com/50.847/4.352?rain,50.127,5.349,7
https://earth.nullschool.net/#2018/04/17/1200Z/wind/isobaric/850hPa/orthographic=-1.66,28.20,435/loc=22.858,30.019
Don’t forget that the sun on the 21st of april is as high above the horizon as on the 21st of august.
I cant wait for summer, i hope it hits on a weekend.
Expecting a foot of Global Warming in Minneapolis this weekend. Ugh.
From a high pressure filled with warm air, records will shatter next week for belgium and the netherlands, hottest april could be surpassed and even that one was in 2007. Hottest years all in 21 century.
Still don’t get it, do you Skippy?
So what? Where I live we are having the coldest Soring on record, coldest since we started keeping records.
http://www.catalannews.com/business/item/ski-resorts-coming-to-end-of-very-good-season
One Catalan ski resort has decided to buck the trend, and will not be closing its slopes this Sunday. La Masella resort will remain in operation until May 1. As for the rest, this Sunday will be the final day before the ski season ends for another year, and preparations for summer activities get underway.
It is climate science that is really Pathetic mate, they churn out garbage climate predictions because they ignore the Nyquist principle, by analyzing too shorter time frames, but hey they are Climate Scientists they don’t take any notice of engineers, nor any other branch of science for that matter. To have valid projections climatic variations need to be studied in centuries not bleeding years or decades!
Hot in Belgium next week, so what! we have just had an unseasonably early winter storm so what does that mean? Just as above, it means very little. When you have been alive on this earth longer than 60 years you understand that climate is an ever changing thing and sadly the ones falling prey to the climate clown show are the gullible and young.
The southern polar vortex took a long time to settle this past summer, it kept flicking icy Antarctic air up our way, and it seems to be back early with a vengeance, it appears to have an increasing hysteresis in its cyclonic effects on our weather.
https://www.radionz.co.nz/news/national/354677/very-unusual-april-snowfall-surprises-southerners
Does that look cold to you? Grey line is normal average tempature, green line is what its at now. Blue is minimum and red maximum tempature.
Germany is having weather event,
Happens when the Jet stream is wobbly !!
Jet stream is weakening because of the warming.
Proof please. This is not what scientists said about the loopy jet stream in the 1970’s during the ice age scare.
“Jet stream is weakening because of the warming.”
What a load of RUBBISH !!
Where the *** are you picking up all this fantasy crap.?
Andy, cold air at the northern hemisphere and warm at the equator enchance a zonal flow called westerlies. If it gets warmer at the north pole ( present) the difference becomes less and so it slows the westerlies. Basic science this but looks like you are clueless not even knowing this…
Brad,
25C is not 80 Fahrenheit. At least get the basic facts correct.
No its not but next week we aim for that, an all time april record.
So what? It has been warmer in the past.
Its at the rate we are warming what is worrying.
Brad whines “Its at the rate we are warming what is worrying.”
In case Brad has not noticed, Tony posts day after day, week after week, month after month, and year after year, evidence that the supposed ‘warming’ is all a lie and that if anything we are presently ‘cooling’.
Bullshit, again.
The recent warming rate is identical to late 19th century warming.
‘Its at the rate we are warming what is worrying.’
Yep. A few days ago it was much colder.
Who are your parents ? Ms Griff, and Genocide Jim ?
How old are you Brad ?
That’s not hot. I’d like a Playboy bunny to bring me a beer, but let’s wait to see if it happens. I think that maybe only a feminist or jealous wife would complain about it.
Neal, so all the scientist are lying then? I think i stick with people know what there talking about. Those graphs you guys show all the time could be selfmade.
Again, where do you get this all scientists BS little fella?
All the graphs I show are self made from the very same data sets they use. So? I am a degreed mathematician with 30 years experience in Quality Engineering. I have spent years running statistical processes to measure and monitor variability in manufacturing. This type of statistics is my bread and butter. My graphs are 100% accurate to what the data says.
Hadn’t really noticed this before, but the annual peak of Arctic sea ice volume looks to be middle to late April, while the annual peak of the sea ice extent is much earlier – perhaps more like the first couple of weeks in March. Anyone know the explanation?
The southern edges start melting much earlier since the edges at the end of winter are quite far south ie not even really arctic any longer. The volume growth is occurring in the high arctic were it is still -25 to -30C.
Oh come on – that’s too logical. Thanks much.
I personally think the ice volume has reached his maximum this year and will come to a stall. Much better then 2016 and 2017 but one year doesnt say anything. If 2019 have the same increase then i would say the arctic is in a recovery.
That would be bad news.
Ok northpole can melt but if greenland melts millions will be killed. So i doubt that would be good.
Are you totally clueless how much heat would be needed to melt the Greenland ice sheet or are you just emoting a bit for a good cause?
This is what progressive education has done with our kids. What you hear is the new Hitler/Mao/Stalin Jugend and indeed millions were killed because of that.
1010 no pressure
https://youtu.be/ZkPQU3UDBM0
Climate Change Bedtime Story
Were on a good way on melting greenland ice in a rate never seen before. Normally it takes hundreds of years now its in less than 100 years.
“… melting greenland … in less than 100 years”
Bless your heart, Ms Brad, you are a gift that keeps on giving.
Why ?
Who is unable to outrun rising seas? Stupid much?
Alarmists are already responsible for hundreds of millions of unnecessary deaths.
Why millions will be killed?
Sea levels rising
(On correct reply this time)
Who is unable to outrun rising seas? Stupid much?
Alarmists are already responsible for hundreds of millions of unnecessary deaths.
“Sea levels rising”
At less than 2mm a year.
Quick PANIC
Run and hide !!!
You are a mindless idiot, Drad.
2000 µm annual sea level rise tsunami!
Run, I say, run for you life!
If greenland and antartic ice melts ocean will rise and many will be killed by the flooding.
Still not getting it, are you Brad. How old are you?
Brad, please don’t have children !
Greenland Total Ice MAss since 1900.
You have some LEARNING to do Brad.
You have listened to too, and been taken in by too many AGW propagandists.
Why is the dmi model than saying greenland ice sheet is unstable and losing mass every year?
Funding.
“Why is the dmi model than saying greenland ice sheet is unstable “
Its not.
It is saying it, you guys only cherry pick data. Greenland ice sheet is unstable and melting more and more every year.
Brad, see graph above, and don’t be shy about asking for help when you fail to grasp it yet again.
From the dmi site where you can track the ice sheet: Satellite observations over the last decade show that the ice sheet is not in balance. The calving loss is greater than the gain from surface mass balance, and Greenland is losing mass at about 200 Gt/yr. you guys are lying.
Which satellite observations little buddy? Do you know?
So satellite mausurements from global temps are correct but for the greenland ice it should be incorrect? This proves once again u cherry pick data. Still in denying mode…
So the answer is a resounding “no”.
Thanks for once again demonstrating your utter and complete ignorance of our climate, and our observations of it.
This is the data from the longest running station in Greenland from the GHCN dataset. That data set shows the daily maximums and the daily minimums. As you can see temperature has fluctuated up and down. The 1930’s warming is well documented historically.
Yet, for some reason this never makes those graphs you are seeing. Most of them start in 1979 for one thing. Or they adjust it out. But it is beyond doubt the 1930’s warm period did happen. This is the actual record from that station.
So, you have two questions to ask. Why do they start their graphs right in the middle of what was the coldest period in the past 100 years? Why are they erasing the warmest or at least the second warmest period in the last 100 years?
The answer to both is a resounding they are lying.
Tasiilaq is on the south eastern Coast of Greenland adjacent to Iceland. In case you are curious. You can view it on Google maps.
Of course I am just some mathematician and Quality Engineer on the internet. But, you can duplicate my information precisely. Go here to the Berkeley Earth Website. Pull the GHCN daily data and look for station 91989. The data comes in a text file, but you can copy and paste it into Excel. I grab the data using a SQL database which works much faster. If you are adept at doing that I recommend it.
http://berkeleyearth.org/source-files/
Also, you need to realise that Greenland ice mass is pretty much at its HIGHEST area in 98000+ years, just a tiny amount down from the EXTREME COLD of the LIA anomaly.
oops 8000 years, not 98000 years. !! DOH! :-)
sorry for all the typos, hit my typing finger with a hammer today. :-(
Some like it hot
https://youtu.be/A7cOwMxis5c
There will be no Arctic recovery until all the ice is gone.
Maybe gators will return too.
i would say the arctic is in a recovery….
Climate alarmist wordsmithing
No Be=rad, you are looking at it from the wrong perspective.
The level in the late 1970s was actually anomalously high, up there with the extremes of the Little Ice Age
During the first 8000-9000 years of the Holocene there was MUCH less sea ice.
The slight drop since the late 1970s peak is actually the RECOVERY to more normal sea ice extents. Even now it is still higher than it has been for 90%+ of the last 10,000 years.
CO2 isnt destroying our planet, american media is all fake news about arctic melting but we need to change. Methane is the biggest drive on global warming, we need to eat less meat.
Try telling most Aussie to eat less meat, see how far it gets you :-)
No, methane is not an issue either.
Its atmospheric residence time is minimal, and the atmosphere is regulated by the pressure temperature gradient.
Termites produce FAR more than humans or human livestock do.
Methane oxidises in the atmosphere, which is why it plateaued at about 1730 ppb in 2006. Since then the massive increase in fracking has caused it to slowly rise again. Once the shale gas boom slows down it will plateau again as release rate = oxidation rate.
On top of that the ECS for CO2 of <1 C/doubling also applies to methane for the same climatic reason. SSo methane is just as harmless as CO2.
As for meat that is a matter of conscience not science. The green revolution is providing food for everyone, if only governments allow it to get to people.
Go for it dude. God bless you if more people thought like that I could finally afford more meat for myself. Also having children is very carbon intensive so don’t have any.
True, i wont have any children because we are with too many on the planet, it takes it toll now as we see the planet warming.
True, i wont have any children…
I just love a self correcting gene pool!
Actually , he’ll probably end up with a whole herd of brainless twerps to follow in his footsteps.
The 1970s were indeed cold but you cant deny since then we have been warming.
So what? The Earth is constantly either cooling or warming. Just as the Sun sets and rises.
The warming is not in a natural rate. Normally it takes hundreds of years to warm as we do now in 40 years.
Bullshit.
The recent warming rate is identical to late 19th century warming.
“The warming is not in a natural rate.”
Gees you have quaffed unthinkingly at the climate change kool-aide, haven’t you Brad.
Hint, basically every comment you have made is PROVABLE WRONG.
There has actually been ZERO warming apart from 3 El Nino burps, (solar energy )
Between 1980 and 1997.. NO WARMING
And from 2001- 2015 NO WARMING.
Yes, the warming in the surface data HAS been totally unnatural.. tantamount to FRAUD.
Dansgaard–Oeschger would say that Brad is very ignorant.
“The 1970s were indeed cold but you cant deny since then we have been warming.”
Also been the strongest series of solar peaks since the MWP.
But the warming has been minimal, and only occurring through ocean releases.
Well, the DMI arctic temp is just a smidge above average at -20C. We will see what the next few days bring.
Brad:
Sorry, 0412 gained 31 cu km… still rising.
Still alot less then a couple weeks ago. Melting will begin soon.
Good. Ice kills.
“Still a lot less then a couple weeks ago.”
TOTAL and ABSOLUTE BS, Brad.
Stop making up LIES that are so provably WRONG.
I mean the gain is alot less than in march. In a couple of days the arctic will get warm air injected so its not gonna surpass early 2000 lines.
So is this your excuse for starving millions to death?
These were the bad projects. As you might see the bottom of the list was climate change. This offends a lot of people, and that’s probably one of the things where people will say I shouldn’t come back, either. And I’d like to talk about that, because that’s really curious. Why is it it came up? And I’ll actually also try to get back to this because it’s probably one of the things that we’ll disagree with on the list that you wrote down.
The reason why they came up with saying that Kyoto — or doing something more than Kyoto — is a bad deal is simply because it’s very inefficient. It’s not saying that global warming is not happening. It’s not saying that it’s not a big problem. But it’s saying that what we can do about it is very little, at a very high cost. What they basically show us, the average of all macroeconomic models, is that Kyoto, if everyone agreed, would cost about 150 billion dollars a year. That’s a substantial amount of money. That’s two to three times the global development aid that we give the Third World every year. Yet it would do very little good. All models show it will postpone warming for about six years in 2100. So the guy in Bangladesh who gets a flood in 2100 can wait until 2106. Which is a little good, but not very much good. So the idea here really is to say, well, we’ve spent a lot of money doing a little good.
And just to give you a sense of reference, the U.N. actually estimate that for half that amount, for about 75 billion dollars a year, we could solve all major basic problems in the world. We could give clean drinking water, sanitation, basic healthcare and education to every single human being on the planet. So we have to ask ourselves, do we want to spend twice the amount on doing very little good? Or half the amount on doing an amazing amount of good? And that is really why it becomes a bad project. It’s not to say that if we had all the money in the world, we wouldn’t want to do it. But it’s to say, when we don’t, it’s just simply not our first priority.
http://www.ted.com/talks/bjorn_lomborg_sets_global_priorities/transcript?language=en
https://www.youtube.com/watch?v=Dtbn9zBfJSs
Brad doesn’t know a lot.
Hah the volume stalled as i predicted! Melting will start and will get out of the 2004/2013 zone at the dmi chart.
You predicted? LOL
Kids say the darndest things…
“I mean the gain is a lot less than in march.”
OMG you really a base-level IDIOT !
Its coming into spring up there. The sun will soon actually get above the horizon.
Of course the growth is slowing down
Meanwhile, temperature pattern not much different from 1976.
And of course melting will begin soon.
Its called spring then summer. !!
FFS, how old are you , Brad? 12, 13?
Every year either the volume or extent declines at rapid rate. How can that be natural?
Because it has happened many times before.
Please study the Earth’s history, and then come back and make educated comments.
“How can that be natural?”
Every year has SEASONS , you moron !!
Have you never experience summer, autumn, winter and spring ???
Summer, NH gets a bit warmer, so sea ice decreases.
Gees, its like trying to explain to a 2 year old !!
”Every year either the volume or extent of the Laurentide ice sheet declines,” declared the spokesman of the Clovis Liberation Front. “How can that be natural?”
“It’s been here since the beginning of time and through the whole history of the Clovis people!”
No you come to the wrong conclusion. I ment that the arctic is melting every year more and more in the year cycle.
So what if it is? There is currently more ice in the Arctic than the average of the past 9000 years.
The Earth did not form in 1979.
“No you come to the wrong conclusion. The Laurentide is melting every year more and more in the year cycle,” said the spokesperson of the Clovis People Against Holocene Oppression.
“I ment that the arctic is melting every year more and more in the year cycle.”
Except its NOT !
Brad, you are badly mis-informed about basically EVERYTHING.
And basically a mindless brain-washed idiot !
“And basically a mindless brain-washed idiot !”
I was Brad once. Then I researched the links and data presented by people like you. It took me three years to be completely deprogrammed.
To admit that I was a useful idiot was a hard pill to swallow. Deprogramming/disillusionment is a tough row to hoe.
Plants tell us what is going on:
In central Washington State, wine grape vines are showing swelling buds, but no tiny green leaves. The cuts did show “weeping” (aka bleeding) more so today, but this is late also.
I’ve only been helping with pruning for about 5 years.
Each of the past 4 years we found true green leaves by early April.
Wednesday morning there was ice on my windshield.
Seems to me there are 2 things wrong about global warming.
It is not global and it’s not warming.
Here a cosy 80 fahrenheit next week. Its not global but in europe the hottest years were almost all in 21 century.
You mean hottest in 18 years. (Yawn)
The gulfstream at northeast america is hot and cold at greenland, that type of warming we see in the gulfstream slows down trade winds and enchance warming.
Good. Cooling is bad, warming is good.
Just in case anybody here is interested the graph at the top is not “Actual data”.
It’s actually the output of an actual model.
Models do not produce data, they produce artifacts of analysis and projections.
Why do you hate poor brown people?
These were the bad projects. As you might see the bottom of the list was climate change. This offends a lot of people, and that’s probably one of the things where people will say I shouldn’t come back, either. And I’d like to talk about that, because that’s really curious. Why is it it came up? And I’ll actually also try to get back to this because it’s probably one of the things that we’ll disagree with on the list that you wrote down.
The reason why they came up with saying that Kyoto — or doing something more than Kyoto — is a bad deal is simply because it’s very inefficient. It’s not saying that global warming is not happening. It’s not saying that it’s not a big problem. But it’s saying that what we can do about it is very little, at a very high cost. What they basically show us, the average of all macroeconomic models, is that Kyoto, if everyone agreed, would cost about 150 billion dollars a year. That’s a substantial amount of money. That’s two to three times the global development aid that we give the Third World every year. Yet it would do very little good. All models show it will postpone warming for about six years in 2100. So the guy in Bangladesh who gets a flood in 2100 can wait until 2106. Which is a little good, but not very much good. So the idea here really is to say, well, we’ve spent a lot of money doing a little good.
And just to give you a sense of reference, the U.N. actually estimate that for half that amount, for about 75 billion dollars a year, we could solve all major basic problems in the world. We could give clean drinking water, sanitation, basic healthcare and education to every single human being on the planet. So we have to ask ourselves, do we want to spend twice the amount on doing very little good? Or half the amount on doing an amazing amount of good? And that is really why it becomes a bad project. It’s not to say that if we had all the money in the world, we wouldn’t want to do it. But it’s to say, when we don’t, it’s just simply not our first priority.
http://www.ted.com/talks/bjorn_lomborg_sets_global_priorities/transcript?language=en
https://www.youtube.com/watch?v=Dtbn9zBfJSs
Look at piomas, even they say there was record volume increase in march, keep bury your head in the sand.
Piomass is a model load of nonsense
You are still ignorant about this graph, aren’t you , Brad
Are you even out of primary school yet ???
If PIOMAS is “a model load of nonsense” then surely the same applies to DMI’s model output proudly displayed at the top of this page?
I suggest you try learmning a bit of climate history, Brad
or just learning something.. ANYTHING
Current Greenland ice area is only a tiny bit down from its LARGEST extent in over 8000 years.
I realise it is basically pointless putting FACTS in front of you.
You don’t have the ability to comprehend them.
What if i said your graphs could be made up?
All graphs are made up child. How old are you?
Hi, all.
I’ve added yesterday’s DMI ice volume to my local spreadsheets, and it is up by 7 cu km from yesterday. Since the next highest year (2013) for that date is already falling, the gap has narrowed to 35 cu km.
When comparing ice volume maxes, 2018 is still #12 of the 16 years. 2008 is the next higher max year. When comparing ice volume for the day-of-year, #11.
I’ve done some comparisons of ‘growth seasons’, by using the low level of one year with the high of the next, and calculating the growth in cu km of ice, and comparing with the average.
The 2017-2018 growth is in the middle of the pack, at (so far) 18,681 cu km, putting it at #9 of the 15 growth years. The highest growth year was 2003-2004, with 21,644 cu km, and the lowest growth year was 2014-2015, with 17,245. The average growth year was 18,926, putting this year (so far) at 98.66% of average growth. For comparison, the highest growth year was 114.36% of average, and the lowest was 91.19%
Since the growth years do not start at the same level (due to the melt phase,) I compared the years by the low volume level as well. Again, 2017-2018 was in the middle of the pack, ranked #8, at 94.11% of the average low. Highest low was 2004-5 at 139.07% of average low, and lowest low 2008-2009 was 74.92%. (NB: while 2008-2009 started with the lowest ice, it had #2 ice growth, finishing at 106.97% of average growth. Only 2003-2004 had greater growth.)
So, just-under average growth, from a just-under average low point, puts us just under the average for the year so far.
Nothing extraordinary, but (at least for me) interesting to put into perspective.
PIOMASS trend, averaged out over years, to average out noise of year to year variations, is showing Ice Loss, with linear intersection of zero by around 2030 at minimum summer extent. Global warming looks to continue for quite some decades, until the global economy sufficiently declines from resource depletions, if it doesn’t implode earlier from middle east wars. Long term warming equalibrium will take centuries.
A prophet!
LOL