With Minnesota in the deep freeze from Arctic air – CBS Minnesota believes the Arctic is hot and sea ice is near a “record low”
Amount Of Arctic Sea Ice Is 2nd Lowest On Record « WCCO | CBS Minnesota
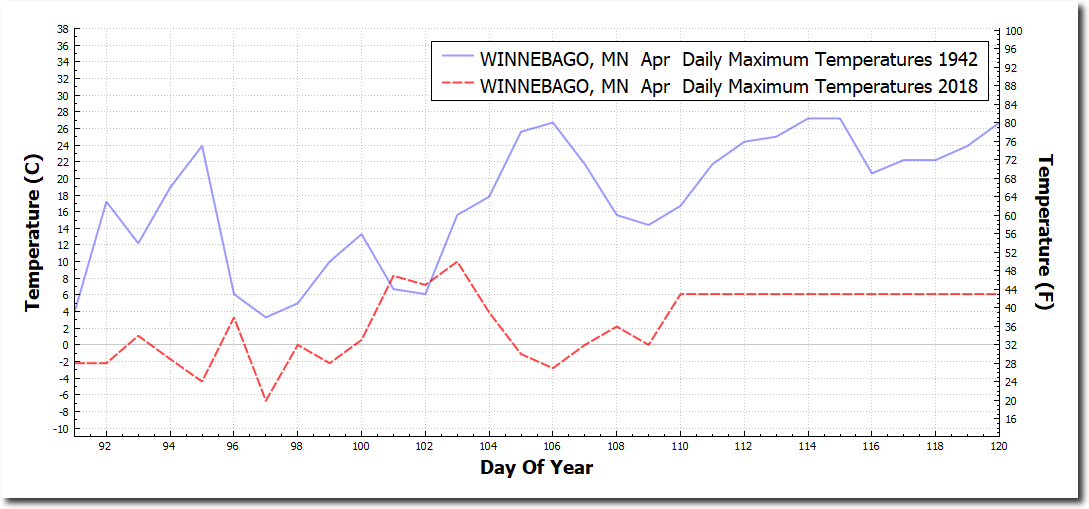
Temperatures in Minnesota this month have been nearly 40 degrees colder than April 1942.
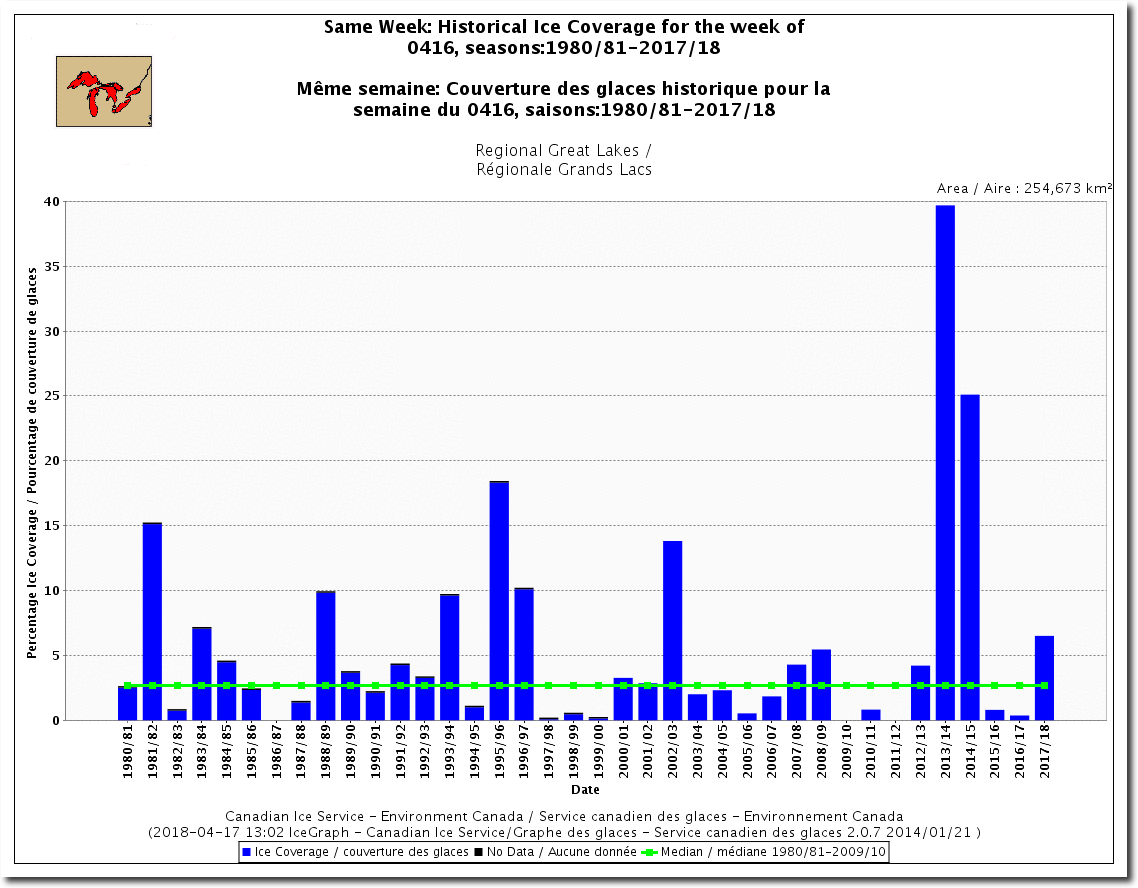
Great Lakes ice cover is nearly double the average since 1980, with four of the last six years above average.
Ice Products – Product – Product Search – Canadian Ice Service
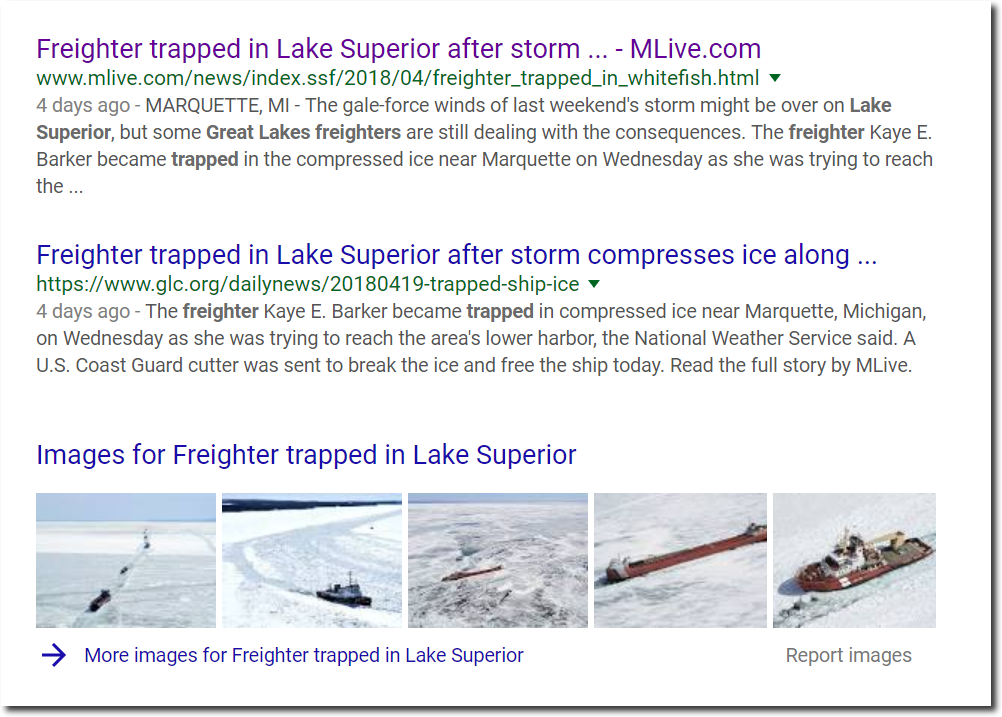
Ships are stuck in Lake Superior ice.
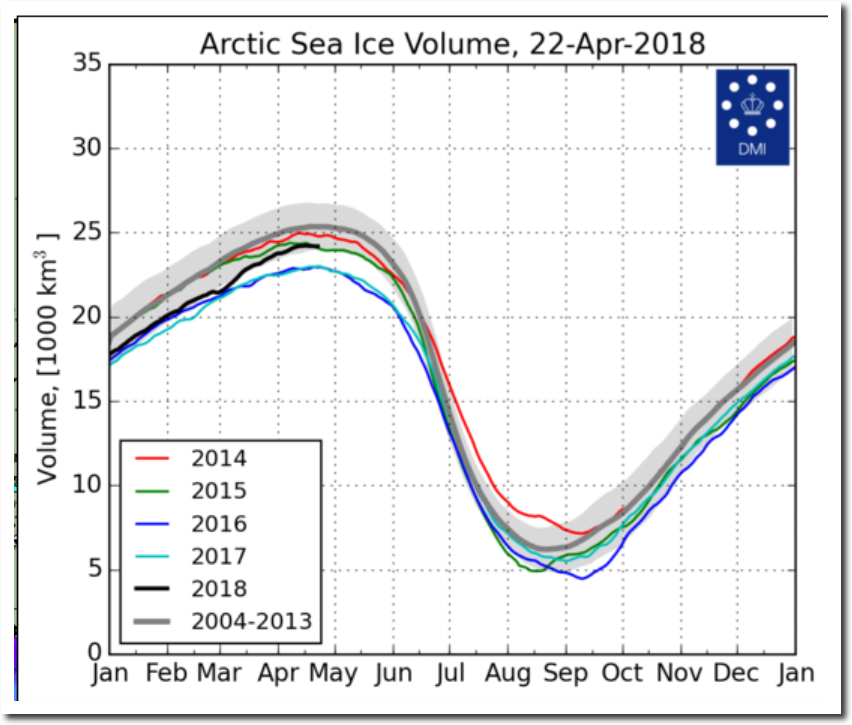
Temperatures in the Arctic are still below -20C, and Arctic sea ice volume is normal and highest in the past four years.
FullSize_CICE_combine_thick_SM_EN_20180422.png (1337×1113)
There has been a massive expansion of thick Arctic sea ice over the past decade.
It takes a very special form of stupid to believe Arctic ice is melting, when temperatures have been continuously below freezing in the Arctic for the past seven months.
Normally Minnesota warms up substantially during March and April, but there has been no warming so far this spring. Perhaps the cold is affecting the brains of journalists.
“It takes a very special form of stupid to believe Arctic ice is melting, when temperatures have been continuously below freezing in the Arctic for the past seven months.”
On the contrary, it takes a special kind of stupid to write the above.
The point is that arctic winter temperatures which will almost always be below freezing in the winter have not been as low as the average -and in fact DID go above freezing, including at the pole in the winter darkness.
The arctic ice is declining, with more melting out each summer. Of course it doesn’t melt in the winter… however this year as in the last few years it did not thicken as in former years.
The volume of course remains at the second lowest in 40 years and the extent remains at lowest for the time of year.
If you compare volume and extent 40 years ago, you can clearly see the decline… and absolutely no sign of a recovery.
e.g
http://psc.apl.uw.edu/wordpress/wp-content/uploads/schweiger/ice_volume/BPIOMASIceVolumeAprSepCurrent.png
It seems Minnesotans are smart people… they recognise displaced arctic cold is a result of climate change. I was nearly born in Minnesota…
“The arctic ice is declining, with more melting out each summer. Of course it doesn’t melt in the winter… however this year as in the last few years it did not thicken as in former years.”
False – go back to the early 1900’s and it’s clear you are wrong.
“The volume of course remains at the second lowest in 40 years and the extent remains at lowest for the time of year.”
False – reading comprehension 101.
“If you compare volume and extent 40 years ago, you can clearly see the decline… and absolutely no sign of a recovery.”
False – again stop using 1979 as your bookend. If my 5th grader can understand the concept of the Sports Illustrated jinx (madden curse if you’re under 30 Griff) then surely you can understand why using 1979 as your starting point is just bad science.
Evidence you produce before labelling this false? none.
I use 1979 becuse it marks the start of a continued series of comparable observations. Of course there is much evidence going further back, which has recently been collated going back to the 1850s.
It is clear that extent is now lower than at any period since the 1850s… that it is much lower than the lows of the 1940s. (I have Judith curry’s blog’s word on that)
“I use 1979 becuse it marks the start of a continued series of comparable observations.”
I use 1979 because I’m a propagandist.
There. Fixed it for ya.
No it is not clear. That is the issue. For one, measurements in themselves are only approximations, and second, past measurements are vastly inferior to our abilities today, which are also incomplete. You want to paint a picture of an absolutely straight line to oblivion, which is not only ridiculous but nefarious. Relax a little, you’re too rigid.
Despite your hysterical claims, we don’t see any cargo vessels regularly plying the NW passage. If your claim was true, why has Russia decided to beef up its fleet of icebreakers to include additional nuclear powered ones? Why were there vessels trapped in ice on the Russian side?
It was the same in 1974.
1st] Cherry picked… first using a Climate Denier’s word on that? … admitting that they might have anything to contribute to the argument Griff?
2nd] Curry was correcting the Walsh & Chapman sea ice extent, which showed an absurdly steady state. (forcing them to correct, but no before Al Gore publicized the faulty data) Seems like Walsh & Chapman are your guys, why bother with Curry at all?
3rd] After grabbing the Curry graph you say is somehow more indicative than Walsh & Chapman and you disregard Curry’s findings:
1] After re-calibrating the pre-satellite data, it now transpires that Arctic sea ice has alternated between periods of sea ice retreat and growth. The satellite record coincidentally began at the end of one of the sea ice growth periods. This has led to people mistakenly thinking the post-1978 sea ice retreat is unusual.
2] The results from new sea ice proxies taken from ocean sediment cores suggest that Arctic sea ice extent has varied substantially over the last 10,000 years. They also suggest that Arctic sea ice extent was actually less before the Bronze Age than it is today.
3] The current Global Climate Models are unable to reproduce the observed Arctic sea ice changes since 1901, and they seem to drastically underestimate the natural sea ice variability.
https://judithcurry.com/2017/08/16/what-do-we-know-about-arctic-sea-ice-trends/
So, all you need to do is tell us why the Bronze Age had less sea ice? Were they cooking too much Mammoth meat?
“The arctic ice is declining, with more melting out each summer”
WRONG
And how many times did you get told that (unattributed) diagram is useless for comparative purposes?
https://tamino.wordpress.com/2017/02/02/climate-denial-about-sea-ice/
“The data du jour for climate deniers is sea ice extent from MASIE, the Multisensor Analyzed Sea Ice Extent. It combines satellite data (from passive microwave sensors) with visual imagery and other sources to produce an “operational product.” Its focus is to locate the sea ice edge in real time and alert users to how it’s changing, which is very useful for organizations like the U.S. Navy.
Sounds great. But should it be used to study long-term changes, to compare one year to another, to find out how this year’s sea ice stacks up agains the past? The answer is a resounding no. Says who? Says the people who produce the MASIE data, that’s who…”
You haven’t been posting on WUWT……why not?
Griff – The question is still, assuming you are correct, so what? Are you saying this is a trend that will not reverse? That would be illogical, especial noting the natural cycles. The past record shouts out, Relax!
Tamino is a LIAR and a mathematical inebriate.
Why do you keep citing from the very depths of the AGW sewer, griff.
Oh wait….. Its where you live.
MASIE is more precise than NSIDC.. GET OVER IT !!
Still DENYING that Arctic sea is FAR above the Holocene average, griff
Still DENYING that it is above that of the MWP and the 8000 year before that?
Only time it has been higher was the FREEZING COLD anomaly of the LIA, and the late 1970s, when the extent was up there with those of the LIA.
Get some historical perspective into your miserable existence, griff, and 4realise that the decrease in Arctic sea ice has been a blessing for all those living up there.
Open waters for a couple of month along the coasts, for fishing, travel, transport, commerce.
The very last thing the people up there need is for the ice to stop its RECOVERY from the extremes of the late 1970s and to start to re-grow.
Unfortunately, as the AMO turns downwards, that is what is likely to happen.
But you don’t give a stuff about the welfare of people up there, do you.
You HATE like nobody else HATES.
Griff cannot help himself because his is incapable of thinking for himself. He is the epitome of a brainwashed useful idiot, only capable of regurgitating the discredited alarmist pablum that he’s been spoon fed.
“at the second lowest in 40 years “
So What, its still in the 10% of the last 10,000 years.
40 years ago was an EXTREME extent, up there with that of the LIA.
That’s because the late 1970s was the COLDEST period since 1900 in the Arctic
Why do you continue to DENY Climate History, griff ??
Is it that it makes a MOCKERY of your Arctic sea ice bed-wetting?
I wonder if griff has figured out what effect the El Nino had on the Arctic (and is still having a bit near the Bering strait region.
, or what the AMO is yet?
Or that Arctic sea ice extent is ANOMALOUSLY HIGH except for the EXTREMES of the LIA??
How many times can he continue to ignore FACTS.
Ignorance is his ONLY crutch. !
“The volume of course remains at the second lowest in 40 years “
WRONG
Current DMI volume is 6th lowest
DMI ain’t the only volume indicator. I wonder why it gets so much attention in these pages?
If you had an honest scientific interest Griff, you would just admit, no one has a clue how current ice levels compare to historical/climatic period levels. The data simply does not exist in a comparable format or a format to the equivalent resolution. Your ‘since 1850’ record is pure fantasy by warmists with an agenda. Any rational assessment says current levels are, to a very high degree of certainty, within known recent climatic norms.
Because its the least AGW corrupted.
You know all about corruption and LYING , don’t you griff.
Its your life.
DMI Ice Volume last 10 years
ZERO TREND
“I was nearly born in Minnesota….” And I nearly won the lottery….
http://notrickszone.com/#sthash.IE61cT9s.pqZFUlhD.dpbs
Griff, do you even stop and think of what second lowest really means?
**The arctic ice is declining, with more melting out each summer.**
You are full of it , Griff. Prove it.
Show the graph of the last 10 years.
Griff-
According to Alekseev et al 2016 (reconstructed September Arctic sea ice extent, 1900- 2013)
the ‘ice extent’ of the North Pole is somewhat cyclical- it shows a high about 1918- a low around 1939 (very similar to current levels) and a high around 1975 and the current low.
You show me a graph starting in 1979 which does not include any cycle- you just show part of the story. This misinformation is then used to demand political action.
Propaganda definition= information, especially of a biased or misleading nature, used to promote or publicize a particular political cause or point of view.
That should make it clear why I would consider you are engaged in a propaganda campaign.
People like griff are just brainwashed by the official sites. Also the media plays a big role. Here we had a marathon called ‘the ten miles’ and some people are in the hospital because of the ‘superhot’ weather. 26°C is superhot haha.
A model predicts a result. The models predicted Minnesota winters would become warmer as a result of global warming. If they haven’t followed the predictions of the model, the model is wrong. Under your logic: (1) if it is warmer in the winter, this is the result of global warming and (2) if it is colder in the winter, this is the displacement of arctic cold because of global warming. You mistake your religious belief in global warming for science. In science, either the model is right or it is wrong.
I feel like the current Administration is not doing enough to combat hysterical climate alarmist. CBS is claiming AGW is making allergy season worse: http://www.breitbart.com/big-government/2018/04/22/cbs-climate-change-making-allergy-season-worse/
We need to start by correcting historical data and then educate the public about why it is necessary. Then retract and correct all “official” climate reports over the past 4-years. Imagine the look a Hayhoe’s face when her garbage report is retracted and corrected to show no trend in wildfires across the Western States! And those monthly maps that show the Southern Ocean burning up without any data whatsoever will be re-issued to only show locations where (1) data exists and (2) is compared to the actual raw historical temps!
AGW is so omnipotent and evil that it is making everything worse,
it seems.
The Putin of science so to say.
The only things that gets better with global warming are the bank accounty of the alarmists.
BTW
Someone should say to the Griff that ice extent and volume correlate.
As a high volume ice sheet has only a small surface of its overall ice mass that is exposed to the elements,
while a thin fragile ice sheet is almost completely exposed and may melt away within one day.
An increase of ice coverage all over the arctic will usually not result in a decrease in volume as fragile things can not grow in an environment where supersolid things decline.
So ice volume is Just another stupid excuse that will be debunked as total BS in the end.
The trick is very simple:
Even the griff can see that ice coverage in the arctic is alive and kicking by comparing photos.(=this BS does not work currently)
But thickness of ice is something we can not see-that”s why they use this as deus ex machina to save their fairytale.
I frequently look here, where skilled users constantly post the latest satellite photos of the ice… something that is available to skeptics too.
https://forum.arctic-sea-ice.net/index.php/topic,2278.0.html
And there are multiple satellite observations gauging thickness (by radio altimetry) and in the summer months a pattern of overflights backed up by measurements taken on the ice itself.
there is no doubt that the volume, thickness and age of the ice is continuing to decline; that both summer and winter extent and volume is declining; that arctic temps are rising.
How many people died as a result of ice loss in the Arctic this year Ms Griff?
No doubt? Rather, there is never 100% certainty in science. Nothing is beyond doubt. Which suggests that you are not practicing science, but religion.
“where skilled users ”
Where skilled SCAMMERS.. go to feed propaganda to wannabe twits like you.
Do they have the FACT that Arctic sea ice is currently in the top 10% of Holocene extents/volumes?
Nope, they are not interested in that sort of fact.
They are only feeding morons like you a tiny bit of the story.
But its all you are able to take in. ….The bed-wetting part.
Was Ice fishing yesterday (4/22) in Minnesota, “up North” at Lake of the Woods on the Canadian Border. We still need to use the “extension” on the Auger to get through the Ice. Over 4 feet thick in some places.
Kodiak,
Your measurement is wrong and you should not have posted it. It contradicts climate science and you’d be well advised to consult with Ms Griff. The renowned London glaciologist was very helpful in discussions of Colorado climate and I’m sure she’d be happy to tell you how much ice there is in Minnesota this year.
It’s always interessting to see that ‘everywhere’ is too much ice where shouldn#t be any at this time of year.
But the only place where ice is about to dissappear is the arctic.
One can not make this up.
Brain dead Griff sez that ice isn’t real ;-)
My son and his buddy don’t have an extension for their auger and had to move around on the ice until they found a spot less than 3 feet thick and were able to reach the water. Griff thinks the ice has all melted but I bet the little shit has never even walked or skated on a frozen lake or river.
sure your ice is real. You have truly extreme weather.
But you have to start getting into your head that changes across the arctic caused this. That is not impossible. climate change does not mean everything just warms evenly over the globe.
FANTASY griff, strikes again
I really wonder what sort of substance you take to keep coming up with your mindless hallucinogenic BS !!
The ABSOLUTE and TOTALLY WILFUL IGNORANCE you portray in your every post. bizarre.
Your DENIAL of natural climate change history is quite idiotic.
The gif on the Arctic sea ice confuses me!
The 2008 image shows that in all except one year the Arctic sea ice volume was above the 2004-2013 average for April. But the second image for 2018 shows that all the years the volume was below the 2004-2013 average for April.
I am obviously missing something because I don’t understand how that means the sea ice has increased in volume. Doesn’t the graph actually show the opposite? I am confused, can anyone explain?
David, let me try.
Tony said, “Arctic sea ice volume is normal and highest in the past four years.”
That’s true. 2015, ’16 & ’17 all had less volume than right now.
As for volume in 2008 compared with now, it appears close. The black line for 2018 is perhaps slightly closer to the 25,000 km3 line than the black line in 2008.
Sure, there were prior years that had higher volume than 2008. But that’s not what Tony was saying. He said it volume now is the highest in the past four years – not the past 14 years.
Griff is earning his Soros money today.
No! Don’t tell me she is one of those girls!
to repeat: I am not paid by anyone, not a member of any political party or protest group or any green organisation whatever. I am not ‘leftist’ or of the left.
I do have a lot of downtime during my long working day in which I am free to post here.
But the question remains.
Why do you hate poor brown people? Does your employer encourage this?
Yet your every rancid brain-fart stinks of leftism.
You are a FAR leftist totalitarian socialist to the very core, whether you admit to it or not.
“I am not ‘leftist’ or of the left.”
Can she? Yes, she can!
“I do have a lot of downtime “
Some sort of mental issue that stops you from being fired for incompetence.?
Hey Tony, thanks for the post. Wonderful job explaining the nonsense the other media keeps pushing. Hey, where can I find the temperature data? I am interested in making graphs of my own :-)
Tell Toto hello for me!
ftp://ftp.ncdc.noaa.gov/pub/data/ghcn/daily/
Thank you :-)
I live in southern Minnesota and there is still ice on many lakes. They usually lose ice in the end of March. We finally had one day with an above average high temperature yesterday after 30 consecutive below average days. Some of those days it was 30 F below average.
The problem we have is the liberal media pushing lies once again. The Twin Cities media is pretty bad.
For a griff minded people that is caused by GW.
Brad, it is…
The changes in the arctic mean that the super cold air spills out into the US.
Absolute scientific fact.
The only scientific fact that Ms Griff has shared, is her hatred of poor brown people.
Like in 1976, 77, hey griff.
When it was REALLY cold in the Arctic
Remain IGNORANT, griff..
Its your only redeeming feature.
You wouldn’t know a scientific fact if it slapped you about the back of the head !!
Don’t forget Europe
https://www.netweather.tv/charts-and-data/jetstream
Are you really so clueless? So the coldest years in the seventies is because of warming arctic that spills down cold air to the south? The earth did not begin in 1979, only in your mind it did. You are braindead.