Arctic Sea Ice Thickness Increasing For Ten Years

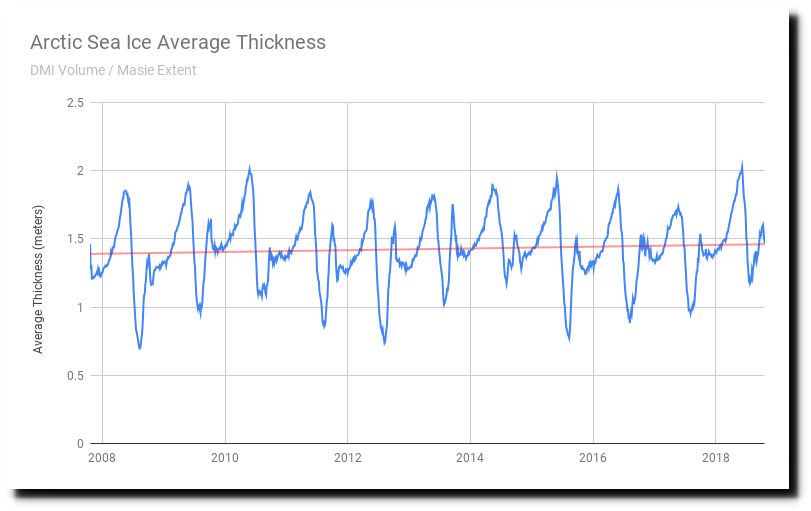
I calculated average Arctic sea ice thickness by dividing DMI volume by MASIE extent.  Average ice thickness has been increasing for a decade, and this year had the third highest maximum thickness and highest minimum thickness since the start of MASIE  records in 2006.

Spreadsheet     Area      Volume

Ice thickness near the North Pole is about the same thickness (two meters) as it was 60 years ago.

The Changing Face of the Arctic; The Changing Face of the Arctic – The New York Times

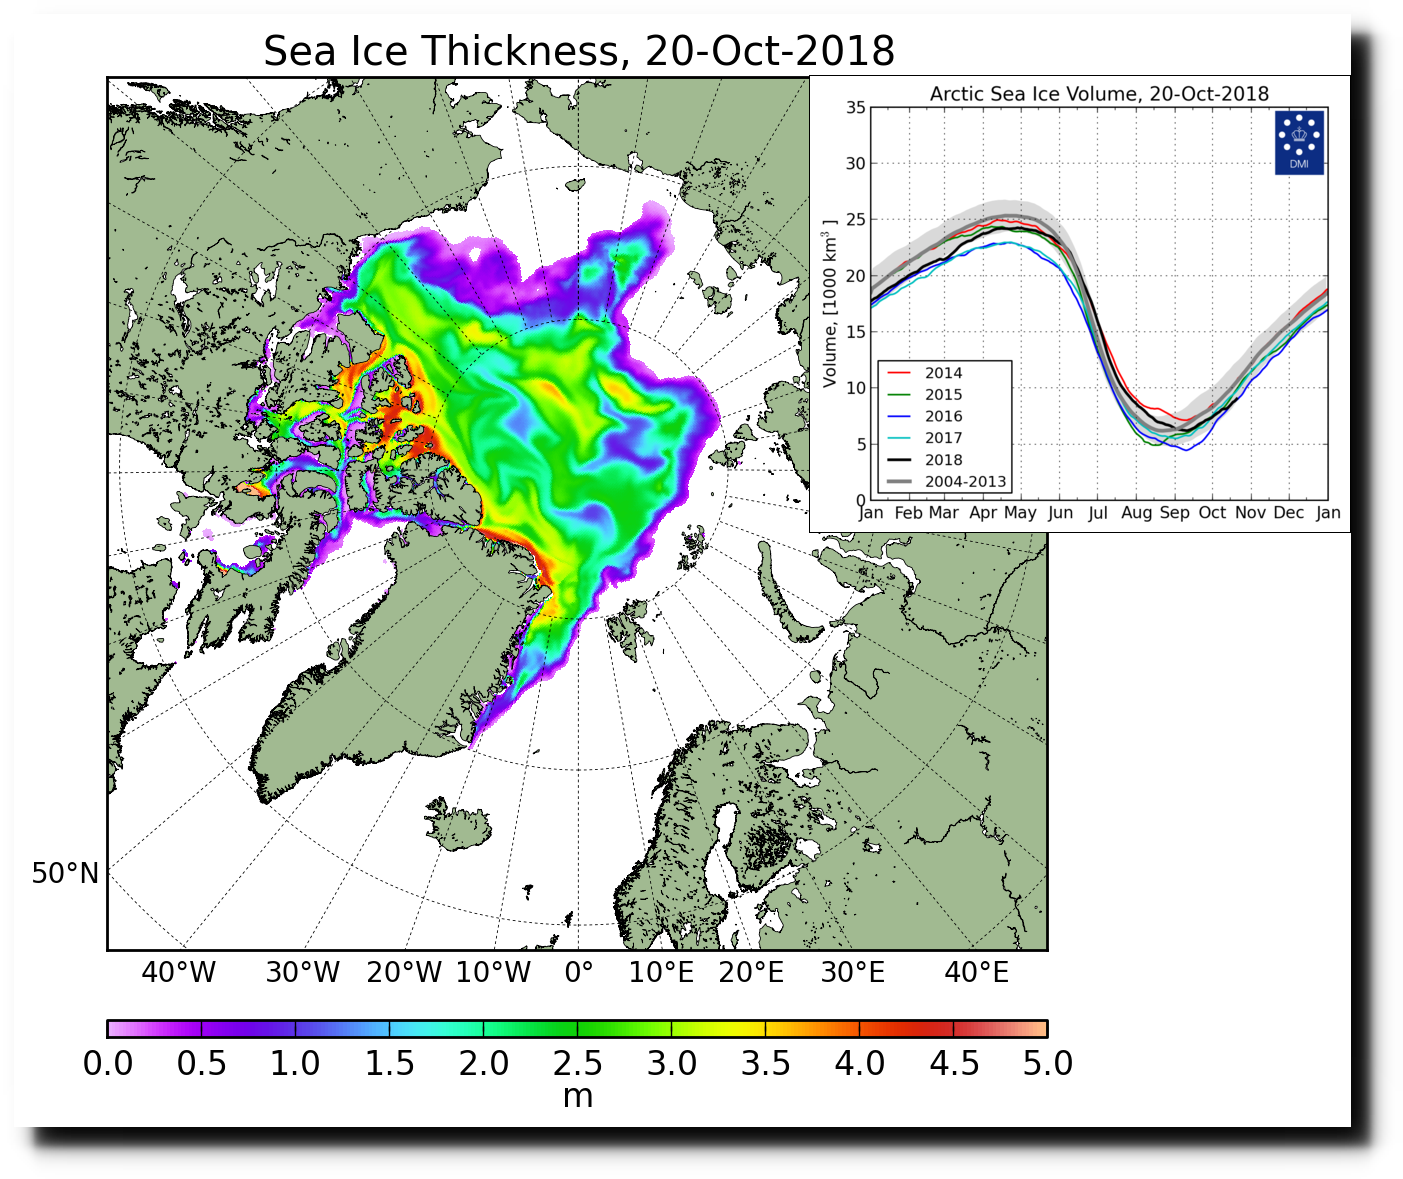
FullSize_CICE_combine_thick_SM_EN_20181020.png (1337×1113)

Climate experts (of course) claim the exact opposite, and say that the Arctic has passed a tipping point. Apparently they don’t have access to the Internet, can’t look up their own data, and don’t know how to do division.

This entry was posted in Uncategorized. Bookmark the permalink.

12 Responses to Arctic Sea Ice Thickness Increasing For Ten Years

  1. Lasse says:

    Important information!
    Albedo has small function when the clouds govern during the summer.
    Oden (an icebreaker) was there this summer and a blog welcomed the sun when they left the area after two months.
    The captain has never seen as hard ice as this year.

  2. R Shearer says:

    The “Experts” must also deny the truth that there is currently more polar ice than during most of the past 7000 years or so, and all changes observed are within natural variation and experimental error.

  3. Disillusioned says:

    I have a hunch this post may produce some Pavlovian responses.

  4. oeman50 says:

    My local paper today had an article about how a group wants walruses declared endangered because of the lack of…..sea ice that they prefer over land. What a bunch of maroons.

  5. gregole says:

    Not to dis any ice mavens, but this result is consistent with the observation that Arctic ice, despite predictions of its imminent demise, is simply varying about some mean – what we’re all staring at with such rapt intent is nothing more that statistical noise.

    Imagine a group of test technicians staring at the screen of an oscilloscope; all in turn, making various pronouncements. But the probe leads aren’t connected to anything. What a joke. I thought all that excess M@nn-Made CO2 was causing something called “Arctic Amplification”.

    Just noise about some mean value.

  6. AndyDC says:

    If the sea ice charts started in 1940 rather than 1979, there would be not the slightest concern. But by starting them at a near record high level in 1979, they have given the impression of a downward trend that is totally misleading.

  7. Disillusioned says:

    “If the sea ice charts started in 1940 rather than 1979, there would be not the slightest concern. ”

    I have to disagree. If the charts began then, that would be very alarming. For opportunistic totalitarianism.

  8. ben says:

    Curious if you plan to address this bet:

    https://www.nature.com/articles/436897a

    I’m guessing the data was cooked. Even the HE data has been cooked. If I was the Russians I would have insisted that an incorruptible representative data set be used, like the average of all real temperature measurements in the USA for stations that are well situated.

    • spike55 says:

      Certainly, anyone who places bets on NCDC once-was-data ever showing cooling, really needs to say to themselves… gees, that was REALLY DUMB !!

  9. ben says:

    Should read “US” not “HE”

  10. george wells says:

    cultural commies are not going to appreciate the facts…..hinders Sovietization of USA

Leave a Reply

Your email address will not be published. Required fields are marked *