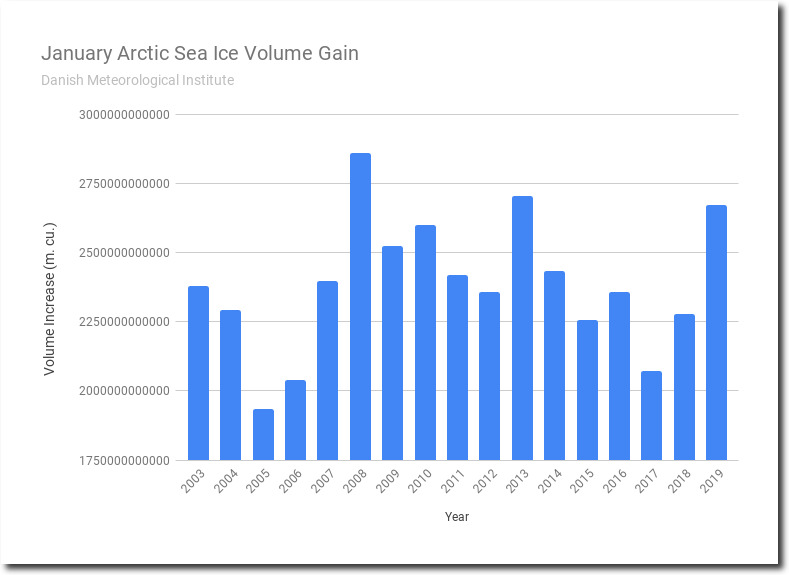
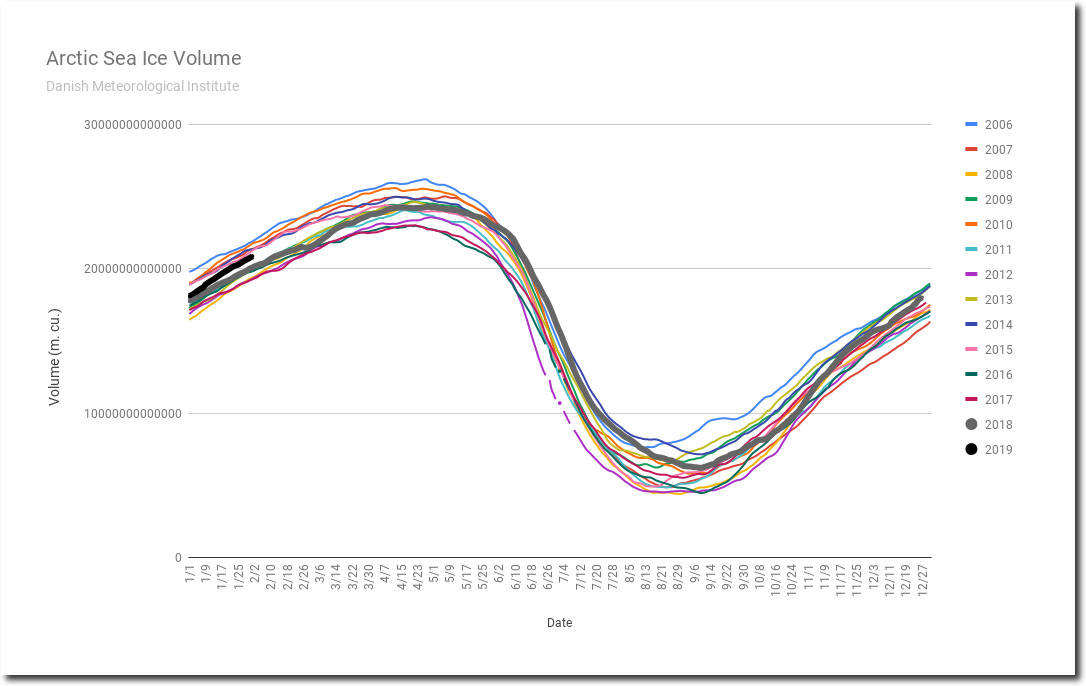
January Arctic sea ice volume gain was third highest in the DMI record, after 2008 and 2013.
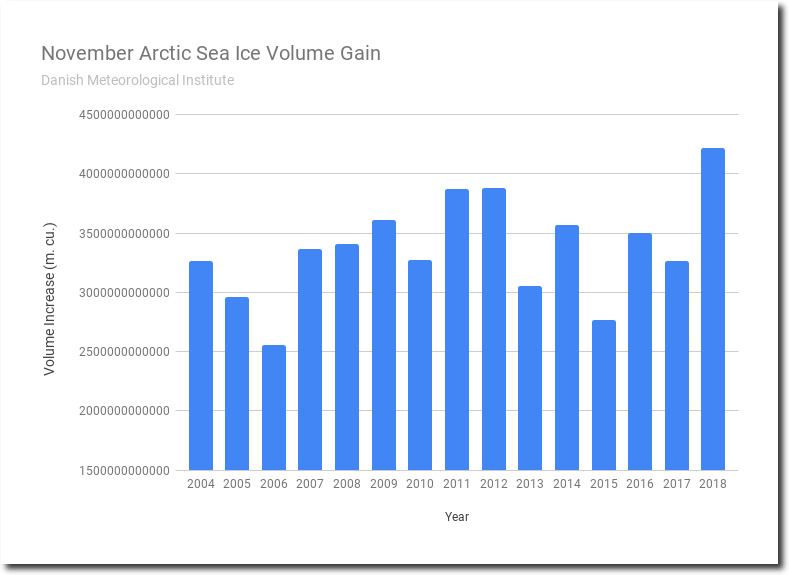
November gain was largest on record.
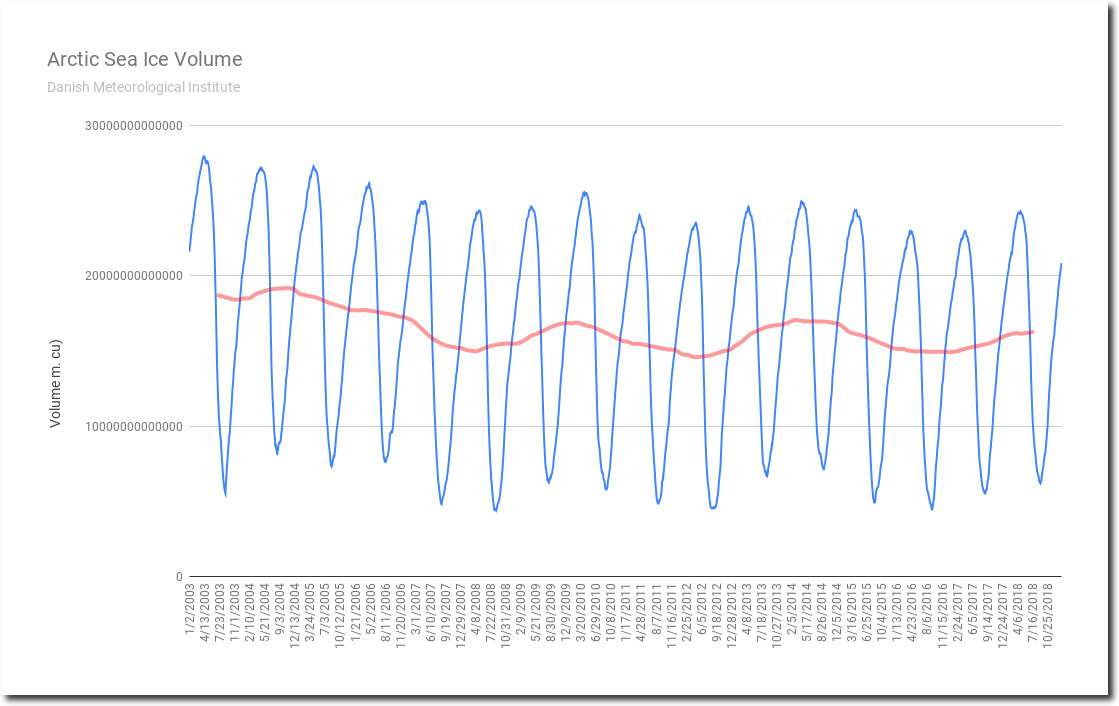
There has been no trend in Arctic sea ice volume over the past twelve years.
Experts describe the non-changing Arctic in all sorts of hysterical terms, because their funding depends on keeping people misinformed and frightened about the climate.
Cue the Grifftard to once again proclaim the big gain is all down to the ice being at such low levels.
The cold can’t possibly be having an effect.
Agreed. According to UAH, the anomaly for the Arctic was -0.18 for January.
The current weather in the arctic has strong winds from the south sweeping across the Atlantic toward the pole and consolidating the ice on the Barents side of the Basin. Temps are above normal but still well below freezing. The ice area is dropping as the ice is ridged into thick piles, leaving the cold waters of the Atlantic exposed to the cold winds and night sky to freeze quickly anew.
At the same time, winds from the South are pushing the Bering ice into the Chukchi, consolidating it into thicker ridges on the Pacific side of the Basin. Again the temperatures are a bit higher than normal and the area growth falters as the piles form under the night sky.
A current weather vice from the Atlantic and Pacific is compressing the ice across the Basin into thicker ridges that will resist melting out. Volume is continuing to increase even as the area growth rate hesitates as the ice consolidates into thicker ridges. And there is still enough night sky for the rapid growth of new ice over any open water.
The AGW enthusiasts see the temp and area change and shout, “See. That’s bad.” While the process is actually limiting export through the Fram and making every bigger piles of thick ice in the Basin.
100% proove for coming ice age :)
Thank you! I teach Earth and Space Science. Truthful sources of information are difficult to find.
DMI Sea Ice Volume report for Feb 2: Volume rose 103 cu km since yesterday, to 20,867 cu km, which is 99.12% of the day’s average value in the 17-year series, and 99.02% in the DMI-charted 10-year reference period 2004-2013.
The day’s average growth in the 17-year series was 73 cu km, and for the reference period 72 cu km. Comparatively, the day’s growth this year was 141.11% and 144.12% of those values, respectively. 2019 is now 186 cu km below the 17-year average.
Compared with last year, Sea Ice Volume is now 658 cu km above the volume for the day last year.
The latent heat released in the formation of the new ice is 3.1521E+19 Joules, or 3.1521E+07 TeraJoules.
How do I put this on Facebook? I have a fair number of followers they’re.
I copy the URL from the post which I wand to share and past it into FB.
A ‘post to FB’ button would be handy…
“Scientific American is neither Scientific nor American.” –Edward Teller
I checked your source, the Danish meteorological institute myself. They clearly show that arctic sea ice is rapidly declining.
https://www.dmi.dk/da/nyheder/2018-nyeste-med-forsider/ny-nasa-satellit-holder-oeje-med-isen-ved-polerne/
Typical idiotic climate alarmist post
Yeah, not even comparing the same metric, and cherry picking a low value at the end of the melt season. The chart date is Sep 18.
And, I suppose worth saying, even with all that, the red line (2018 operational product) is above 3 of the 4 other colored lines for the recent previous years, and right under the 4th one, which is the oldestof the 4. The trend recently is therefore one of short-term recovery.
Steven,
You are excellent with data. And I appreciate what you do. Thank you.
But, I don’t think that anencephalic imbecile knows enough to [purposefully] cherry pick. Marc de Ruijter surely must need help bathing and dressing.
Wow. And Marc de Ruijter connected his face and name to that moronic post. How embarrassing.
I am shaking my head in disbelief. I am embarrassed for you, Marc.
https://www.youtube.com/watch?v=Y8GGpYFmkYI
DMI Sea Ice Volume report for Feb 3: Volume rose 104 cu km since yesterday, to 20,970 cu km, which is 99.27% of the day’s average value in the 17-year series, and 99.17% in the DMI-charted 10-year reference period 2004-2013.
The day’s average growth in the 17-year series was 72 cu km, and for the reference period 75 cu km. Comparatively, the day’s growth this year was 143.96% and 138.91% of those values, respectively. 2019 is now 155 cu km below the 17-year average.
Compared with last year, Sea Ice Volume is now 697 cu km above the volume for the day last year.
The latent heat released in the formation of the day’s new ice is 3.1675E+19 Joules, or 3.1675E+07 TeraJoules.
DMI Sea Ice Volume report for Feb 4: Volume rose 68 cu km since yesterday, to 21,038 cu km, which is 99.28% of the day’s average value in the 17-year series, and 99.17% in the DMI-charted 10-year reference period 2004-2013.
The day’s average growth in the 17-year series was 65 cu km, and for the reference period 68 cu km. Comparatively, the day’s growth this year was 103.96% and 99.69% of those values, respectively. 2019 is now 152 cu km below the 17-year average.
Compared with last year, Sea Ice Volume is now 711 cu km above the volume for the day last year.
The latent heat released in the formation of the day’s new ice is 3.1675E+19 Joules, or 3.1675E+07 TeraJoules.
2019 just passed the 21,000 cu km milestone, 1 day earlier in the calendar than the average day to reach that milestone for the 17 year series.
Correction on the Joules calculation: 2.06446E+19 Joules, or 2.0645E+07 TeraJoules. Sorry for the error.
DMI Sea Ice Volume report for Feb 11: Volume rose 72 cu km since yesterday, to 21,444 cu km, which is 98.87% of the day’s average value in the 17-year series, and 98.63 % in the DMI-charted 10-year reference period 2004-2013. 2019 has been ranked #9 in Sea Ice Volume each day this year.
The day’s average growth in the 17-year series was 68 cu km, and for the reference period as well. Comparatively, the day’s growth this year was 103.96% and 99.69% of those values, respectively. 2019 is now 245 cu km below the 17-year average.
Compared with last year, Sea Ice Volume is now 679 cu km above the volume for the day last year.
The latent heat released in the formation of the day’s new ice is 2.20413E+19 Joules, or 2.2041E+07 TeraJoules.
Sea Ice Volume growth of 15,000 cu km since the 2018 low stand was reported for Feb 8.
The lost of the incoming strength of SN1006 shown be largest Greenland glacier and SN1054 lack of surface ice melt early in 2019 indicates it melting strength is diminishing show Artic ice may gain again. Also notice the earth has been cooling in figure the last five years.