
NOAA says last month was “among the eight warmest Februarys on record” in much of the Earth.
According to NCEI’s Regional Analysis, South America, Europe and Oceania had a February temperature that ranked among the eight warmest Februarys on record.
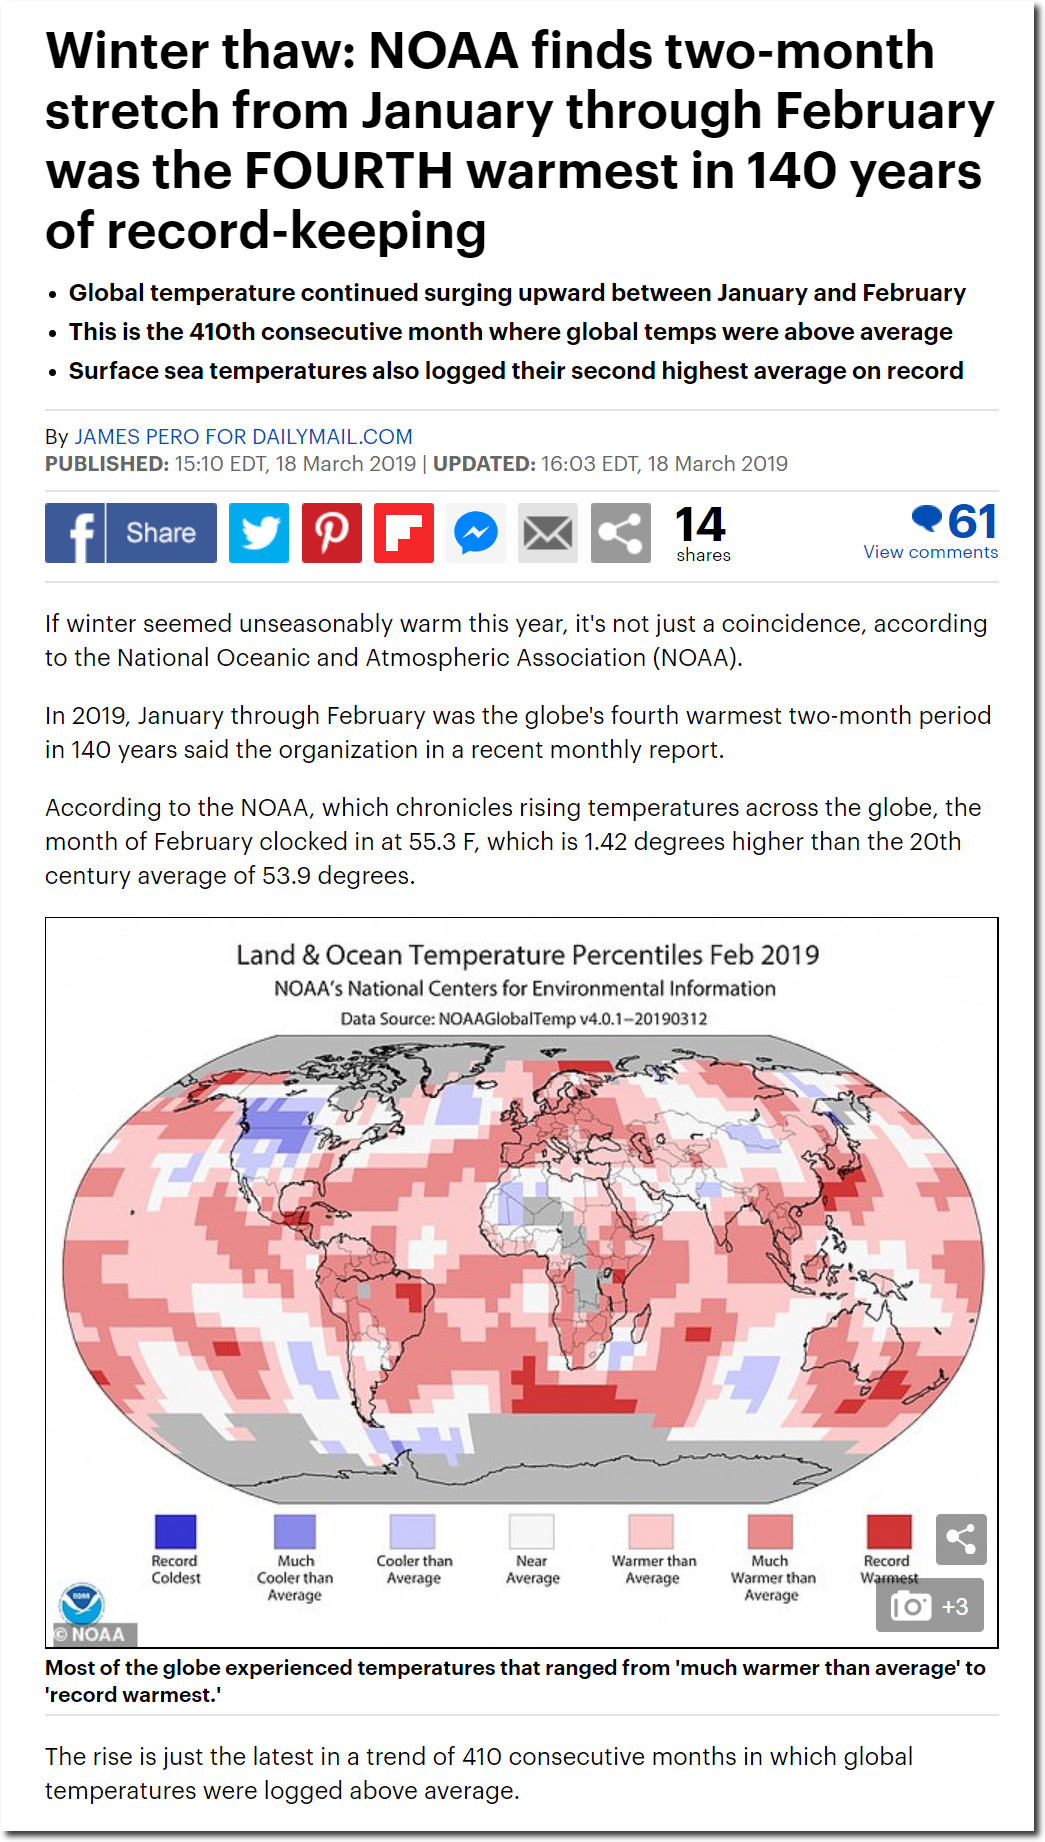
There is no such word as “Februarys” – plural for February is Februaries. But besides the fact they are illiterate, they are also lying. This is the map they use to justify their claims:
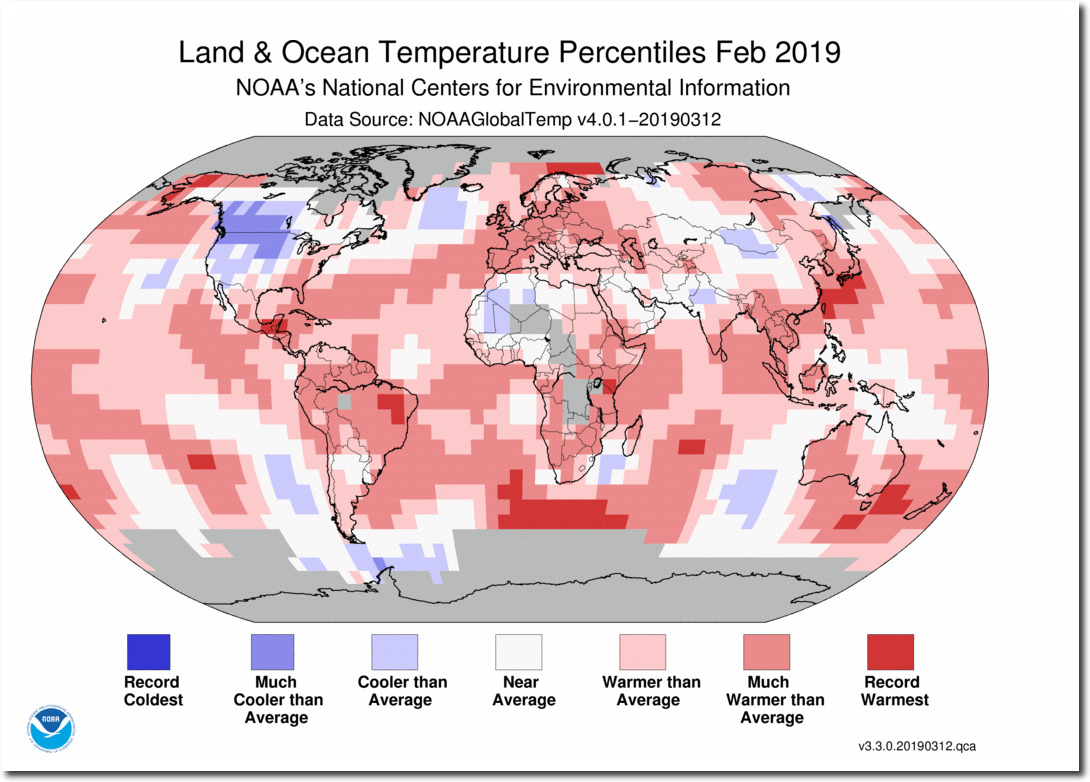
It looks like the world is burning up, with just a few slightly cool areas. It has an official government seal on it, so it must be accurate, right?
The map below shows where NOAA actually had surface temperatures in February.
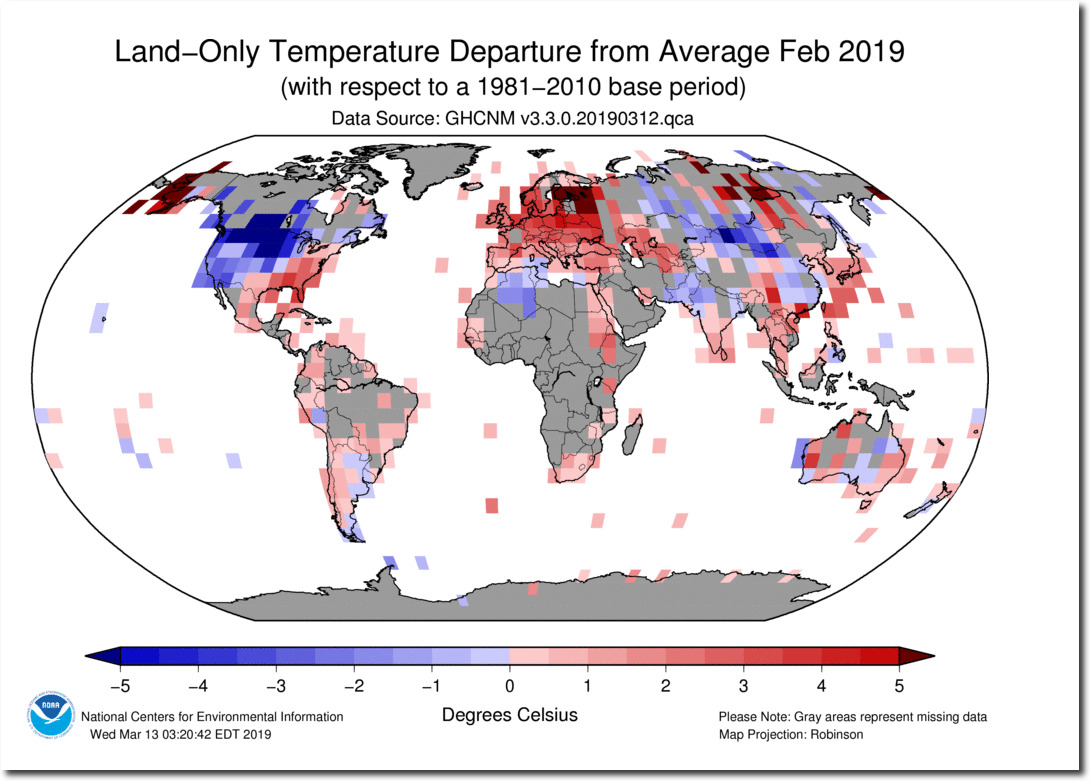
The map looks nothing like the one NOAA presents to the public. By pixel count, 51% of the land area is gray “missing data,” 16% is below normal temperature, and 33% is above normal. The animation below shows how they created one of the eight warmest “Februarys” in South America – by simply making up data, including record warmth in Brazil in locations with no actual thermometer data.
Also note how they made the cold in Asia and parts of Australia disappear.
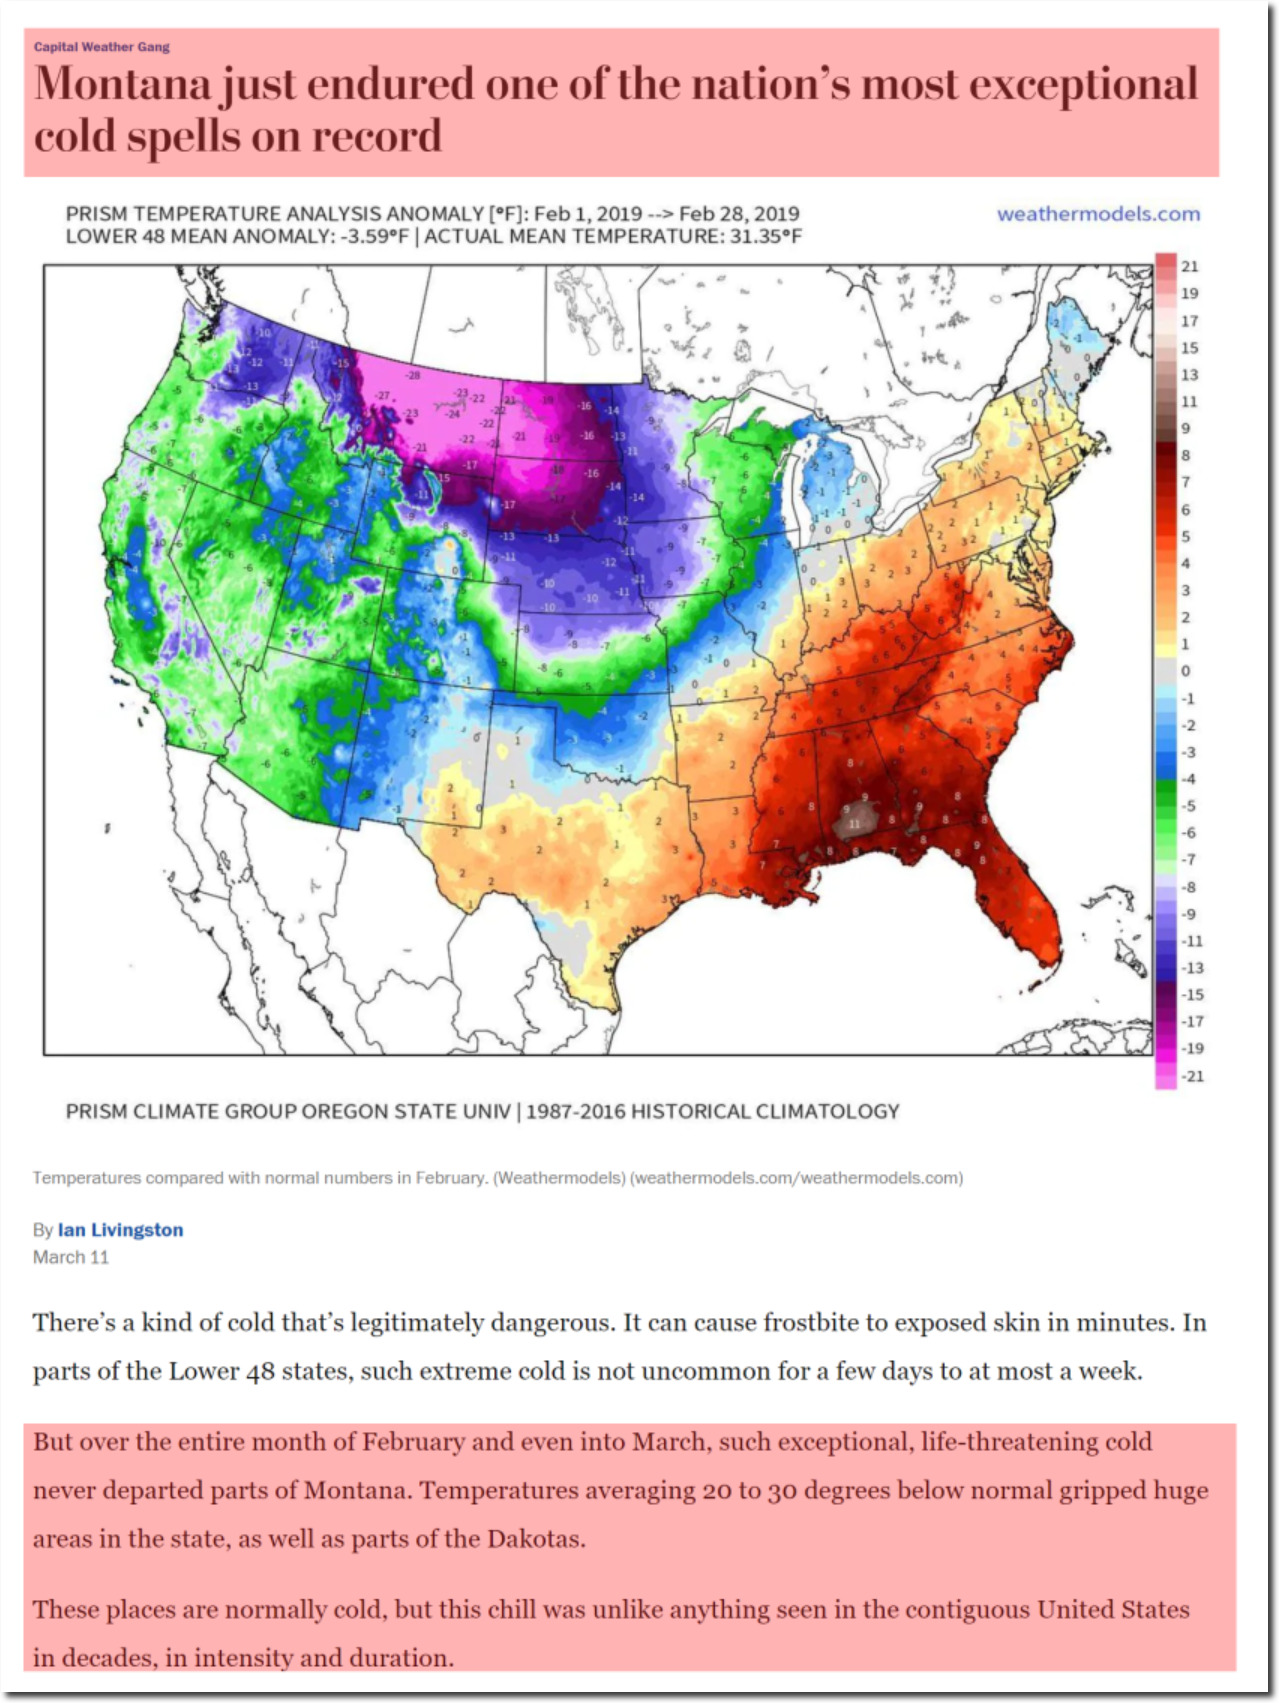
And they largely made the near record cold in much of North America disappear.
Montana and the Dakotas were 20 degrees below normal, as was much of Canada. Here is how the Washington Post described it:
The February temperature departures from normal were stunning. Several major climate locations averaged 27 to 28 degrees below normal, the most extreme departures in the Lower 48 for a full month since January 1969
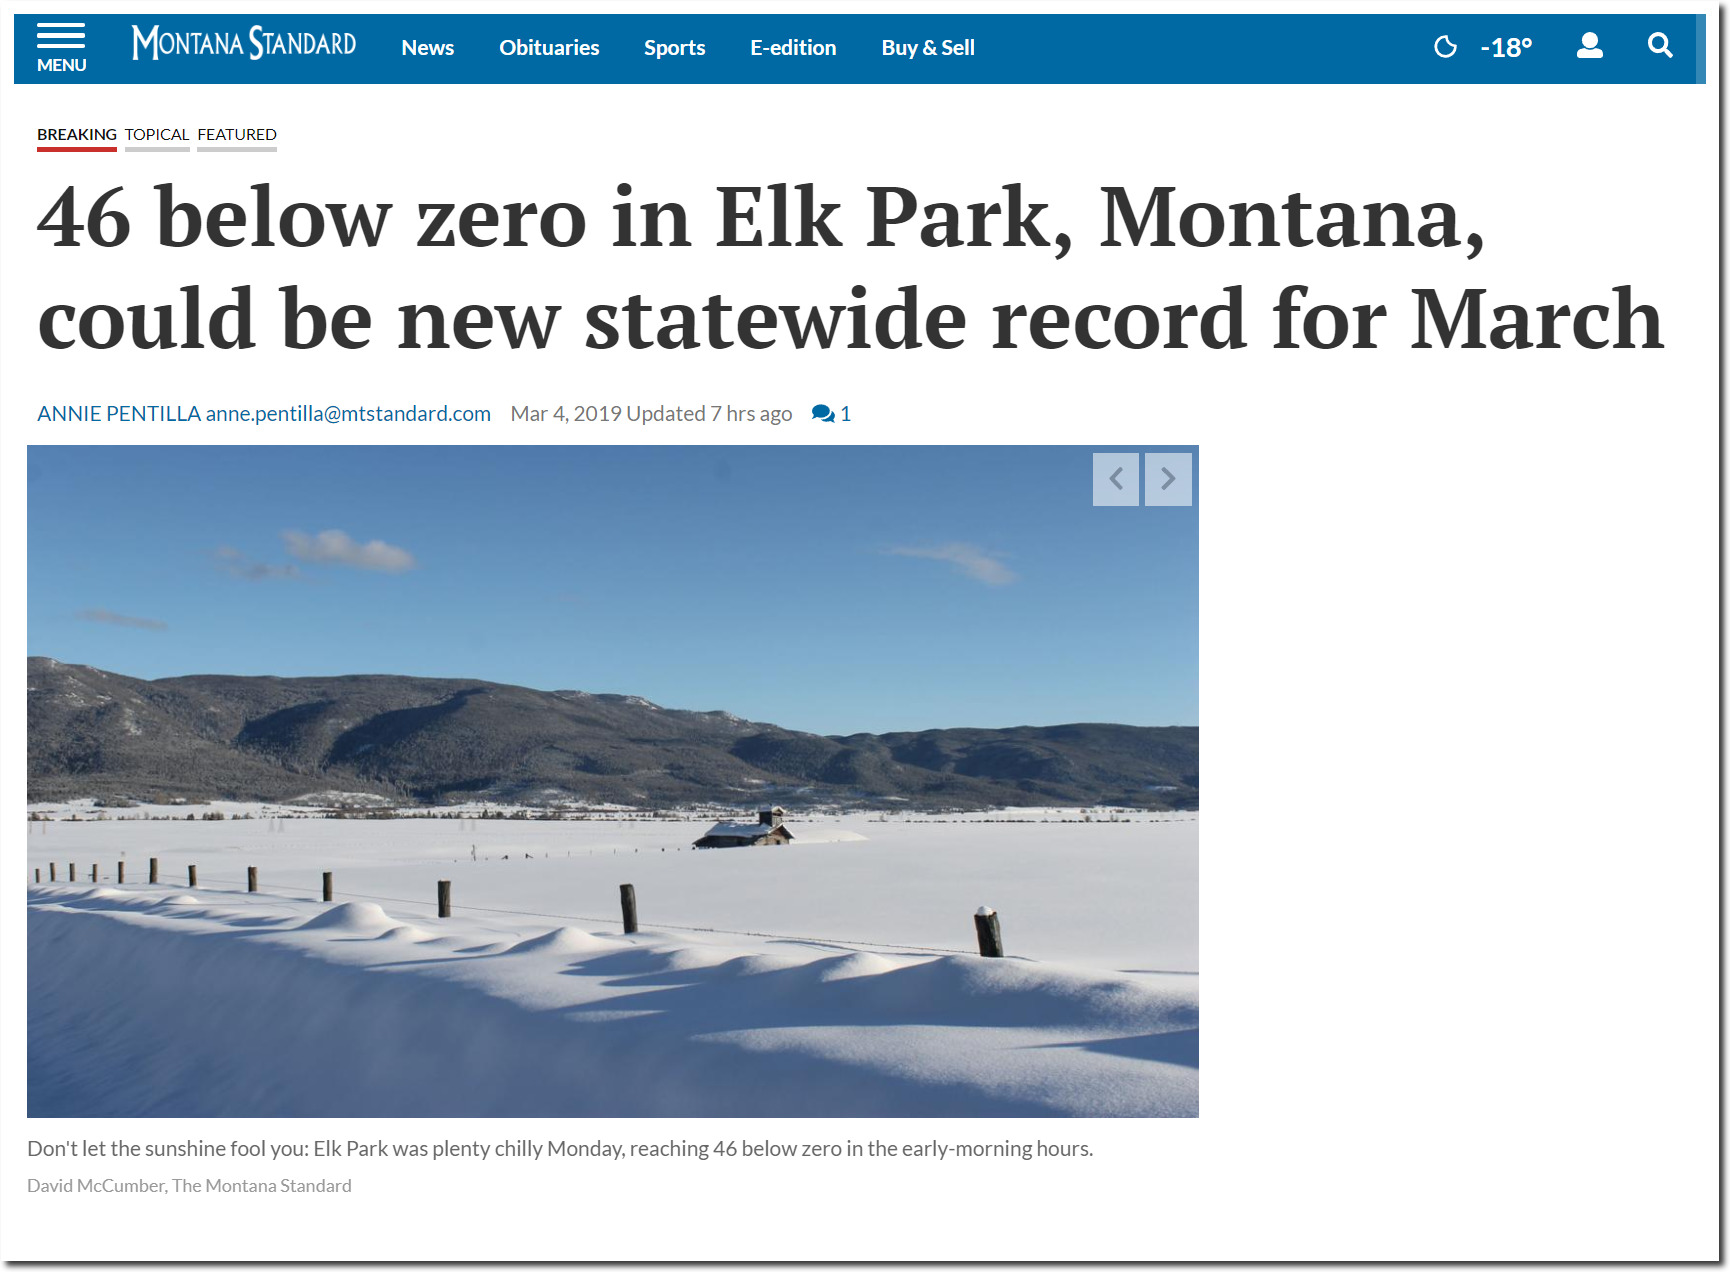
46 below zero in Elk Park, Montana, could be new statewide record for March | Local | mtstandard.com
US February temperatures were well below normal, and about 10F cooler than February 1954.
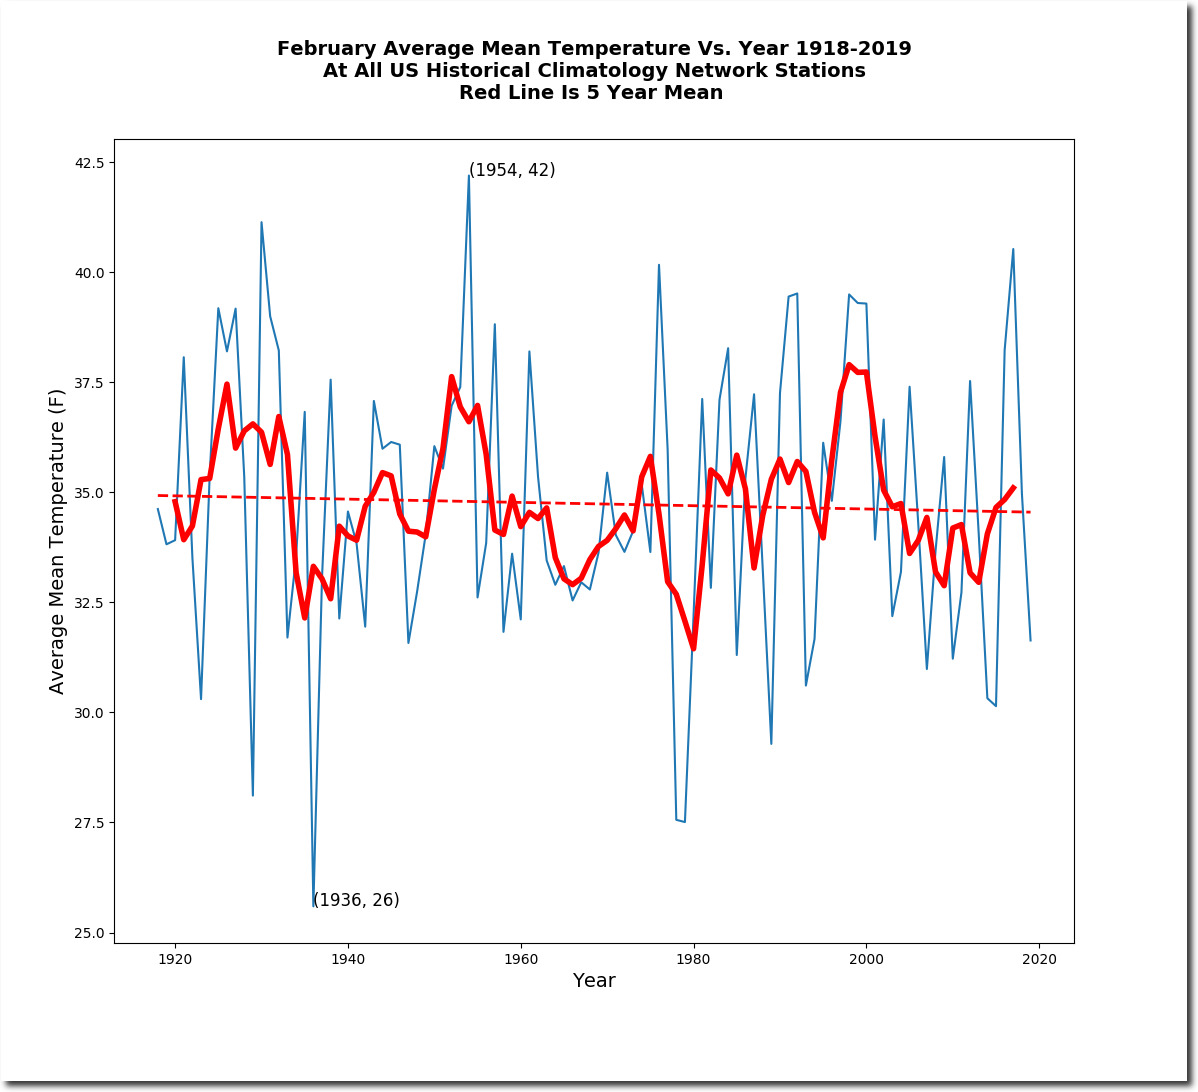
The US data is extremely important, because NOAA actually has very little historical data outside of the US, western Europe and parts of Australia..
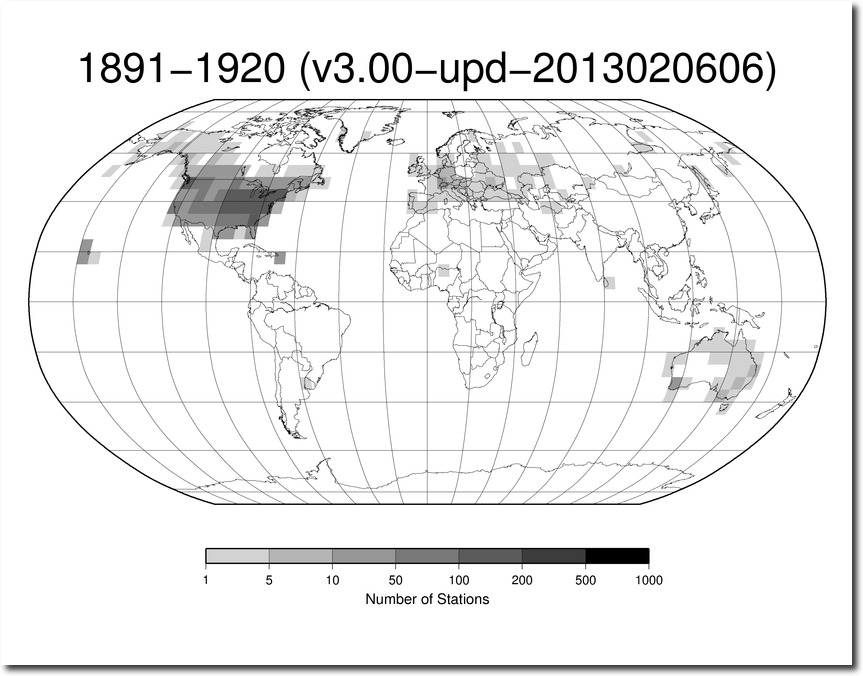
ftp://ftp.ncdc.noaa.gov/pub/data/ghcn/daily/figures/station-counts-1891-1920-temp.png
NOAA also claimed to have almost no February data for Greenland, where temperatures have been extremely cold over the past month.
The NOAA land data is fake, and an Orwellian rewrite of record cold at spots. But the ocean data is even faker.
the global ocean-only surface temperature was 0.70°C (1.26°F) above average and the second warmest February since global records began in 1880
They claim to have ocean temperature records back to 1880 – which is patently false. Prior to about 15 years ago, no one even pretended to have pre-1950 global ocean data. And as Phil Jones at CRU said, much of the data they are using is “made up.”
For much of the SH between 40 and 60S the normals are mostly made up as there is very little ship data there.
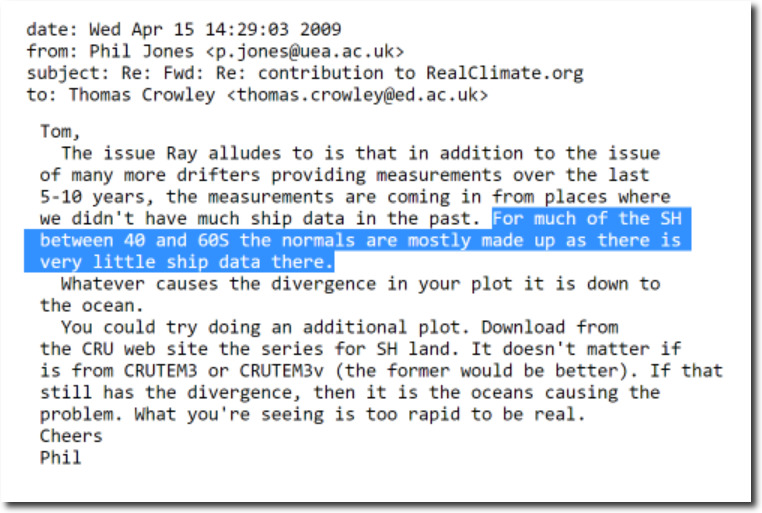
di2.nu/foia/foia2011/mail/2729.txt
Sea surface temperatures are well below normal in much of the southern hemisphere.
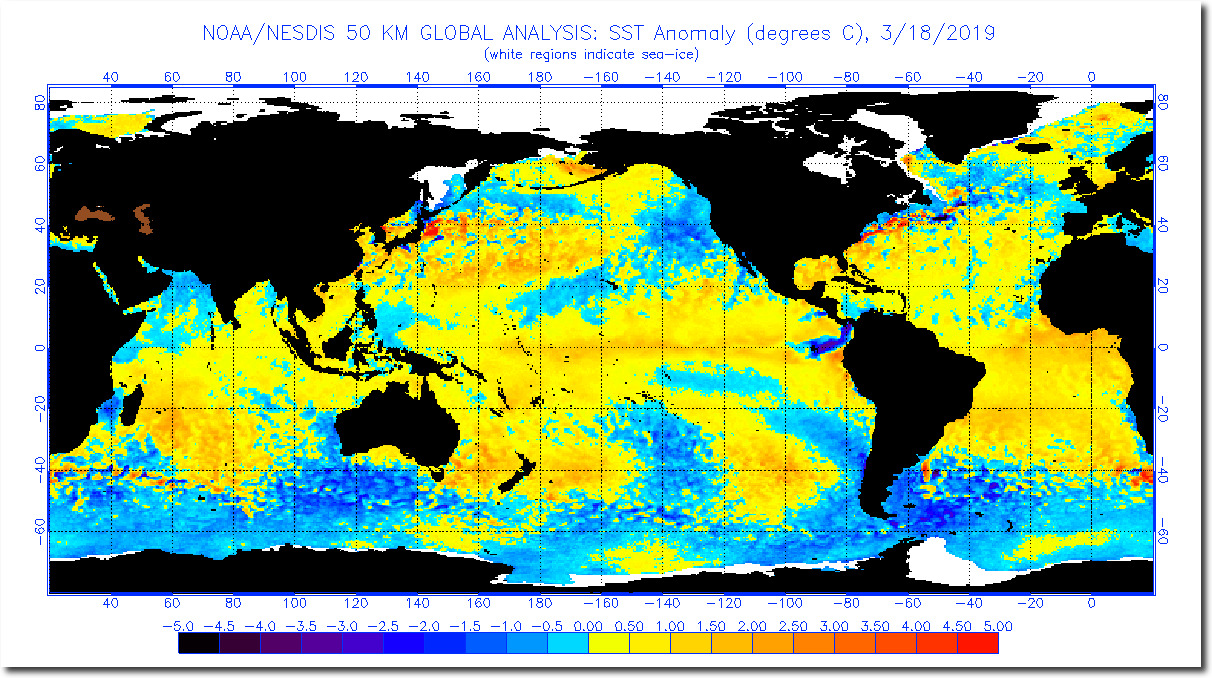
anomnight.3.18.2019.gif (1174×640)
The animation below flashes between the NOAA temperature departure map and the temperature percentile map. You can see how blues disappear, and pink turns to red.
The next step of the process is generation of propaganda like this:
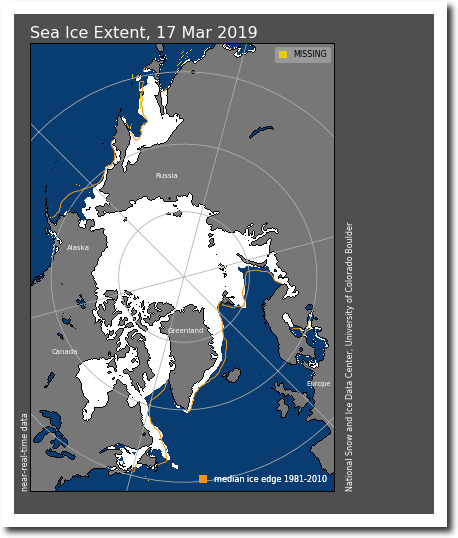
Arctic sea ice extent is very close to the 1981-2010 median edge. Ice doesn’t lie, but government climate scientists do.
Index of /DATASETS/NOAA/G02135/north/daily/images/2019/03_Mar/
The NOAA red hot map has no basis in science, which is standard practice for climate alarmists with an agenda.
