
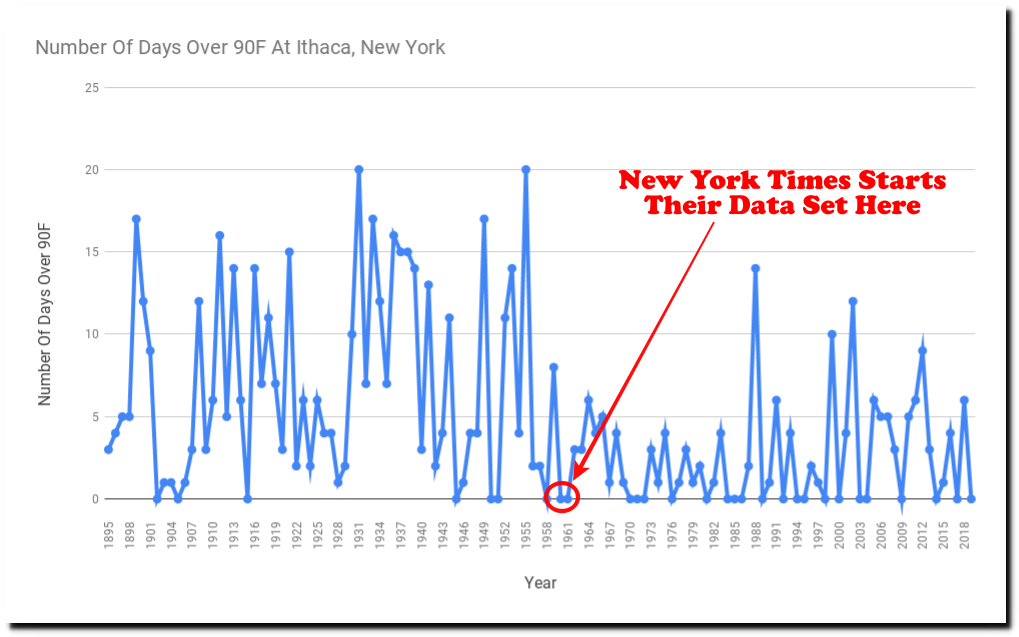
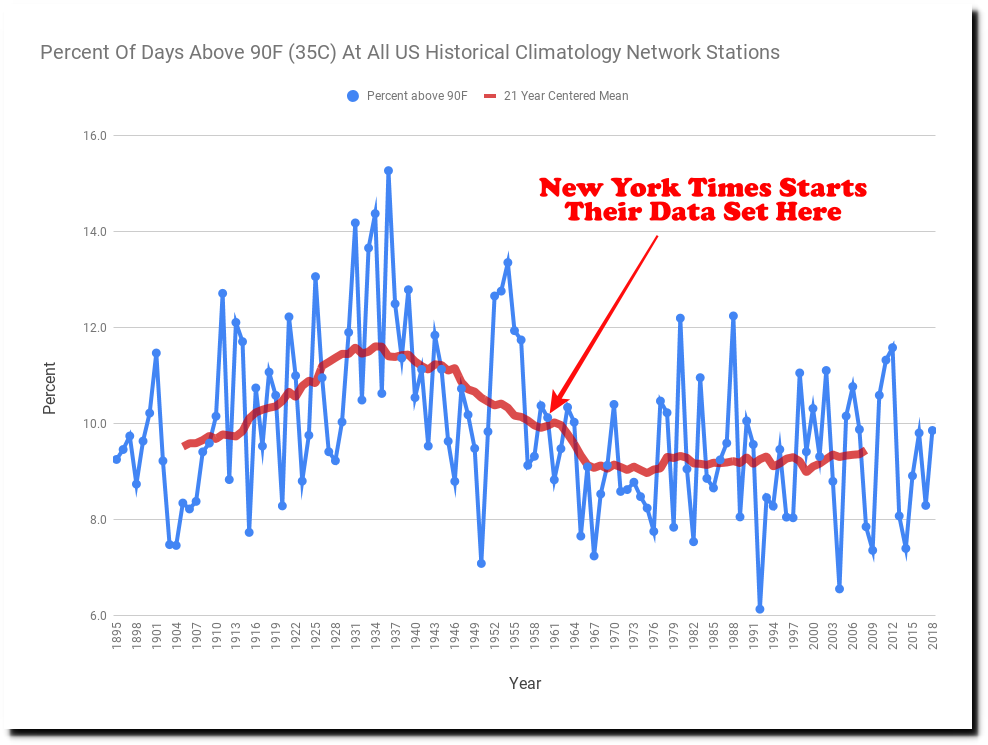
In a previous blog post, I showed how the New York Times is hiding all the hot weather prior to 1960.
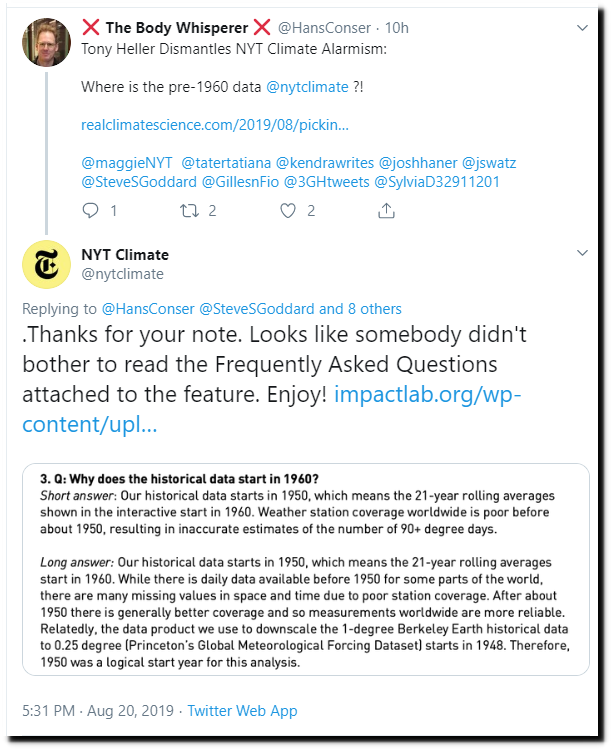
The New York Times has responded to this criticism, by stating that there isn’t much data in most of the world before 1950, due to poor station coverage.
This map from the NOAA Global Historical Climatology Network confirms the New York Times assertion. Outside the US, there is very little high quality data prior to 1950.
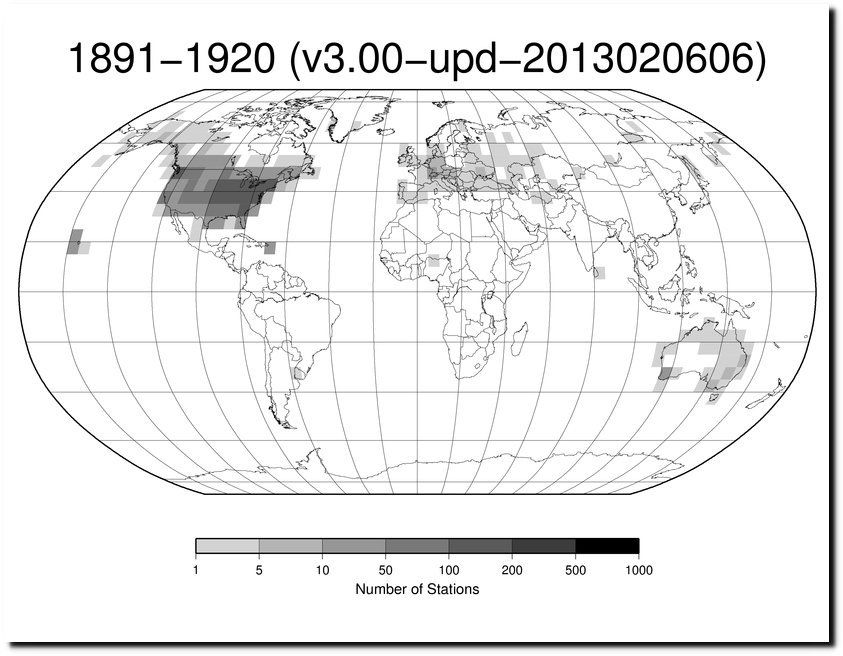
ftp://ftp.ncdc.noaa.gov/pub/data/ghcn/daily/figures/station-counts-1891-1920-temp.png
Here in the US, the story is completely different. There was more data available every year of the past century than there was in 2018.
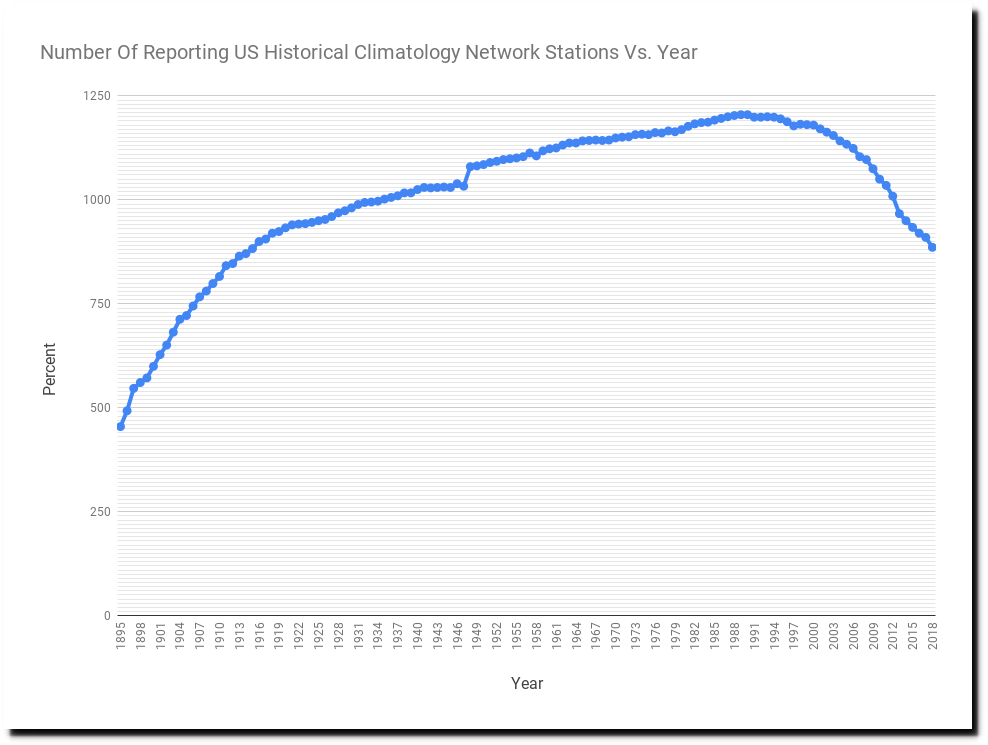
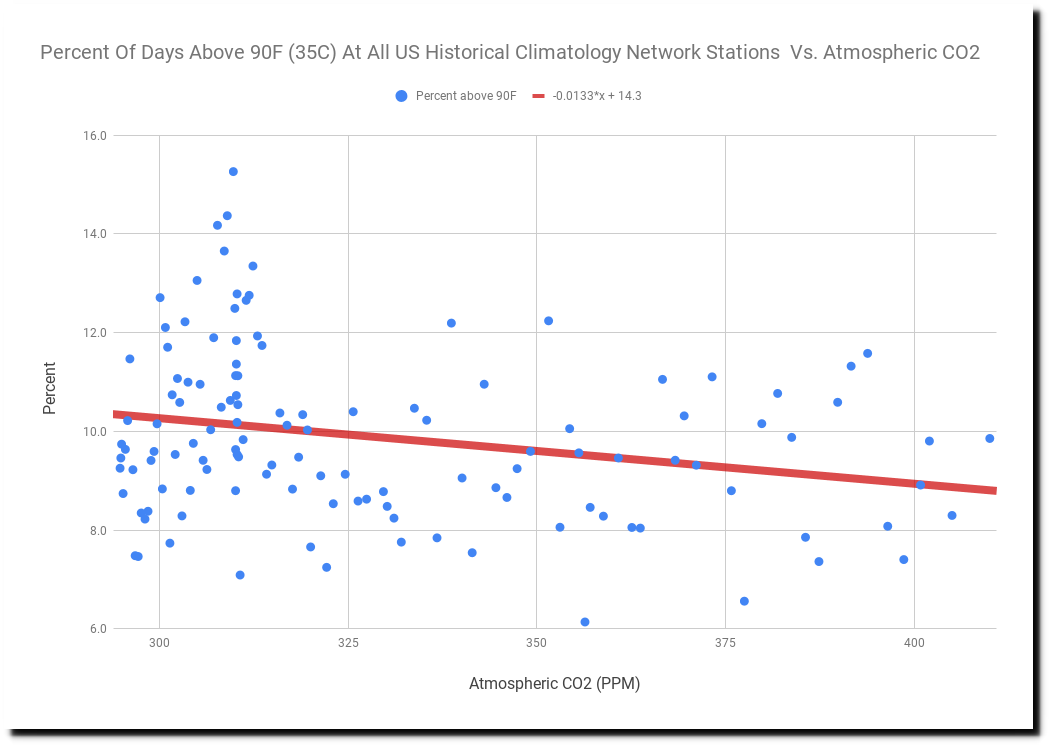
So there is no excuse for for them cherry-picking a start date of 1960 for US stations, failing to point out that the frequency of hot days has declined sharply in the US as CO2 has increased, and not mentioning that their projections of increasing hot days has no scientific basis.
But what they did get correct, is their assertion that the global temperature data prior to 1950 is inadequate for use in statistics, and shouldn’t be graphed. This is what I have been saying for the past dozen years, and I greatly appreciate them confirming my work.
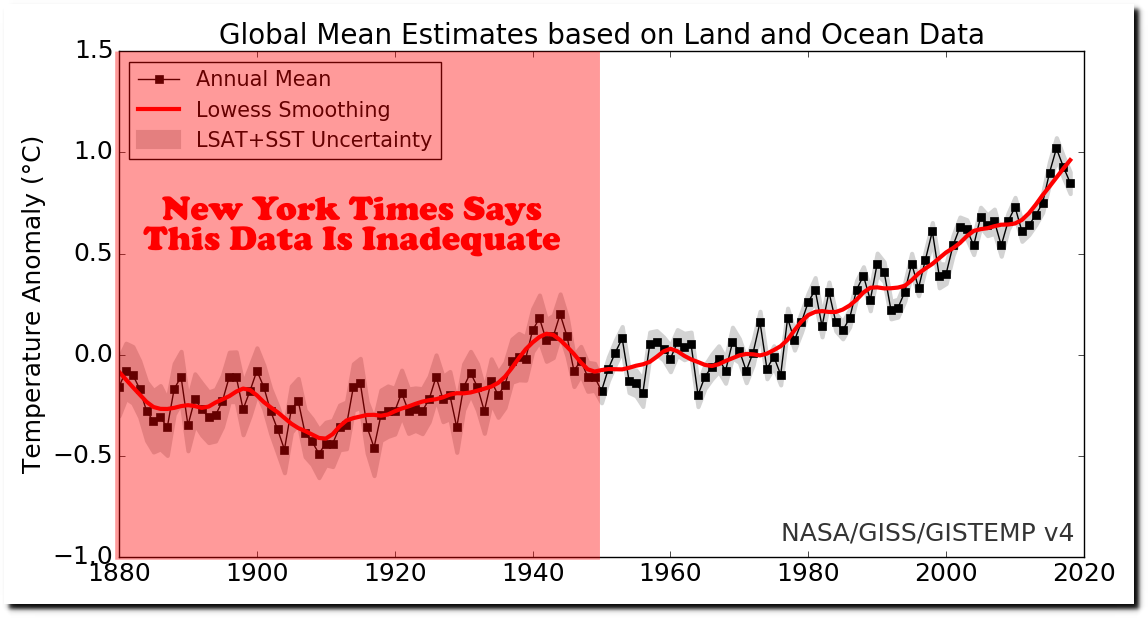
The pre-1960 data which the New York Times is hiding in the US shows that the past was much hotter. Without adequate coverage elsewhere, there is no reason to believe the same trend didn’t occur in other parts of the world. The New York Times is making a very strong argument against the credibility of the global temperature graphs – which serve as the basis of the EPA CO2 Endangerment Finding. This will be very helpful.
