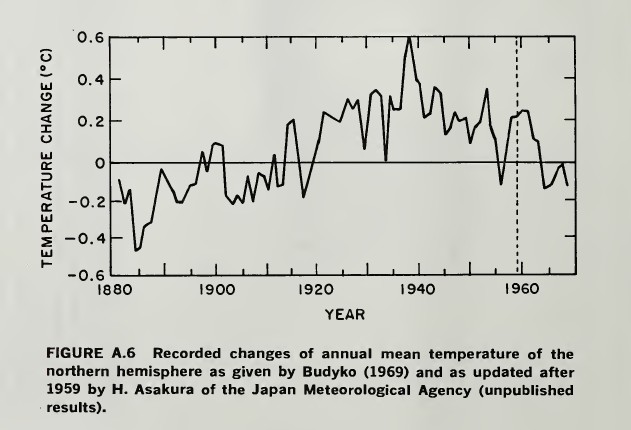
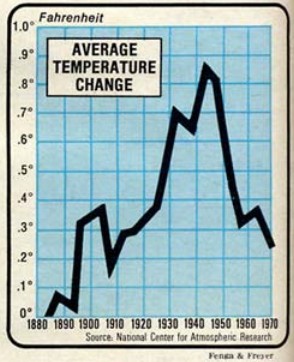
1975 National Academy of Sciences report showing that 20th century temperatures peaked in the late 1930’s.
Climategate emails show that the hockey team was looking for ways to get rid of the 1940’s temperature spike. They did exactly that, and the spike is now completely gone.
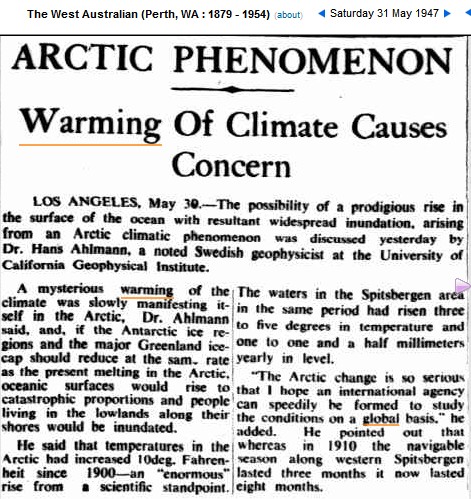
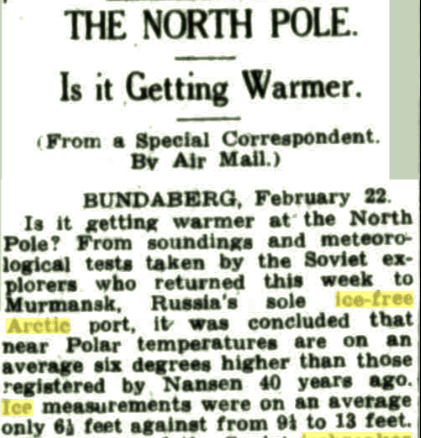
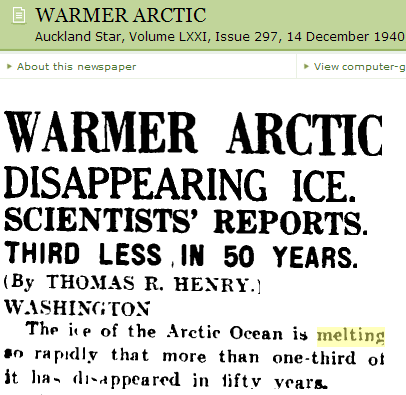
The 1930’s and 1940’s were very hot, and the poles were rapidly melting
The Courier-Mail Monday 6 May 1940
By far the largest number of local glaciers in north-east Greenland had receded very greatly during recent decades, and it would not be exaggerating to say that these glaciers were nearing a catastrophe.
Papers Past — Auckland Star — 14 December 1940 — WARMER ARCTIC
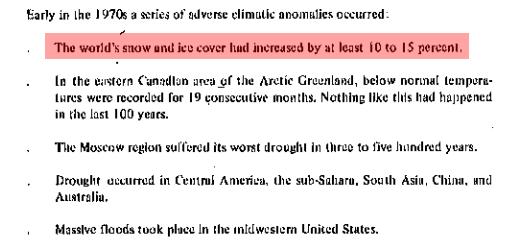
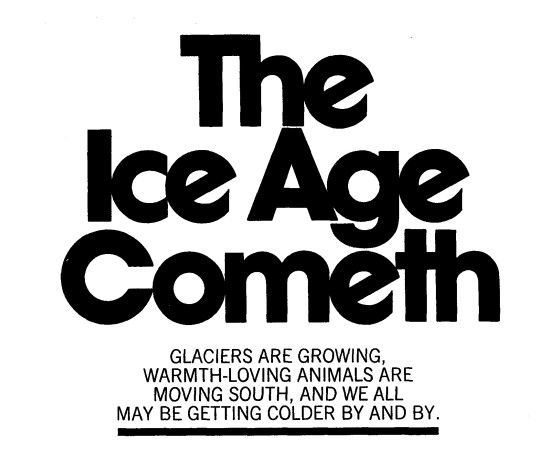
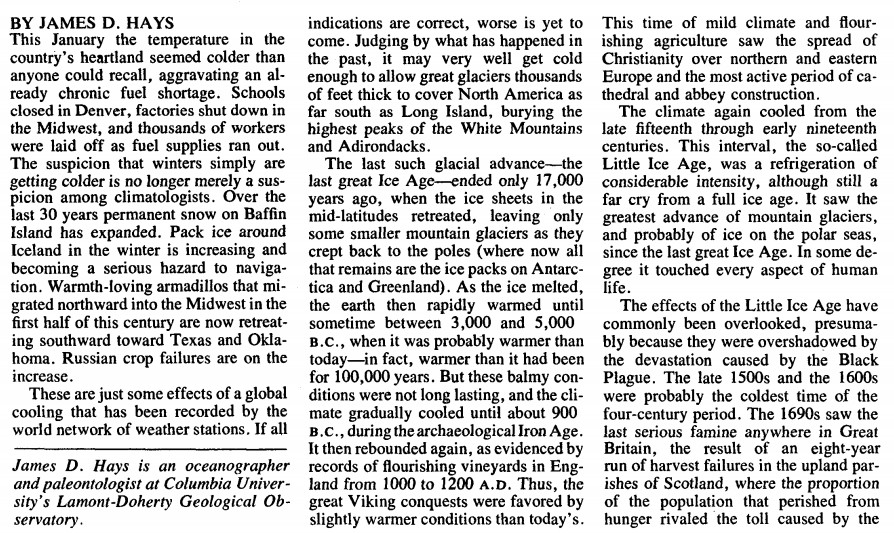
By the 1970’s, the Earth was much colder and ice was rapidly growing
PQ Archiver – ChicagoTribune.com
The Canberra Times Thursday 16 May 1974
The reality of the climate was that global temperature is not driven by CO2. This information would destroy their funding and reputation, so the world’s top climate scientists simply created a fraudulent temperature record to keep their scam alive.

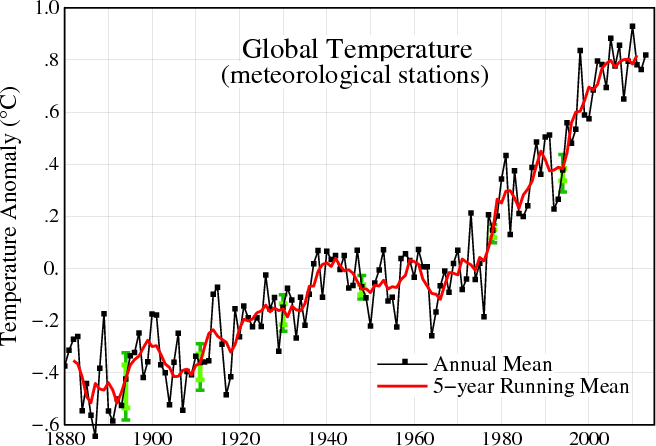



Fortunately, their technique of adjusting the past to keep the scam alive just delays their day of reckoning.
The Olympic sport for tax-parasites the world over is “Kicking the Can Down the Road”.
That is why alarmists have time begin in 1979. If they started time in 1940 and didn’t tamper with the data, they would look like complete idiots.
Why is the temperature of 1940s important when we’re already at a .8 deg rise?
Put everything back to what it was and you see the peak of the 1940s is near identical to the peak of the 1990s.
The IPCC claims CO2 didn’t start warming the planet until 1950 though; that is when we went over their ‘300ppm’ threshold. Since 1950 we have gone from 300ppm to 400ppm CO2 levels. That drastic CO2 rise is what they are trying to blame all post-Little Ice Age warming on.
So they want people to believe 1980-2000 was “unprecedented” and “alarming” and “obviously caused by man” to fit their CO2 rise …but what if the exact same trend with the exact same high point had already happened between 1920-1940, back when CO2 had nothing to do with it?
The Arctic shows us roughly what the trends would look like without the tampering
http://earthobservatory.nasa.gov/Features/ArcticIce/Images/arctic_temp_trends_rt.gif
…and absolutely no one would believe their CO2 story if Global temperature records still looked like that.
Note on that Arctic temperature graph, you can even see the attempt to fool the gullible among us. Notice how they point out the +0.48/Decade trend from 1980-2000? They want you to be really, really scared of that… but ask yourself, why don’t point out the roughly +1.00/Decade trend from 1920-1940? It’s almost like they hope people wont don’t notice that little inconvenient fact. That was 100% Natural warming. They cant erase it though; all the Ice Cores show it took place and they cant change everyone’s studies and papers. So the lesser warming of more recent decades is the only part you are supposed to pay attention to; that is the supposed scarey part they want you to believe can only be caused by Man.
Thanks, I’m a meteorologist and you’re giving me a picture that supports the skepticism about a water vapor feedback. I don’t see evidence that such warming can be reliably forecast by the IPCC.
Just posted this comment on a related thread: http://hiizuru.wordpress.com/2014/02/16/jihad/
“Andrew said: “First of all, the only group that has actually done something with the “ocean blip” is HadCRUT”
Did you read the email that was in reference? It was to Phil Jones the head of the Climate Research Unit at East Anglia. CRU is integral in producing the HadCRUT (thats where the CRU part comes from) along with the Met Office of the Hadley Center (http://www.metoffice.gov.uk/research/monitoring/climate/surface-temperature). So Wigley was discussing with Phil Jones to lower SSTs by 0.15 degrees which would have a corresponding reduction in land temps of 1.5 – 2 times that. This was exactly Goddard’s point – that they were working to reduce the 1940s – 1970s cooling by making the 1940s cooler than it really was. They knew they couldn’t adjust the 1940s land temps down if the SSTs did not go down too. This is why the Climategate emails are so important.”
you know, in doing this they may have created a little bit of a problem for themselves that no one seems to have noticed
According to NASA:
“Little Ice Age: A cold period that lasted from about A.D. 1550 to about A.D. 1850 in Europe, North America, and Asia. This period was marked by rapid expansion of mountain glaciers, especially in the Alps, Norway, Ireland, and Alaska. There were three maxima, beginning about 1650, about 1770, and 1850, each separated by slight warming intervals. “
http://earthobservatory.nasa.gov/Glossary/?mode=alpha&seg=l&segend=n
NASA identifies 1850 as one of the cold points of the Little Ice Age. Not a shock, Ice Core samples generally back this up. Coming out of the LIA was a late 1800s thing, both sides would probably agree on that.
So let’s check what it means with regards to their new recent past though
http://www.woodfortrees.org/plot/hadcrut4gl/from:1850/to:1930/plot/hadcrut4gl/from:1850/to:1930/trend
…oops…
So what does this mean? Are you saying the little ice age didn’t end in 1850? Your plot on “woodfortrees” suggests so. If the temperature didn’t rise from 1850 to 1930 then the little ice age extended to at least 1930. That might mean that the “unprecedented” warming in the last part of the 20th century was just the end of the little ice age. Is that your point?
They have left us with just two options
1 – the ‘adjusted’ records are correct – in that case, yeah, the LIA didn’t end until post 1970s really, and 1900-1920 would actually be one of the colder periods of the Little Ice Age.
2 – the ‘adjusted’ records are not correct – that means 1880-1940 stays the real rise out of the LIA (a period where temperatures eventually got as high to higher than they are now)
On the second option it would mean we are merely following the PDO thru ups and downs since coming out of the LIA; with the 1946 flip to -PDO leading to a steep decline and subsequent low point in the 1970s that threatened a fall back into LIA conditions until the PDO flipped back to positive in 1977. (the GISP2 Ice Cores show 1970 actually hit -32.0 for the first time since the period between 1832-1873. A “New Ice Age” was not as illogical as some now want people to believe)
On the first option they are getting pretty close to forcing CO2 trends and Temperature trends to match, but drastically changing perceived history along the way. Apparently they feel we would have never even left the LIA without CO2 (…and if true, shouldn’t we be celebrating CO2?) This option ran into a bit of a problem when the positive PDO ran out of gas and eventually flipped back to negative in 2008 though. Since then the El Ninos they rely on to bump temperatures up just aren’t around.
Good analysis. Thx.