COI | Centre for Ocean and Ice | Danmarks Meteorologiske Institut
What is abnormal ice?
Any ice that goes above that 1979-2000 mean.
Soon, we’ll see groups of renegade “climate scientists” heading for the Arctic, armed with ethenol-fueled flame throwers – doing anything they can to make the Arctic “nearly” ice-free by the middle of September.
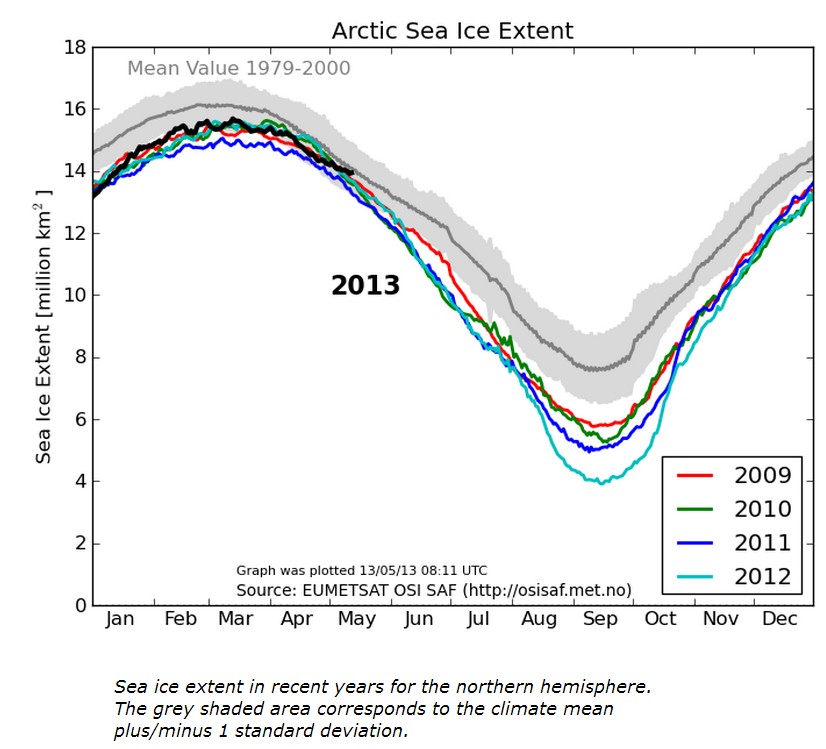
What’s the gray line?
A meaningless mean.
never mind, I see it’s the mean
2012 looks a long way below the mean like 50% below. doesn’t seem “normal” to me.
Most of us are actually living in 2013 this year.
Actually 2013 has to end b4 2013 counts. ie. show me this again in 2014
Your email address will not be published. Required fields are marked *
Comment *
Name *
Email *
Website
Save my name, email, and website in this browser for the next time I comment.


What is abnormal ice?
Any ice that goes above that 1979-2000 mean.
Soon, we’ll see groups of renegade “climate scientists” heading for the Arctic, armed with ethenol-fueled flame throwers – doing anything they can to make the Arctic “nearly” ice-free by the middle of September.
What’s the gray line?
A meaningless mean.
never mind, I see it’s the mean
2012 looks a long way below the mean like 50% below. doesn’t seem “normal” to me.
Most of us are actually living in 2013 this year.
Actually 2013 has to end b4 2013 counts. ie. show me this again in 2014