Disrupting the Borg is expensive and time consuming!
Google Search
-
Recent Posts
- ChartGL Process Control Demo
- The Biggest Money Laundering Scam
- Drought In The Headwaters Of Lake Powell
- Unrealistic Expectations Of Water Availability
- Did Bill Gates Do This?
- Worst March Drought On Record In The US
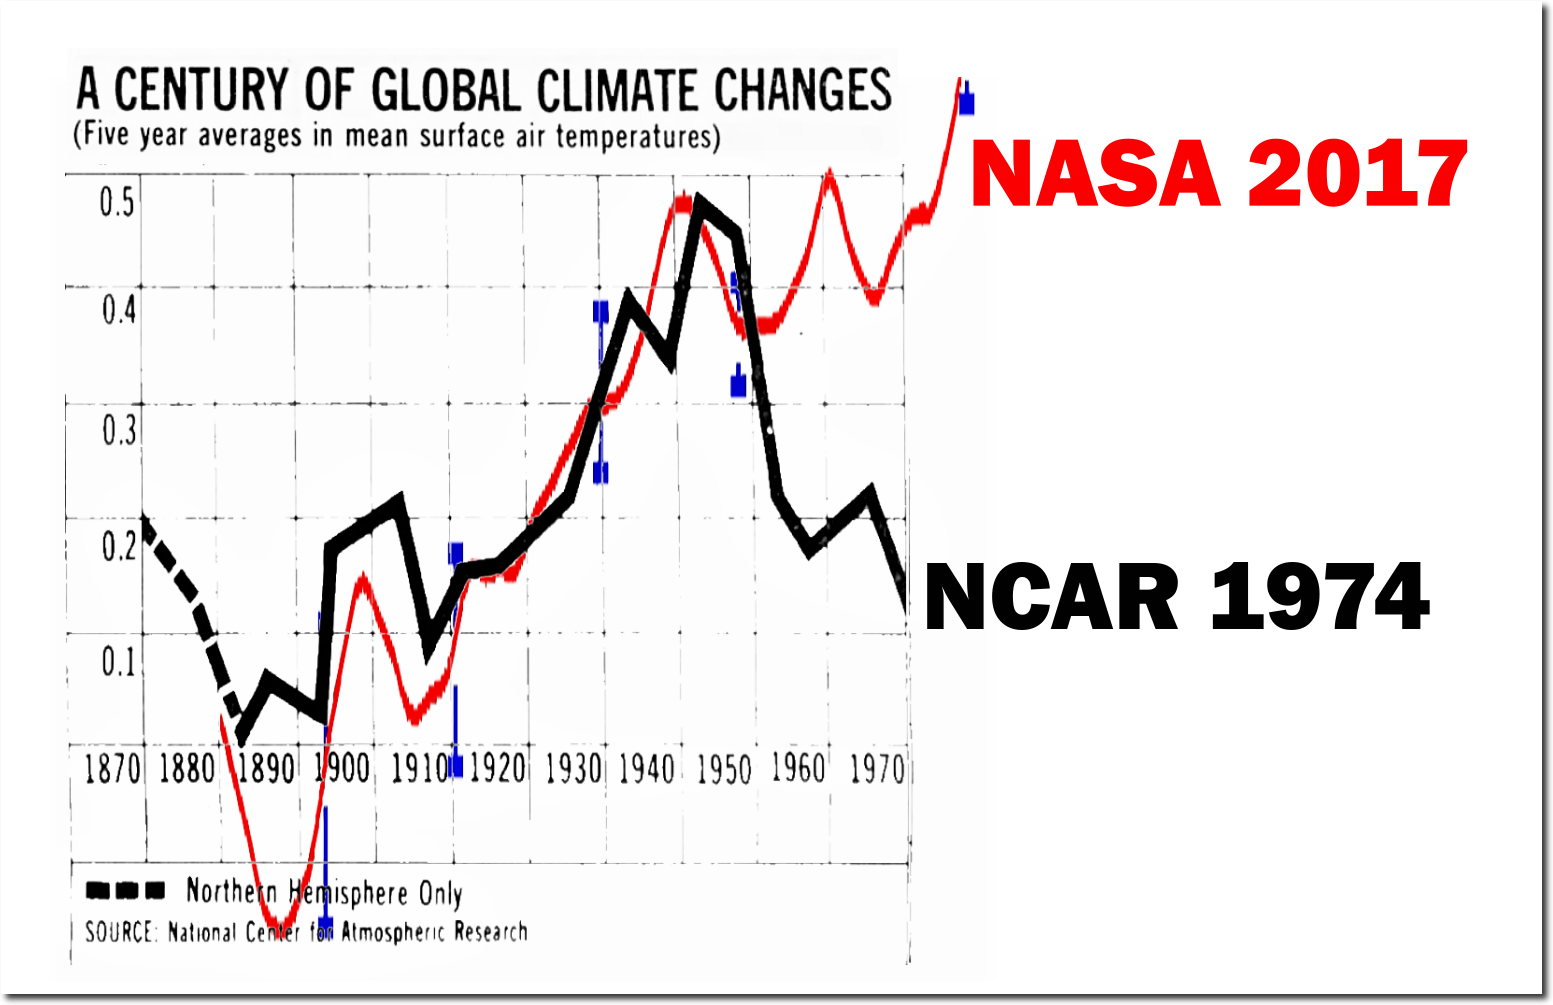
- The Real Hockey Stick Graph
- Analyzing The Western Water Crisis
- Gaslighting 1924
- “Why Do You Resist?”
- Climate Attribution Model
- Fact Checking NASA
- Fact Checking Grok
- Fact Checking The New York Times
- New Visitech Features
- Ice-Free Arctic By 2014
- Debt-Free US Treasury Forecast
- Analyzing Big City Crime (Part 2)
- Analyzing Big City Crime
- UK Migration Caused By Global Warming
- Climate Attribution In Greece
- “Brown: ’50 days to save world'”
- The Catastrophic Influence of Bovine Methane Emissions on Extraterrestrial Climate Patterns
- Posting On X
- Seventeen Years Of Fun
Recent Comments
- Gordon Vigurs on The Biggest Money Laundering Scam
- Gordon Vigurs on Unrealistic Expectations Of Water Availability
- czechlist on Worst March Drought On Record In The US
- Bob G on Did Bill Gates Do This?
- Peter Carroll on Drought In The Headwaters Of Lake Powell
- Hank Phillips on Seventeen Years Of Fun
- Hank Phillips on Did Bill Gates Do This?
- Scott Allen on Drought In The Headwaters Of Lake Powell
- conrad ziefle on Unrealistic Expectations Of Water Availability
- Gordon Vigurs on Did Bill Gates Do This?
Massive Expansion Of Thick Arctic Sea Ice Over The Past Decade
The animation below shows the extent of 5+ foot thick sea ice at present vs. the same date ten years ago. Ice thinner than five feet thick has been masked out.
As you can see, the thick ice edge has expanded about 700 miles into the East Siberian Sea.
According to NASA and NOAA, the last ten years have been the hottest on record, and most of the warming has been in the Arctic. Yet there has been a massive expansion in the area of thick Arctic sea ice.
Now compare vs. the first half of the 20th century, when the amount of thick ice was rapidly declining.
13 Oct 1940, Page 76 – Hartford Courant at Newspapers.com
Similarly, the last two years have seen near record ice gain in Greenland.
Greenland Ice Sheet Surface Mass Budget: DMI
But in 1939, the glaciers of Greenland and Norway were melting rapidly and facing “catastrophic collapse.”
17 Dec 1939, Page 15 – Harrisburg Sunday Courier at Newspapers.com
According to NASA and NOAA, Earth and the Arctic are much warmer now than they were in 1940. Yet in 1940 Arctic ice was melting, and in 2017 Arctic ice is expanding. Ice doesn’t lie, but government climate scientists do – at least 97% of the time.
Posted in Uncategorized
Leave a comment
War Makes For Strange Bedfellows
I just voted for the five Boulder City Council candidates who promised to replace Boulder’s very clean natural gas power plant with worthless, environmentally destructive windmills.
Why did I do this? Because they are also the only candidates pledged to protect the South Boulder Wetlands from the City and University of Colorado. That is where I do my wildlife photography.
Adults have to be able to make choices. And I doubt the power plan will ever actually happen. This choice was a no-brainer for me. Not perfect, but good enough.
Posted in Uncategorized
Leave a comment
1940 : Arctic Rapidly Melting – How Does NASA Respond?
One third of Arctic sea ice disappeared between 1890 and 1940, when CO2 levels were below 310 PPM.
13 Oct 1940, Page 76 – Hartford Courant at Newspapers.com
Glaciers in Greenland and Norway were melting rapidly and facing “catastrophic collapse.”
17 Dec 1939, Page 15 – Harrisburg Sunday Courier at Newspapers.com
The facts wreck global warming theory, so NASA quite predictably responded by erasing the 1940’s Arctic warmth.
Data.GISS: GISS Surface Temperature Analysis
According the the article above, peak ice thickness in 1940 was 218 cm. – which is considerably less than the current peak ice thickness.
CICE_combine_thick_SM_EN_20171107.png
There are many indications that the 1940’s were as warmer or warmer than the present, and that government climate scientists intentionally erased the warmth.
Global warming is not about science. It is about billions of dollars of government funding corrupting academia.
Posted in Uncategorized
Leave a comment
Partying With Climate Alarmists
I spent yesterday evening celebrating at the Hotel Boulderado with a group of hard core climate alarmists, who are convinced that Boulder’s immaculately clean natural gas fired power plant is somehow “dirty.”
One of the people I enjoyed talking to was Lori Hunter, who had just given a lecture on campus about global warming induced migration from Mexico.
I pointed out to Lori that every time I go to Mexico, it seems to be full of Canadians escaping the cold.
So why was I celebrating with a group of climate alarmists? Because they shared my goal of stopping CU and the city from developing the South Boulder Wetlands.
Another attendee was a guy who is starting an alternative news source in Boulder, and told me he would be happy for me to write articles representing conservative positions. Boulder is seeing a political change. And I am starting to educate good people how they have been misled by fake climate scientists.
Yesterday was the second coldest November 7 on record in Boulder.
Maximum temperature yesterday was 0C. Only 1991 was colder. Apparently the group’s efforts to cool the planet are working.
Yesterday may also have been the snowiest November 7 on record here. I suspect that we received more than four inches of snow – which was the prior record from 1986.
Posted in Uncategorized
Leave a comment
100% Confidence Of Incompetence In The National Climate Assessment
Page 14 of the National Climate Assessment says that there are only three factors which influence the climate – Humans 101%, Solar 1% and Volcanic -2%.
Somehow, the world’s top scientists forgot about the oceans, which actually drive the climate. The Atlantic Multidecadal Oscillation has a 60 year cycle, and shows almost perfect correlation with lower troposphere temperatures.
Wood for Trees: Interactive Graphs
Note that there is one spaghetti strand in the graph above, where the satellite temperatures are diverging from the AMO. Roy Spencer appears to be concerned about the quality of recent satellite data. Keep an eye on that.
UAH Global Temperature Update for October 2017: +0.63 deg. C « Roy Spencer, PhD
It defies explanation how the world’s top climate scientists could have forgotten about the oceans.
Posted in Uncategorized
Leave a comment
New Video : 100% Confidence Of Incompetence In The National Climate Assessment
Posted in Uncategorized
Leave a comment
Visualizing NOAA/NASA US Data Tampering
In 1991, NOAA showed little or no US warming and correctly showed the 1930’s as the hottest decade in the US. They showed the mean US temperature from 1901 to 1990 as 11.4C.
www1.ncdc.noaa.gov/pub/data/cmb/bams-sotc/climate-assessment-1981-1990.pdf
NOAA has since cooled the past, and now show the mean US temperature from 1901 to 1990 as 11.1C.
Climate at a Glance | National Centers for Environmental Information (NCEI)
The next graph overlays the 2017 graph on the 1991 graph, at identical scales on both axes. NOAA creates US warming by cooling the past.
NASA does exactly the same thing. Their 1999 US temperature graph correctly showed the 1930’s as the hottest decade in the US, with subsequent cooling through the end of the century.
NASA has since cooled the period 1920-1950, and massively warmed post-1980 temperatures, to turn the cooling trend into a warming trend.
The next graph overlays the 2017 NASA graph on the 1999 NASA graph, with identical scales on both axes.
The US is the only place on Earth with reliable long term temperature data, and both NASA and NOAA have tampered with the data to turn post-1930 US cooling into warming.
But it is much worse than it seems. NOAA has almost no daily temperature data outside of North America prior to 1930, and very little prior to 1950.
In 1974, the National Center for Atmospheric Research showed no net global warming prior to 1970, and a sharp cooling after 1945.
21 Jul 1974, 13 – The Des Moines Register at Newspapers.com
NASA has completely erased the post-1945 cooling, and created a large amount of warming prior to 1970.
The US temperature data has been tampered with to turn cooling into warming, and the global temperature data prior to 1950 is simply fake. It is time to put this global warming scam down once and for all.
Posted in Uncategorized
Leave a comment


