NASA : Erasing The Past To Bring Funding To The Present

Ninety-five years ago, the Arctic was getting hot with a radical change in climate conditions, and glaciers were disappearing.

02 Nov 1922, Page 8 – The San Bernardino County Sun at Newspapers.com

Fake data from NASA now says Earth was cooling, and 1922 was one of the coldest years on record.

Data.GISS: GISS Surface Temperature Analysis: Analysis Graphs and Plots

Posted in Uncategorized | Leave a comment

Where Did The Cooling Go?

January 30, 1961 – NYTimes

During the 1960’s and 1970’s – everyone understood that Earth was cooling.

29 Oct 1971, Page 21 – The Daily Times-News 

14 Jul 1974, Page 1 – Lincoln Evening Journal

This didn’t suit NASA’s funding agenda, so they simply erased it.

graph.png (1130×600)

Climate science has nothing to do with science. It is based on fraudulent data, fraudulent models, fraudulent science and is being pushed by useful idiots, corrupt journalists, crooks and commies.

Posted in Uncategorized | Leave a comment

Very High Confidence Of Extreme Fraud By Government Climate Scientists

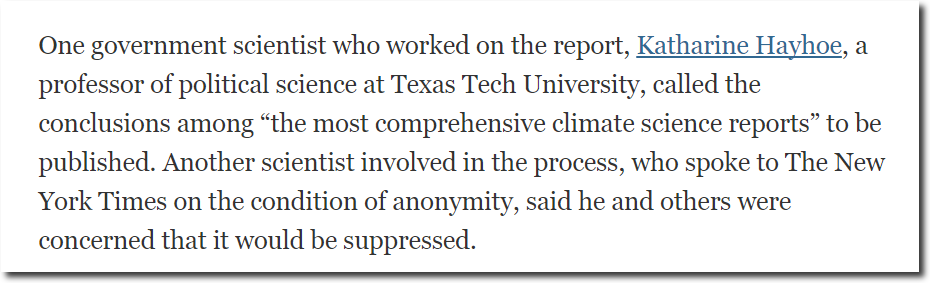
A large group of government scientists are attempting to influence policy by leaking this report to the New York Times. The report is chock full of fraud, lies and data tampering.

Read the Draft of the Climate Change Report – The New York Times

Let’s look at a few of the innumerable attempts to deceive the public in this report.

The first one I am discussing is an attempt to hide the extreme heat in the US prior to 1960 “the frequency of heatwaves has increased since the mid-1960s

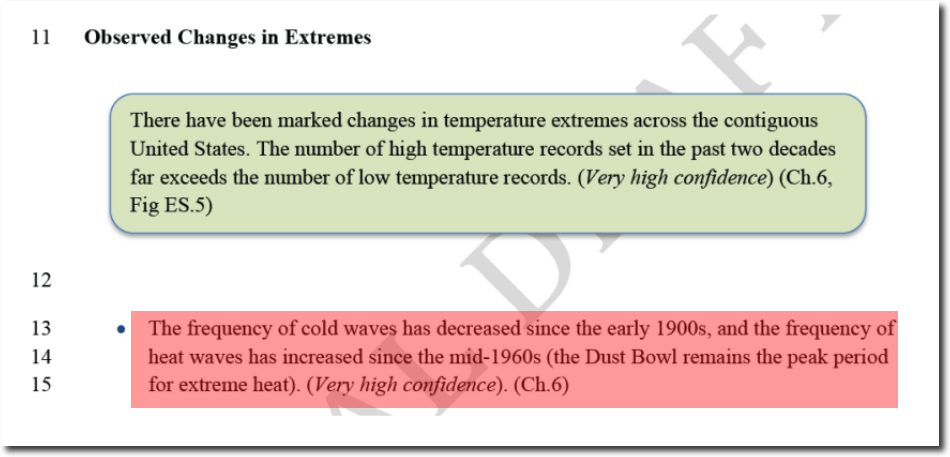
The report has one sentence saying “the Dust Bowl remains the peak period for extreme heat.” But immediately below that they have a graph which fails to show the extreme heat of the 1930’s.

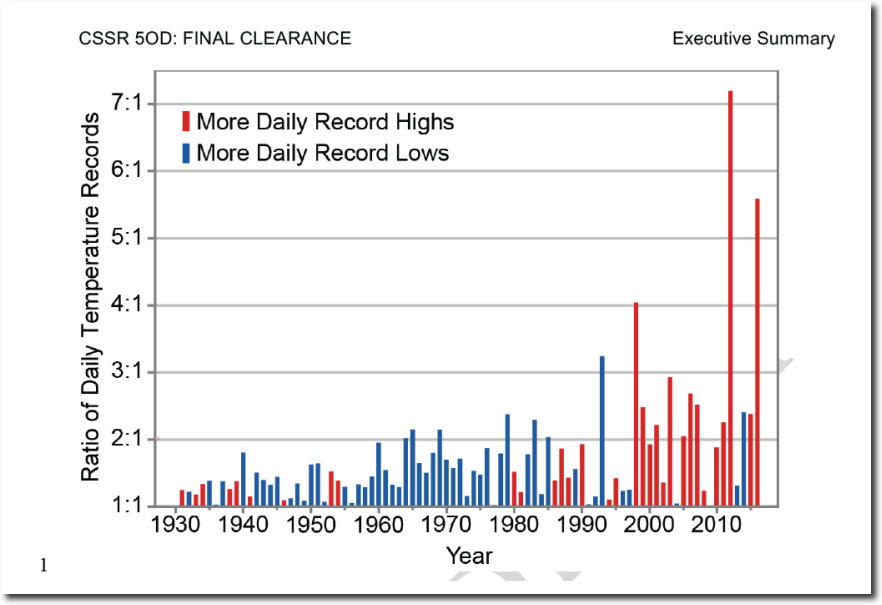
This graph above is a classic divide by zero error.  The frequency of both record lows and record highs has decreased. When you divide by a small number, you get a large number approaching infinity – as seen on the right side of the graph above. No serious scientist or mathematician would make that mistake.

Actual data using the most stable set of stations, shows a sharp decline in the number of both record maximums and record minimums in the US. Note that my graph below shows the Dust Bowl, while their fake graph doesn’t.

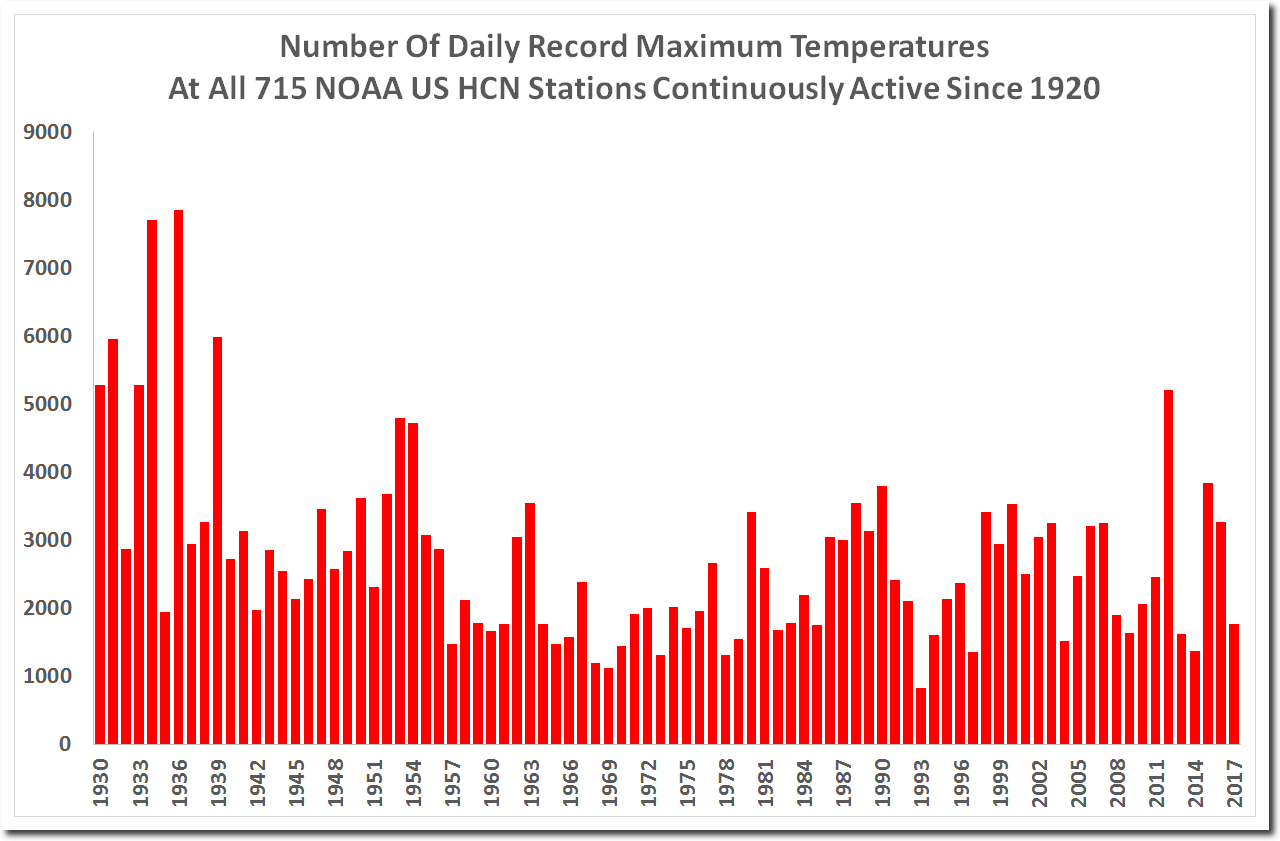
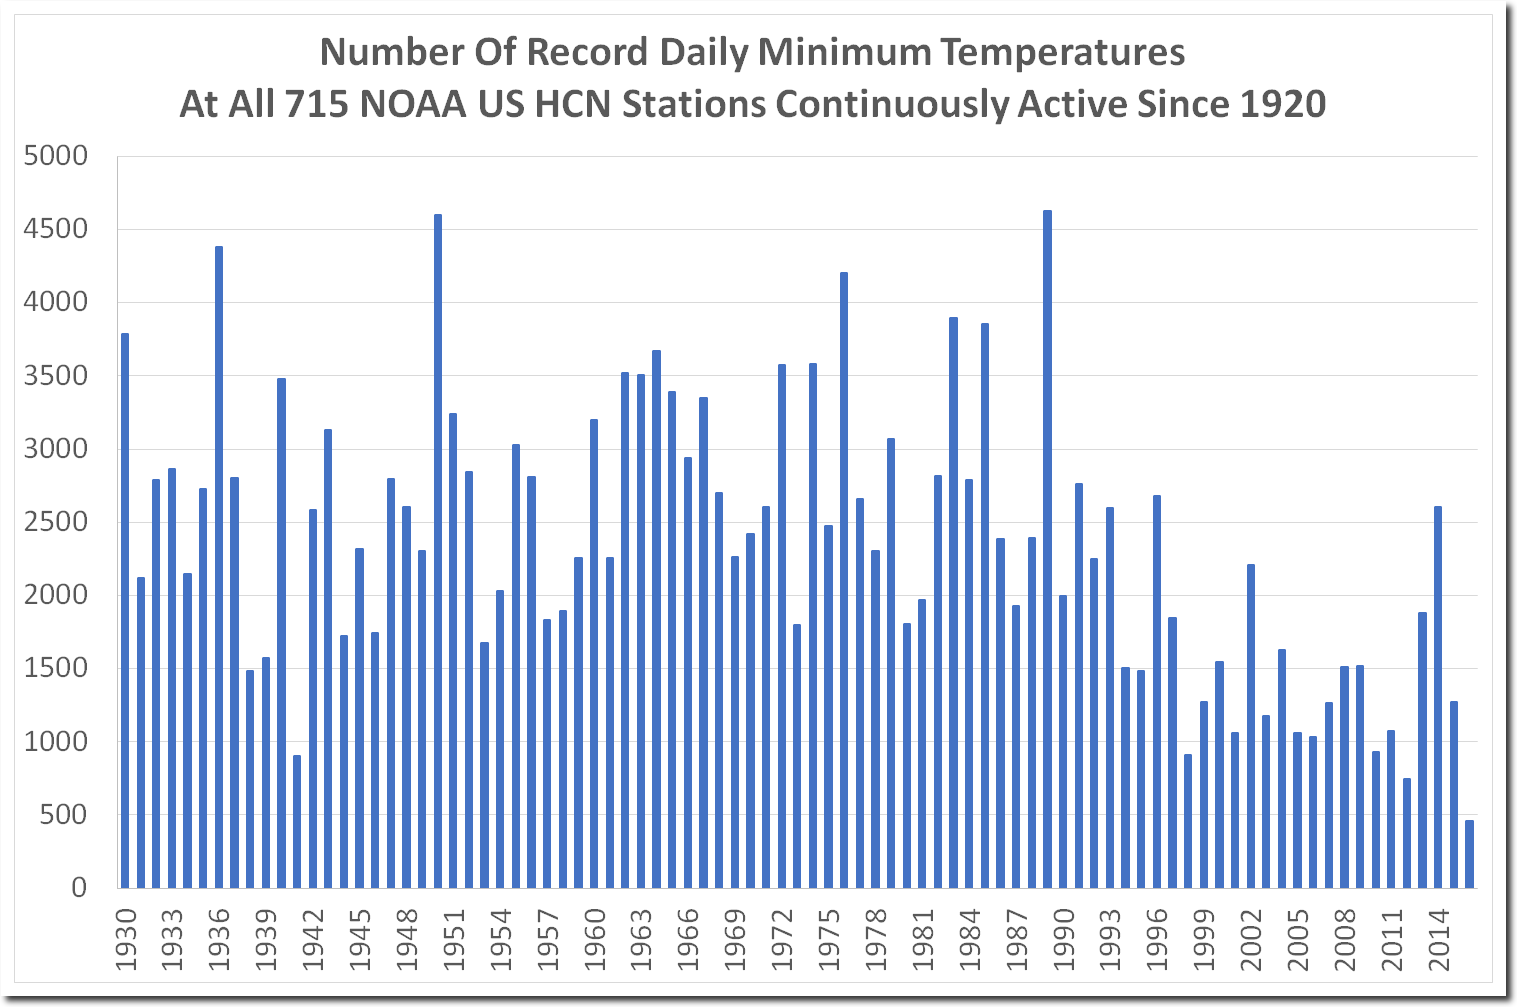
Extreme heat and cold peaked in the US in the 1930s, and has been declining ever since.
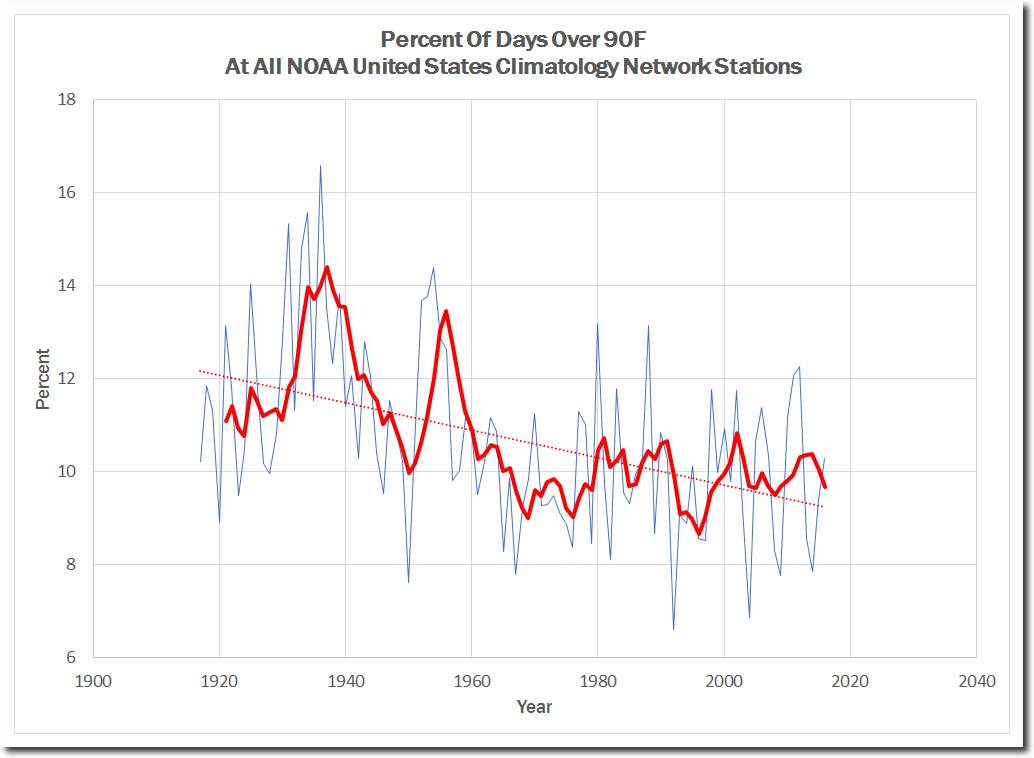
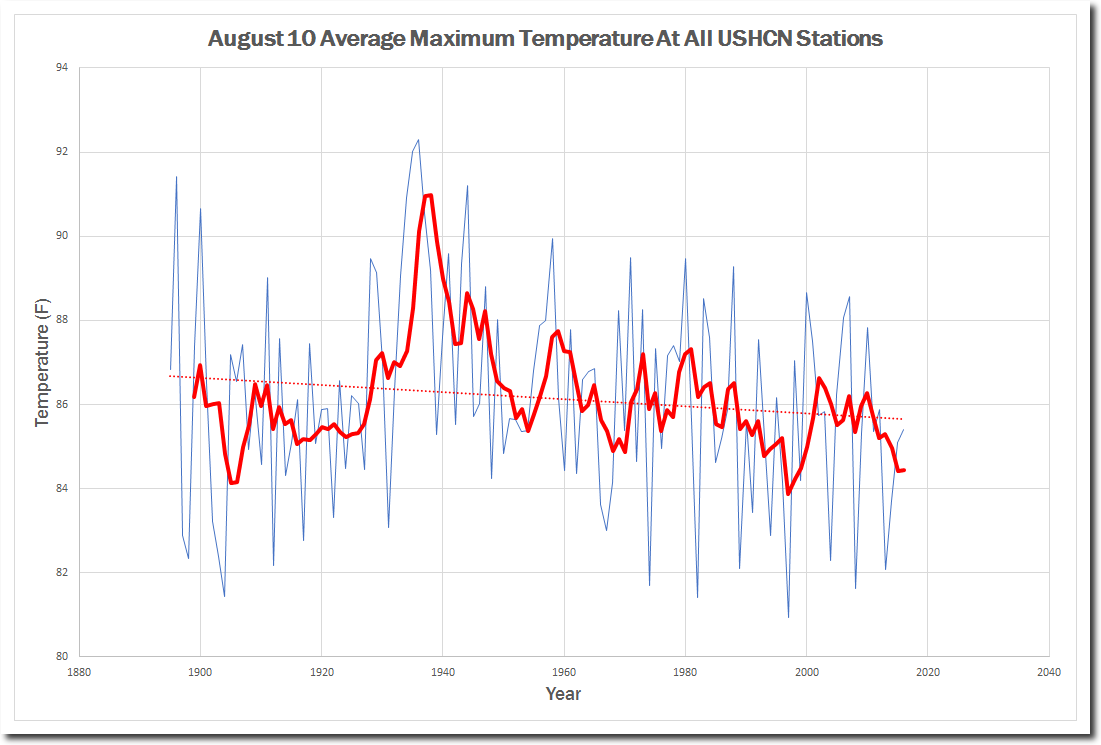
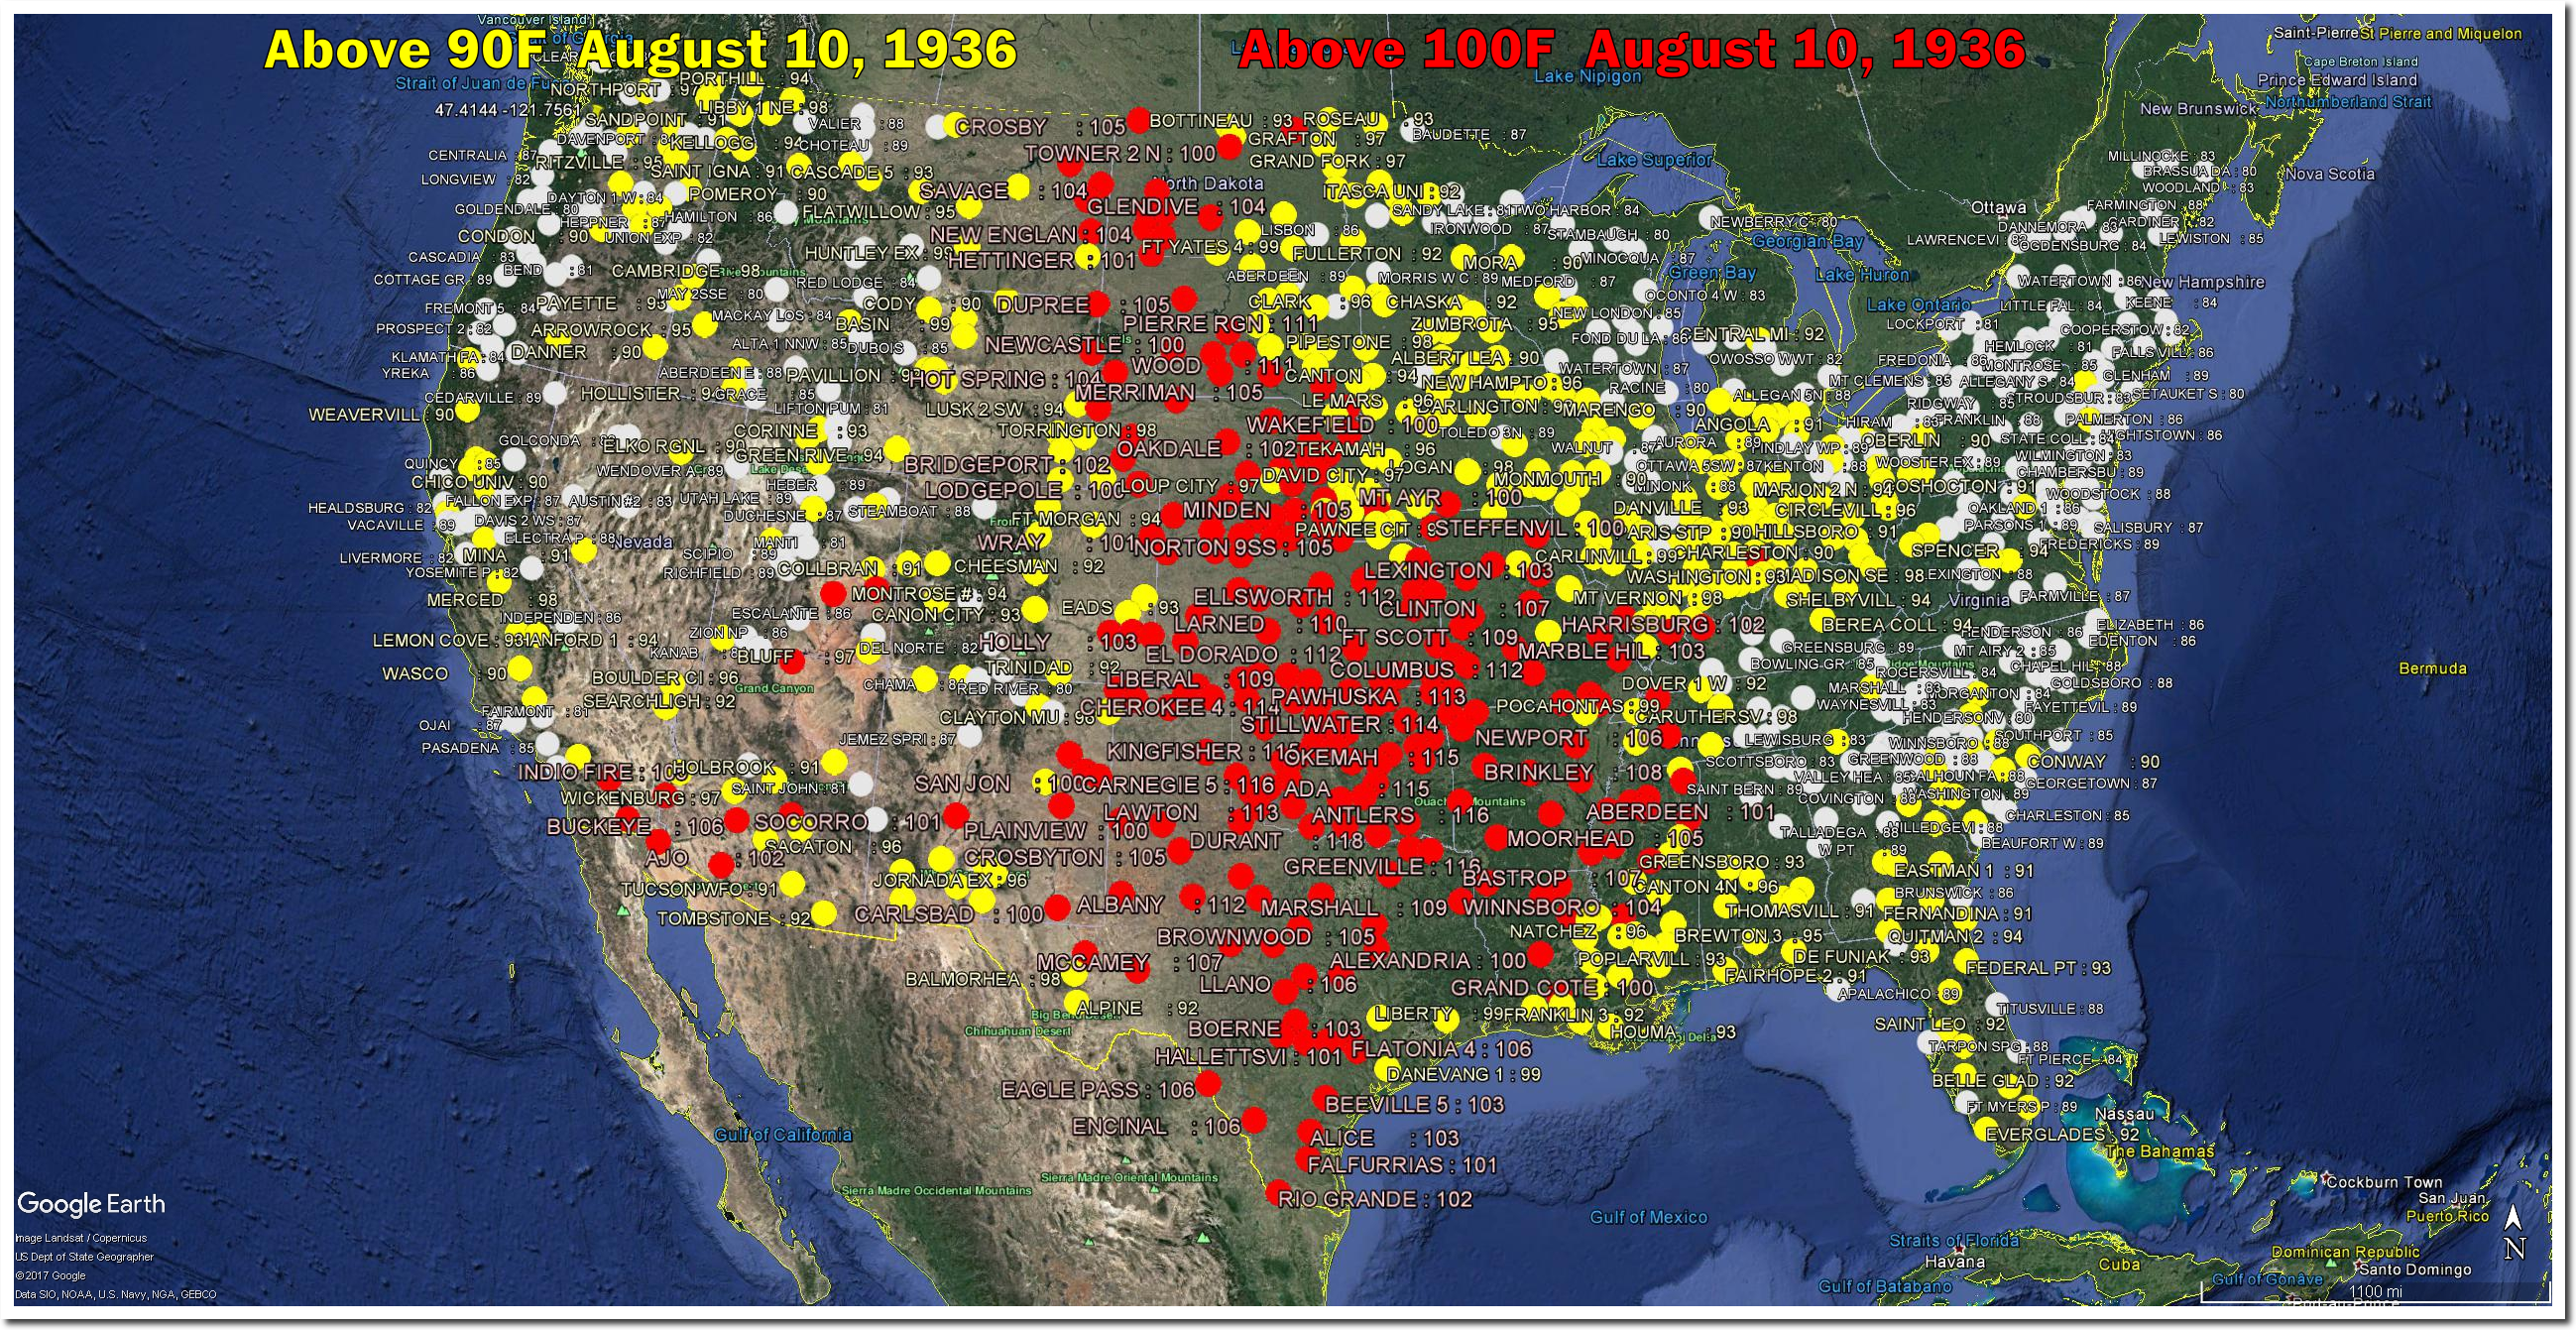
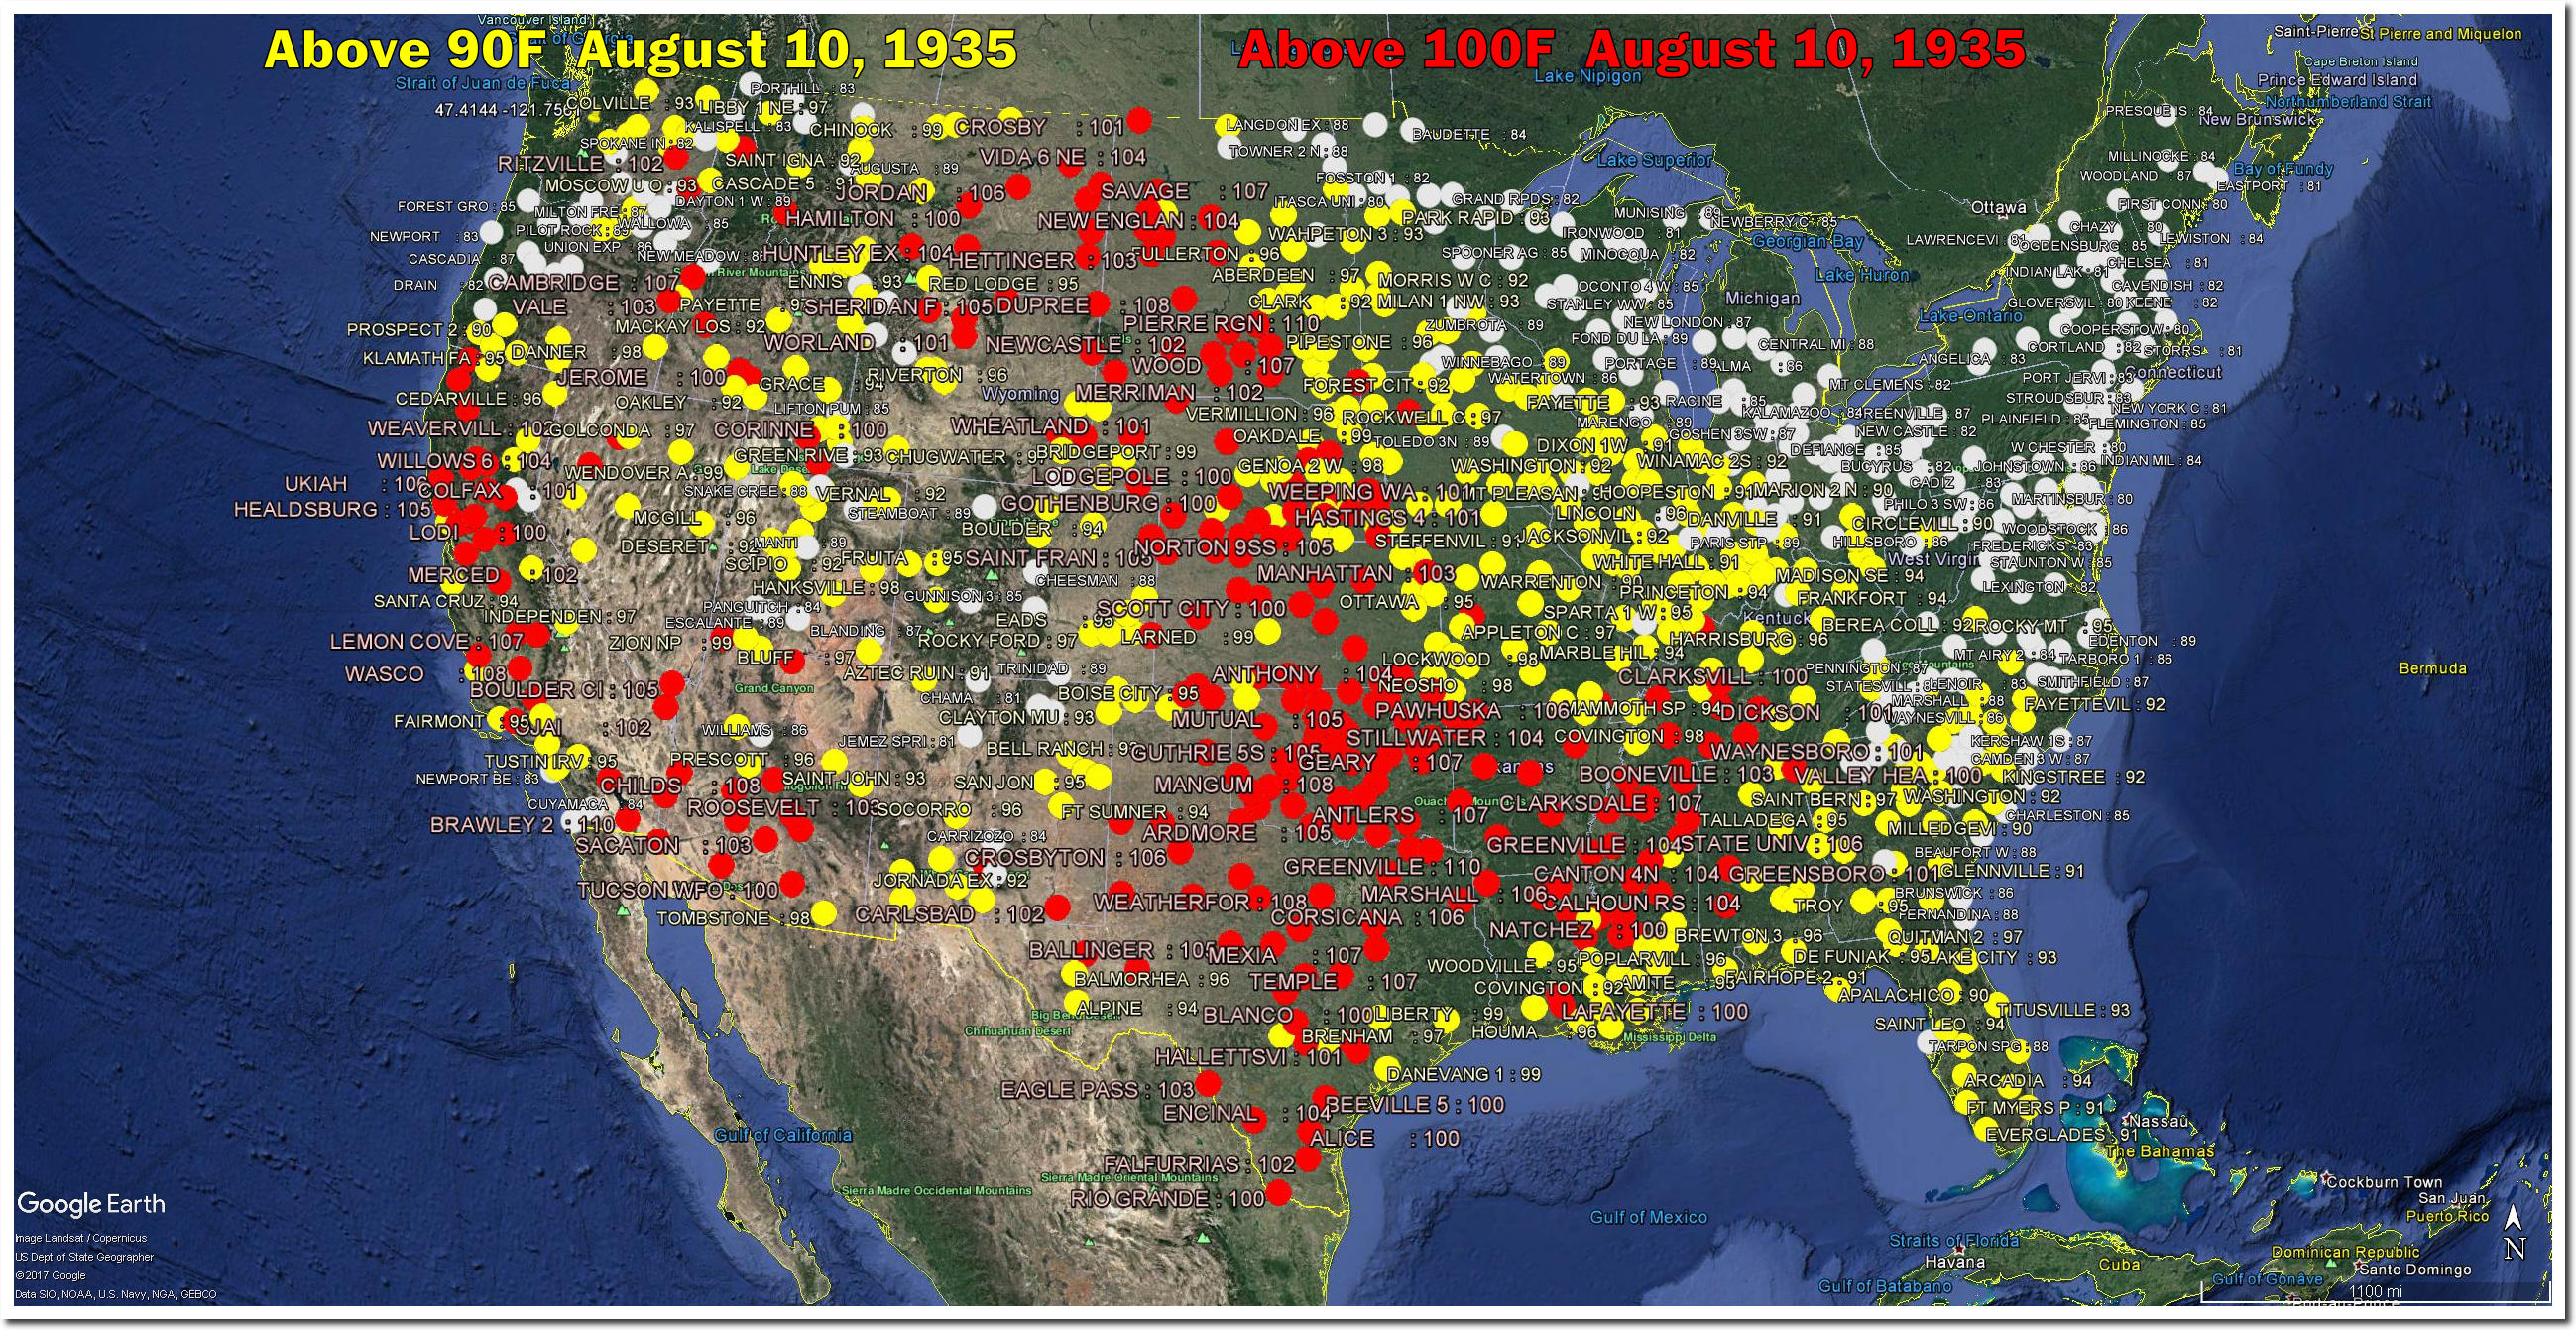
Next let’s look at their claim the number (of days) above 90°F will rise (very high confidence)”

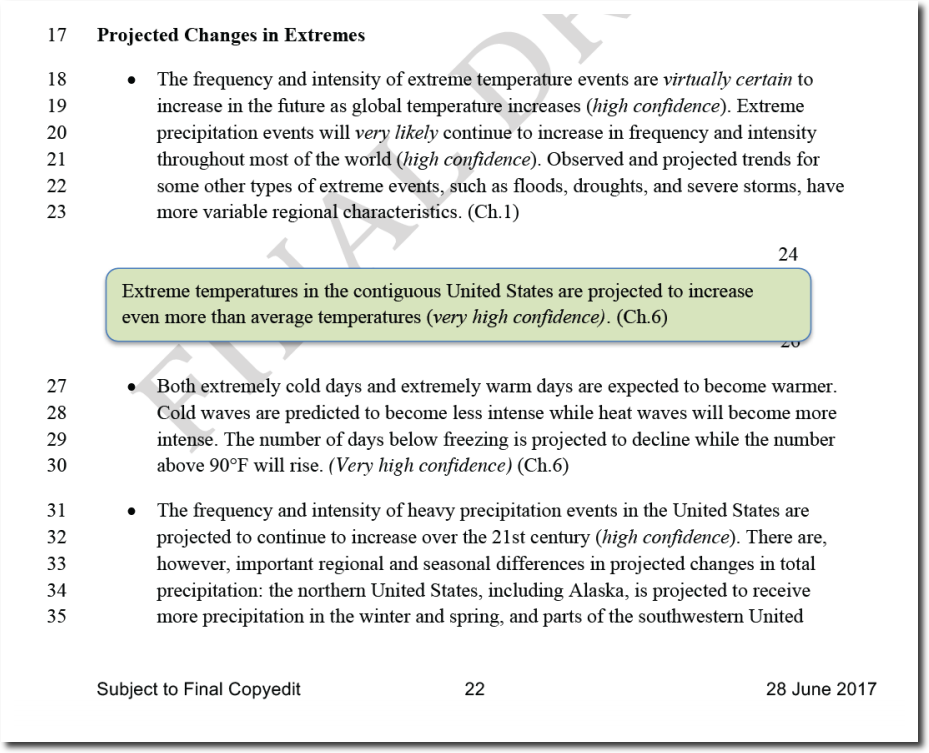
The NOAA actual data shows the exact opposite. The frequency of 90 degree days has plummeted in the US over the past century. You can also see why they are trying to hide the heat prior to the 1960’s – the US was much hotter prior to the 1960s.  Also note that this data is not subject to any adjustments, as NOAA does not adjust daily temperatures. I have very high confidence that these people are not scientists. No scientist would commit fraud like these people are doing.

Final claim I am going to look at right now is this one saying that US temperatures have risen 1.8 degrees since 1901.

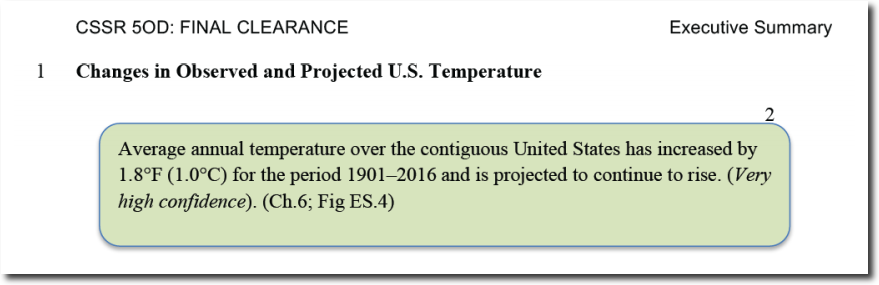
Actual NOAA data shows there is no trend in US temperatures, and that the hottest weather occurred eighty years ago.

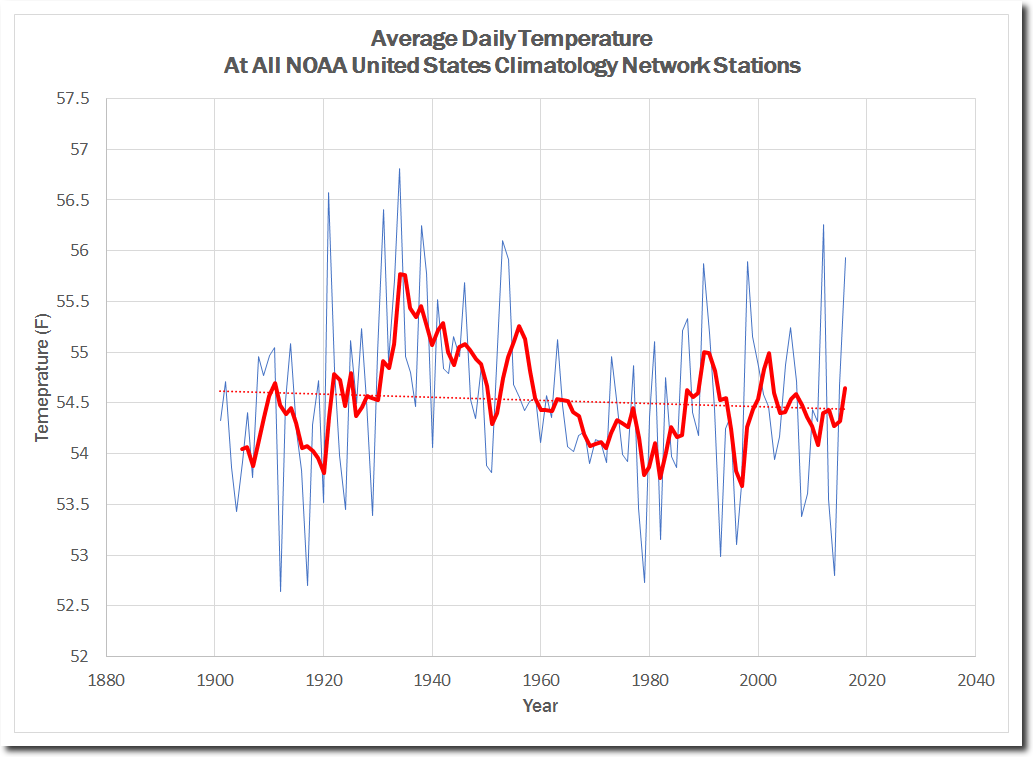
Note that my graph agrees with this 1989 report from NOAA, reported in the New York Times.

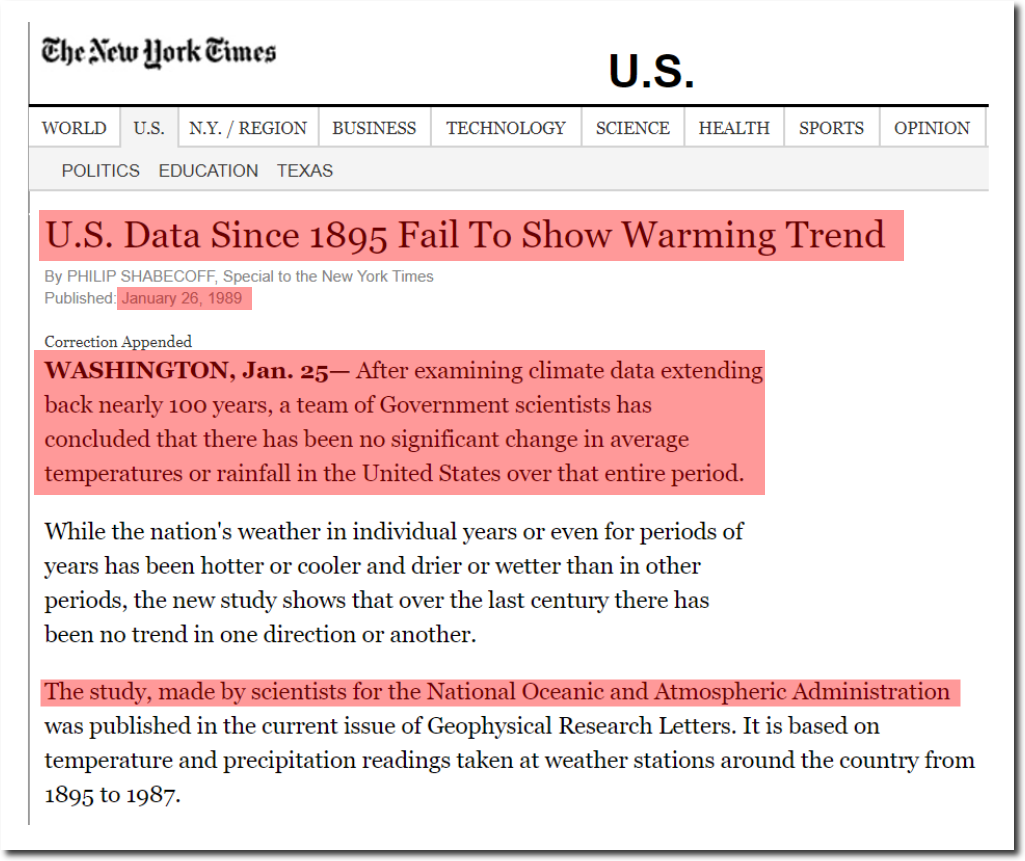
U.S. Data Since 1895 Fail To Show Warming Trend

NOAA also reported in 1989 that Earth cooled from 1921 to 1979, and that most global warming occurred before 1919.

07 Dec 1989, Page 14 – Santa Cruz Sentinel

The 1995 IPCC report showed no evidence of troposphere warming since 1958.

ipcc_sar_wg_I_full_report.pdf

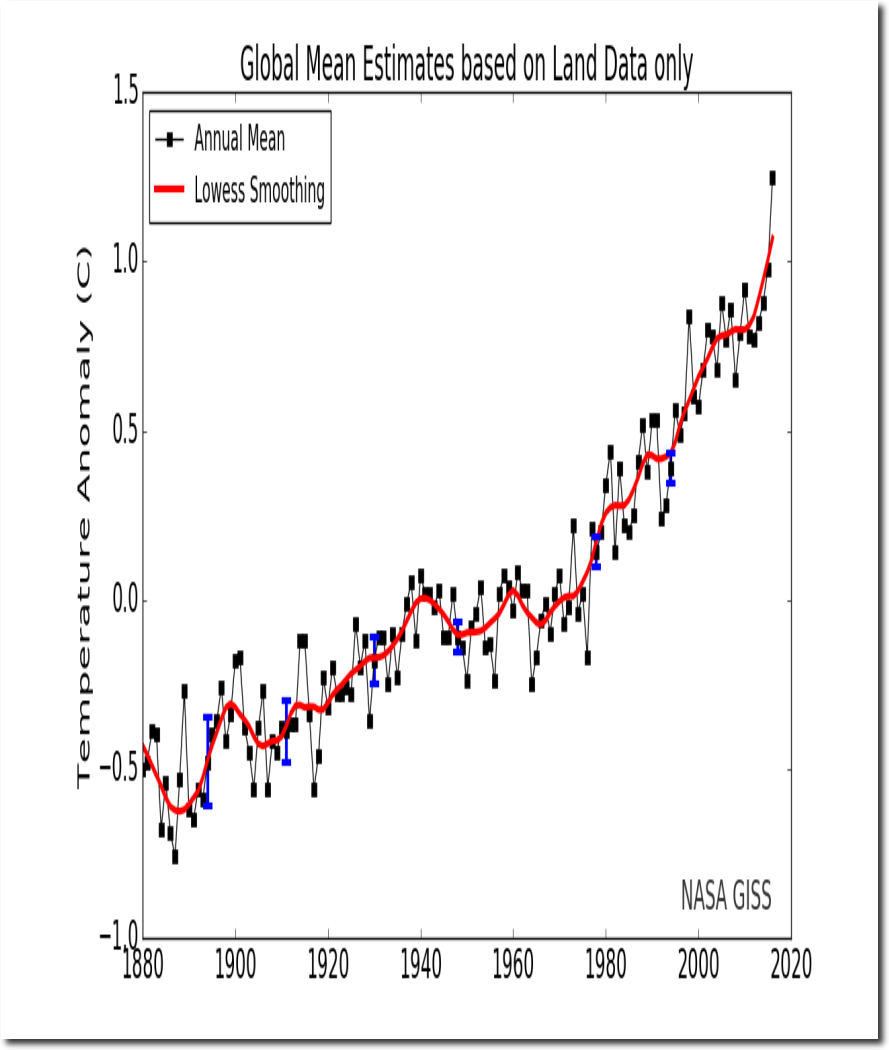
My graph also agrees with this 1999 report from NASA.

Empirical evidence does not lend much support to the notion that climate is headed precipitately toward more extreme heat and drought…. in the U.S. there has been little temperature change in the past 50 years, the time of rapidly increasing greenhouse gases — in fact, there was a slight cooling throughout much of the country

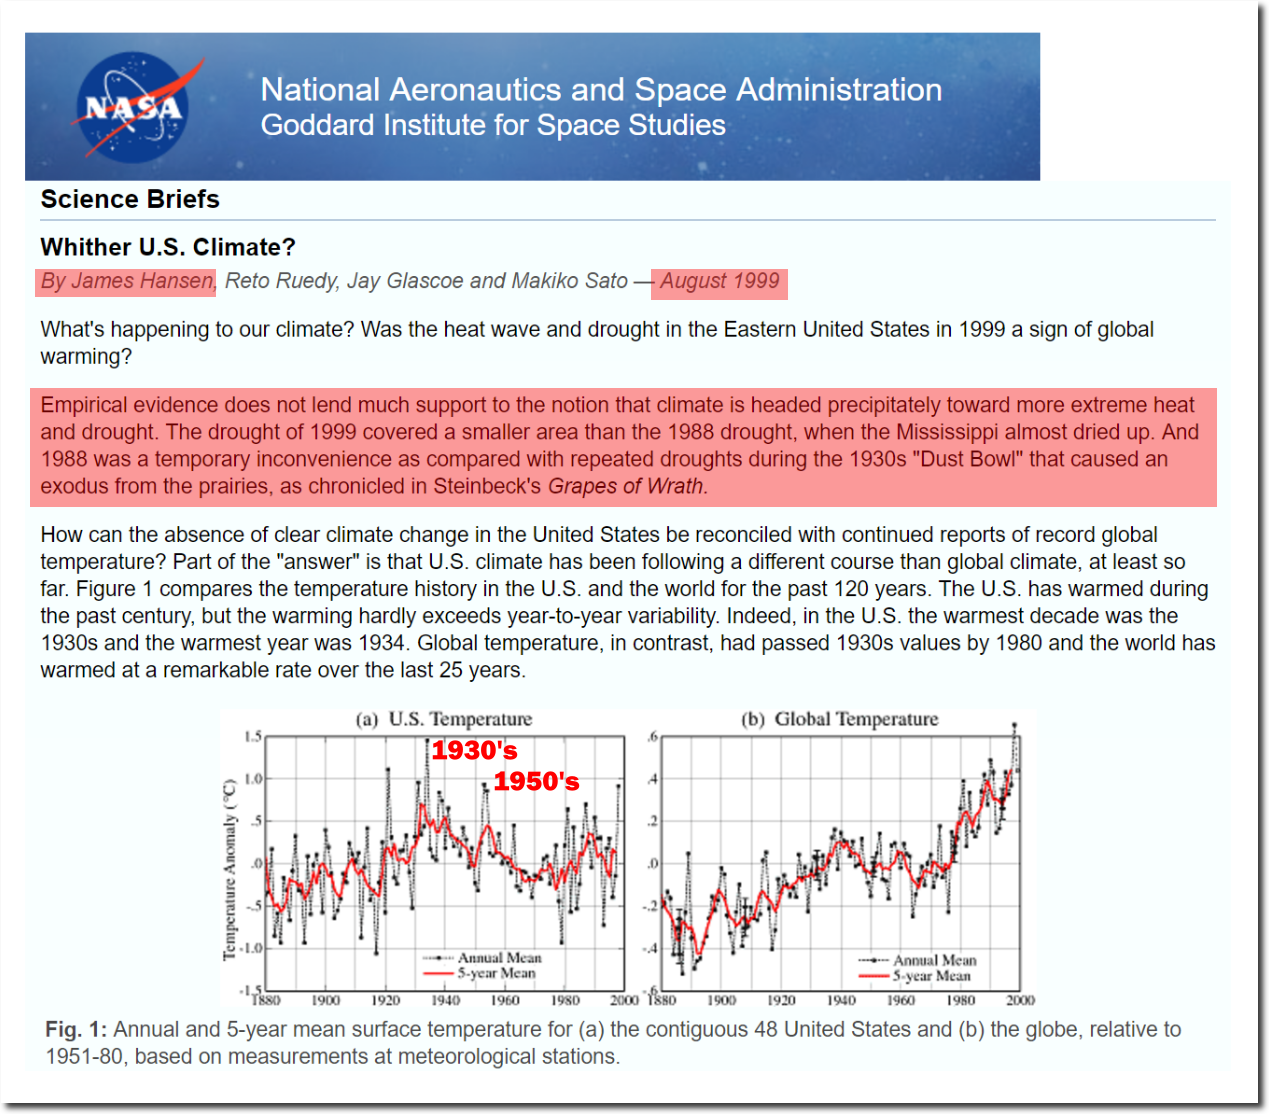
NASA GISS: Science Briefs: Whither U.S. Climate?

All of the claimed warming is due to data tampering by these same government agencies since 1999.

 1999 Version   2017 Version

The fact that so many signatories from so many government agencies signed off on this fake report, shows the depths of corruption at government agencies. This is racketeering and fraud – not science.

Posted in Uncategorized | Leave a comment

Visualizing The Effects Of CO2 On The Natural World

This young Whitetail buck was right next to the trail, and for some reason I didn’t have a real camera with me yesterday.


CO2 is even affecting the Sun, causing all the sunspots to disappear.

Posted in Uncategorized | Leave a comment

Sun Seen Here Preparing For The Eclipse

The Sun’s lone spot is about to disappear.

Posted in Uncategorized | Leave a comment

August 10, 1936 – Hottest Day On Record in Arkansas And Louisiana

August 10 used to be a very hot day in the US, but over the last 80 years August 10 temperatures have plummeted. The US has experienced five August 10ths since 1895 which averaged higher than 90 degrees – 1936, 1935, 1896, 1944 and 1901. All more than 70 years ago. Recent August 10 temperatures have been very cool in the US,  and the cooling trend continues. Here in Boulder it already feels like October

On this date in 1936, Arkansas was 120 degrees and Louisiana was 114 degrees. The hottest temperatures ever recorded in those states.

In 1935, the heat was even more widespread, but not as intense.

August 1896 was also extremely hot, and came not long after the hottest month on record in Southeast Australia – January, 1896.

TimesMachine: August 18, 1896

These sort of temperatures are incomprehensible now, and climate scientists like Katherine Hayhoe have had to ramp up their fraud, racketeering, collusion and lies to spectacular levels – in a desperate effort to keep funding for their scam alive.

Scientists Fear Trump Will Dismiss Blunt Climate Report – The New York Times

Posted in Uncategorized | Leave a comment

New Video : Very High Probability Of Fraud By Climate Scientists

Posted in Uncategorized | Leave a comment

Arctic Summer Crashes And Burns

Summer at the North Pole has ended 10 days early, after below normal temperatures every single day.

Ocean and Ice Services | Danmarks Meteorologiske Institut

Arctic sea ice extent is right where it always is this time of year.

Ocean and Ice Services | Danmarks Meteorologiske Institut

ims_data.jpg (1092×793)

Arctic ice extent is about the same as 1971.

1971   2017

Nothing but cold in the forecast.

10-Day Temperature Outlook

Greenland’s surface has gained huge amounts of ice over the past year.

Greenland Ice Sheet Surface Mass Budget: DMI

Meanwhile, Lewis Pugh is back scamming the Arctic.

This Speedo-Clad Environmentalist Is Swimming Through the Melting Arctic – Atlas Obscura

In 2008, he tried to kayak to the North Pole, based on junk science from Mark Serreze. Pugh made it about 20 miles out of the 800 miles he planned to kayak, before he got blocked by ice.

BBC NEWS | UK | Swimmer aims to kayak to N Pole

North Pole could be ice free in 2008 | New Scientist

This scam goes on year after year, decade after decade.

Posted in Uncategorized | Leave a comment

Your SUV – Melting Glaciers For 160 years

Washington’s most famous glacier retreated 3,200 feet and lost 200 feet of thickness between 1857 and 1918.

02 Sep 1918, Page 5 – Albuquerque Journal 

According to fake temperature data from NASA, earth was cooling towards record lows during this period of rapid glacial melt.

Data.GISS: GISS Surface Temperature Analysis: Analysis Graphs and Plots

Posted in Uncategorized | Leave a comment

Top Pictures From This Afternoon

Posted in Uncategorized | Leave a comment